
Smarter means Safer: How can the Use of Data Predict Coastal Flood Risk?
Scientific Reports recently published a new paper- Past and Future Hurricane Intensity Change along the U.S. East Coast, which finds that climate change could alter wind shear in a way that could deliver more powerful hurricanes to the East Coast.
As earlier studies show, rising sea surface temperatures will lead to an increase in hurricane intensity. This was the first study to find that rising anthropogenic greenhouse gases in the atmosphere will weaken the vertical wind shear along the East Coast, which will in turn, enable further intensification of hurricanes that make landfall in this region.
Despite climate change being typically a slow process, the models point to the possibility of these anthropogenic effects emerging quickly. One model in particular, with a larger number of simulations, indicated that these effects could start to be seen around the year 2040.
There is Hope!
Now there is a new online tool compiles NOAA water-level data and storm forecasts to help coastal residents prepare for floods.
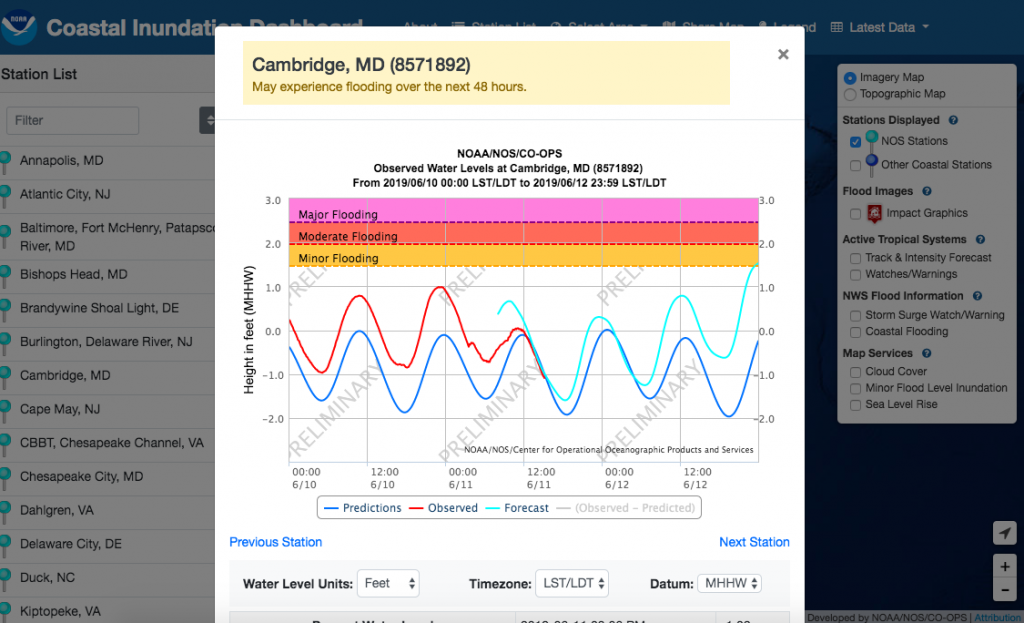
The Coastal Inundation Dashboard, released this week by the National Oceanic and Atmospheric Administration, compiles real-time water level readings, 48-hour forecasts, storm surge and historic flooding information to give users a comprehensive picture of the approaching risk. According to officials, the goal is to give coastal residents the best chance to prepare for—and bounce back from—storm surge and rising water levels.
“Local emergency managers and coastal communities can more easily monitor water levels and make decisions before, during and after a storm to ensure they are more resilient to coastal flooding”, explained Nicole LeBoeuf, acting director of NOAA’s National Ocean Service.
If water levels rise above a certain level at a particular station, the dashboard updates to reflect whether the flood risk is minor (low risk of property damage), moderate (threats to property and life) or major (significant risk to life and property). The baseline water levels are determined either by the National Ocean Service or local NOAA National Weather Service forecast offices.
The dashboard displays each water level station as a turquoise pin on a map of the United States. Areas with active flood risks are highlighted with pulsing red lines, and users can zoom in on specific locations by double-clicking. Once selected, each pinpoint displays the station number, observed water levels, the latest readings for wind speed and barometric pressure, and information on recent and upcoming high tides. Those data points recently predicted a minor risk of flooding for multiple locations in Maryland, including Solomons Island, Annapolis and Cambridge.
 Source: Nextgov
For additional uses of big data for homeland security and public safety purposes, read our Big Data & Data Analytics – Hardware, Software & Services Market in National Security & Law Enforcement: 2019-2022 <<<CLICK HERE>>> for the full report.
For more information, contact Naomi Sapir:
naomi@homelandsecurityresearch.com