Top
HSRCCBRN & HAZMAT Incidents Decontamination: Technologies and Global Market – 2012 Edition
Placeholder

CBRN & HAZMAT Incidents Decontamination: Technologies and Global Market - 2012 Edition

$5.4 Billion by 2016, 30 Submarkets

  • Q2 2012
  • 245
  • 114
    • 2450 $
    • 3450 $
    • 5950 $
    • 6000 $

    Small Businesses, Startups & Academia - Up to 50% Off

Quantity
IBM
Amazon
Sandia National Lab
HITACHI
Thales
Smiths Detection
Nuctech
Korea Internet & Security Agency
L3Harris
Huawei
Leidos
NEC
Toshiba
Deloitte
MAG

Want to customize this report?

If you purchase this report, you are entitled to a 30% discount towards customizing it, to better fit your market research and strategic needs. Our Custom Research and Industry Insights Department will work with you to better understand your information gaps and strategic needs and will provide you with a tailor-made market research report within a short period of time.

Why Choose Us?

30+ Years of Experience
We are a multidisciplinary team of Transformational Technologies industry experts with over 30 years of experience.
Gold Standard
With over 950 private sector clients (73% repeat customers), including major defense and security vendors, and Forbes Global 2000 companies, HSRC earned the reputation as the industry’s Gold Standard for Transformational Technologies Market Reports.
Tailored Research Services
Provide you with clear, actionable recommendations designed to empower decision making and to help you exploit emerging opportunities in the Transformational Technologies industries.
Information Security
Your personal information is safe and secure.

From: $2,450

SKU: 4454 Category:

Description

See also the latest version of this report

CBRN & HAZMAT Incidents Decontamination Technologies and Global Market Outlook

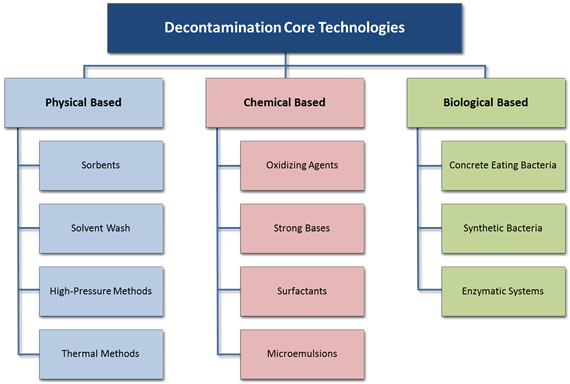
Decontamination Core Technologies

The threat of CBRN terrorism and HAZMAT incidences was demonstrated by the Fukushima 3/11 reactors meltdown, which left nearly 8% of the Japanese mainland contaminated and is expected to cost more than $40 billion to decontaminate.

Global public outcry drove governments to impose strict safety regulations and accident recovery funding, which will raise the market for decontamination equipment and materials.

HSRC forecasts that the global market for CBRN terror & Hazmat decontamination systems and equipment maintenance will reach $5.4 billion by 2016.

Our new market report is the most comprehensive review of the multibillion global decontamination market available today.

The report reveals more than twenty business opportunities, created, on the one hand, by the increasing recognition of the threat presented by HAZMAT accidents and CBRN terrorism, and on the other hand, by a growing environmental consciousness that is impacting public and political attitudes. Meeting both of these challenges has sparked a host of new, pipeline technologies and opportunities that have the decontamination markets poised for considerable growth. Following the accident at the Fukushima nuclear power plants and the BP oil spill in the Gulf of Mexico (total liability could amount to as much as US $100 Billion), new governmental legislation and federal funding of post CBRN attack and accidents are only three of the many factors driving the decontamination equipment and reagents market growth.

The report, segmented into 30 submarkets, offers for each submarket 2010 and 2011 data, funding and market size, as well as 2012-2016 forecasts and analysis. In 245 pages and 114 tables and figures, the report analyses and projects the 2012-2016 market and technologies from several perspectives, including:


  • Market and technology forecast by modality: e.g., people decontamination, facility decontamination, indoor , outdoor decontamination and other decontamination equipment
  • Regional markets: e.g., USA, UK, Germany, France, Italy, Spain, China, Taiwan, Japan, India, Middle East
  • Equipment sales and post warranty service & upgrade business
  • Guidelines for decontamination equipment procurement
  • Product comparison tables –  hundreds of decontamination products including  pricing and performance information
  • Competitive environment: 90 vendors and their products
  • Business environment: e.g., competitive analysis, SWOT analysis
  • Current and pipeline decontamination technologies
  • Business opportunities and challenges

Table of Contents

Download TOC as PDF
1 Executive Summary
1.1 Main Findings
1.2 Main Conclusions
1.3 Global Market: 2012-2016
1.4 Technological Challenges
2 Introduction
2.1 Definition of Decontamination
2.2 Who is This Report For?
2.3 Report Scope
2.4 Report Structure
2.5 Methodology
2.5.1 Research Methods
2.5.2 Basic Assumptions
2.6 CBRN Terror
2.7 Decontamination Strategy
2.8 The Decontamination Industry
3 Global Decontamination Market Drivers
4 Global Decontamination Market Inhibitors
5 Decontamination Industry Competitive Analysis
6 Decontamination Industry SWOT Analysis
6.1 Scope
6.2 SWOT Analysis
7 Decontamination Technology and Policy Regimes
8 Decontamination Development and Procurement Process
8.1 Decontamination Technology Development , Testing & Evaluation Process
8.2 Spiral Development, Procurement and Deployment of  Decontamination Systems
9 Present and Future (pipeline) Decontamination Technologies
9.1 Overview
9.2 The Decontamination Process
9.3 Contaminant Detection and Identification
9.3.1 Sample Characterization
9.3.2 Isolating the Contaminated Area
9.3.3 Designing the Decontamination Strategy
9.3.4 Clearance Sampling
9.4 People & Building Decontamination
9.4.1 People Decontamination
9.4.2 Building Decontamination
9.4.3 Drinking Water Decontamination
9.5 Decontamination Technologies
9.5.1 Core Technologies Overview
9.6 Physics Based Decontamination Technologies
9.6.1 Sorbents
9.6.2 Solvent-Wash
9.6.3 High-Pressure Methods
9.6.4 Thermal Methods
9.7 Chemistry Based Decontamination Technologies
9.7.1 Oxidizing Agents
9.7.2 Strong Bases
9.7.3 Surfactants
9.7.4 Micro-emulsions
9.8 Biology Based Technologies
9.8.1 Bacterial Decontamination Agents
9.8.2 Concrete-Eating Bacteria
9.8.3 Artificial Bacteria
9.8.4 Enzymatic Systems
9.9 Decontamination Systems Configurations
9.9.1 Scope
9.9.2 Peersonnel Decontamination Systems
9.9.3 Equipment Decontamination Systems
9.9.4 Sensitive Equipment Decontamination
9.9.5 Building and Infrastructure Decontamination Systems
9.1 New Technologies – Drivers
9.11 New Technologies – Inhibitors
10 Stockpiling Decontamination Agents & Equipment
11 Global CBRN Terror & Hazmat Incidents Decontamination Market: 2012-2016
11.1 Market Overview
11.2 Global CBRN Terror & Hazmat Incidents Decontamination Equipment, Service and Upgrade Market – 2012-2016
11.3 Global CBRN Terror & Hazmat Incidents Decontamination Equipment Sales – 2012-2016
11.3.1 Overview
11.3.2 Contamination Detection Systems CBRN Equipment Sales Forecast
11.3.3 Equipment & Buildings Decontamination Systems CBRN Equipment Sales Forecast
11.3.4 People Decontamination Systems CBRN Equipment Sales Forecast
11.4 Global Decontamination Service & Upgrade Market: 2012-2016
11.4.1 Market by Modality
11.4.2 Market by Geography
11.4.3 U.S. Service & Upgrade Market: 2012-2016
11.4.4 Germany, UK, France and Italy Service & Upgrade Market: 2012-2016
11.4.5 China, India, Taiwan, Japan and the Middle East Service & Upgrade Market -2012-2016
11.4.6 Latin American Service & Upgrade Market: 2012-2016
11.4.7 ROW Service & Upgrade Market: 2012-2016
12 The US Market: 2012-2016
12.1 The Obama Administration Strategy
12.1.1 Example: Chicago’s Decontamination facility
12.2 Drivers
12.3 Inhibitors
12.4 Market Forecast
13 Germany, the UK, France and Italy Markets: 2012-2016
13.1 Market Drivers
13.2 Market Inhibitors
13.3 Market Forecast
14 China, India, Taiwan, Middle East and Japan Market: 2012-2016
14.1 Market background
14.2 Case Report 1: the Bhopal Disaster
14.3 Case Report 2: the Fukushima Decontamination Project
14.4 Market Drivers
14.5 Market Inhibitors
14.6 Japan: After Fukushima
14.6.1 25 Japanese Fukushima Radioactive  Fallout  Decontamination Contractors
14.7 Market Forecast
15 Latin American Market: 2012-2016
15.1 Market Drivers
15.2 Market Inhibitors
15.3 Market Forecast
16 Rest of the World Market: 2012-2016
16.1 Case Study: The Chernobyl disaster
16.2 Market Drivers
16.3 Market Inhibitors
16.4 Market Forecast
17 Business Opportunities and Challenges: 2012-2016
17.1 A Market Waiting for Transition
17.1.1 HLS Decontamination Strategy Outlook
17.1.2 Factors Affecting Decontamination Systems Business Opportunities
17.2 Recent Technology Developments
17.3 Technology Performance Challenges
17.3.1 Challenge One: Time
17.3.2 Challenge Two: Decontamination Level
17.3.3 Challenge Three: Accurate Contamination Simulations
17.3.4 Challenge Four: Cost of Decontamination
17.3.5 Challenge Five: Environmentally Unfriendly Materials
17.3.6 Challenge Six: Transport and Storage
17.3.7 Challenge Seven: Radioactive Decontamination
17.4 Business Opportunities for Decontamination Systems
17.4.1 New Technologies to Counter Radiological Contamination
17.4.2 Non-Toxic/Environmentally Friendly Biological-Agents Decontamination Technology
17.4.3 Improving Contamination Simulation Capability
17.4.4 Improving Biological Sampling Accuracy
17.4.5 Meeting New Decontamination Standards
17.4.6 Reducing Decontamination Time
17.4.7 Reducing Cost of Reagents / Decontamination Material
17.5 Radiological Decontamination Bussiness oportunities
17.5.1 Concrete-Eating Bacteria
17.5.2 Decontamination Foams
17.5.3 Nano-Particle Super-Absorbent Gels
17.5.4 Strippable Coatings
17.5.5 Electro-Kinetic Concrete Cleaning
17.6 Chemical-Biological Decontamination Business Opportunities
17.6.1 Forced Hot Air Systems
17.6.2 Modified Vaporous Hydrogen Peroxide
17.6.3 Decon Green
17.6.4 Resistant/Reactive Coatings
17.6.5 Enzyme Decontamination
17.6.6 Ionic-Liquid-based Decontamination
17.6.7 Supercritical Carbon Dioxide Decontamination
17.6.8 Electrostatic Decontamination Systems
17.6.9 Atmospheric Plasma Decontamination
17.6.10 Contamination Simulation Algorithms
17.6.11 Algorithms Assessing the Vulnerability of Buildings to  CBRN attack or a HAZMAT event
18 Decontamination Vendors and Products
18.1 Decontamination Systems Vendors and Products
18.1.1 Allen-Vanguard Corporation
18.1.2 Andax
18.1.3 Base-X Inc.
18.1.4 Bio Defense Corporation
18.1.5 BIOQUELL, Inc.
18.1.6 ClorDi Sys Solutions, Inc
18.1.7 Container Products Corp.
18.1.8 CRDS TVI Corporation
18.1.9 Crest Ultrasonics Corp.
18.1.10 Cryogenesis
18.1.11 DQE, Inc.
18.1.12 DuPont Personal Protection
18.1.13 Environmental Fire Solutions, Inc.
18.1.14 Equipment Management Company
18.1.15 Fend- All
18.1.16 First Line Technology, LLC
18.1.17 Flangler Emergency Services, LLC
18.1.18 Foster-Miller, Inc.
18.1.19 FSI North America
18.1.20 GenV- Clean Earth Technologies, LLC
18.1.21 Global Ground Support
18.1.22 Hughes Safety Showers Ltd.
18.1.23 Intelgard, Inc.
18.1.24 Karcher Futuretech GmbH
18.1.25 Life Safety Systems, Inc.
18.1.26 Matthews Specialty Vehicles, Inc
18.1.27 Mobile Air Applied Science, Inc.
18.1.28 Modec, Inc
18.1.29 Nor E First Response, Inc.
18.1.30 OWR AG
18.1.31 Precision Lift, Inc.
18.1.32 Reeves EMS, LLC
18.1.33 RFD Beaufort
18.1.34 RMC Medical
18.1.35 Survival, Inc.
18.1.36 SWEDE
18.1.37 TSGI USA
18.1.38 TVI Corporation
18.1.39 Ultimate Survival Technologies
18.1.40 US Foam Technologies, Inc
18.1.41 Wel-Fab Inc.
18.1.42 Western Shelter Systems
18.1.43 Zimek Technologies, LLC
18.1.44 Zumro, Inc.
18.2 Other Decontamination Hardware Vendors and Products
18.2.1 Aero Tec Laboratories Inc.
18.2.2 Air Systems International
18.2.3 Akron Brass Co.
18.2.4 Allen-Vanguard, Inc
18.2.5 Applied Surface Technologies
18.2.6 BCDS, Inc.
18.2.7 ClorDi Sys Solutions, Inc.
18.2.8 Crestline Industries
18.2.9 Cryogenesis
18.2.10 Cryokinetics
18.2.11 DQE, Inc.
18.2.12 EFT
18.2.13 Equipment Management Company
18.2.14 E-Z-EM, Inc.
18.2.15 Fend-All
18.2.16 First Line Technology, LLC
18.2.17 FSI North America
18.2.18 Genecor International, Inc.
18.2.19 Guild Associates, Inc.
18.2.20 Haws Corporation
18.2.21 Hydro-Therm
18.2.22 IET, Inc.
18.2.23 Intelgard
18.2.24 Kappler, Inc
18.2.25 Karcher Futuretech
18.2.26 Maeda Corporation
18.2.27 Minuteman International, Inc.
18.2.28 Miti Manufacturing Co. Inc.
18.2.29 Mobile Air Applied Science, Inc.
18.2.30 Modec Inc.
18.2.31 Morgan Inc.
18.2.32 Nano Scale
18.2.33 Nor E First Response, Inc.
18.2.34 NPS Corporation
18.2.35 OWR AG
18.2.36 Radiation Decontamination Solutions, LLC
18.2.37 RAPID Deployment Products Inc.
18.2.38 Red Head Brass, LLC
18.2.39 Reeves EMS
18.2.40 Reliapon
18.2.41 RMC Medical
18.2.42 Sabre Technical Services
18.2.43 Slate Enterprises, Inc.
18.2.44 SteriFx, Inc
18.2.45 Steris Corporation
18.2.46 Swede
18.2.47 TECWAR® Tactical Water Purification Systems
18.2.48 Tempest Technology, Inc.
18.2.49 TVI Corporation
19 Guidelines for Decontamination Equipment Procurement
19.1 Decontamination Equipment Selection Factors
19.2 Commercial Decontaminants Prices & Performance
19.3 Liquid Decontamination Delivery Systems: Prices & Performance
19.4 Gaseous Decontamination Delivery Systems: Prices & Performance
19.5 Decontamination Shower Systems: Prices & Performance
19.6 Decontamination Shower Hardware: Prices & Performance
19.7 Decontamination Kits: Prices & Performance
19.8 Decontamination Containment Hardware: Prices & Performance
19.9 Decontamination Support Equipment: Prices & Performance
20 Appendix A: CBRN Terror
20.1 Biological Terror
20.1.1 Bio-Weapons Historical Perspective
20.1.2 Biological Terror Bacterial Agents
20.1.3 Biological Terror Rickettsiae Agents
20.2 Nuclear-Radiological Terror
20.2.1 How Real is the Nuclear Threat?
20.2.2 Nuclear Terror
20.2.3 Radiological Dispersal Devices (RDD)
20.3 Chemical Terror
20.3.1 Nerve Agents
20.3.2 Blister Agents
21 Appendix B: Decontamination Legal Issues
21.1 International Legislation/Agreements
21.1.1 The Nuclear Weapons Non-Proliferation Treaty (NPT) 1970
21.1.2 The Biological and Toxin Weapons Convention (BTWC) 1972
21.1.3 Convention for the Physical Protection of Nuclear Material 1987
21.1.4 Chemicals Weapons Convention 1992
21.2 U.S. Legislation
21.2.1 U.S. Code Title 50, Chapter 40 Defense against Weapons of Mass Destruction
21.2.2 Federal Insecticide, Fungicide, and Rodenticide Act (FIFRA) 1996
21.2.3 Emergency Supplemental Appropriations Act for Recovery from and Response to Terrorist Attacks on the United States 2001
21.2.4 Public Health Security and Bioterrorism Preparedness and Response Act 2002
21.2.5 Pandemic and All-Hazards Preparedness Act (PAHPA), 2006
21.2.6 Homeland Security Presidential Directive 21

Tables

Table 1 Global CBRN Terror & Hazmat Decontamination Equipment & Service Market [$ Million] – 2010-2016
Table 2 Global CBRN Terror & Hazmat Decontamination Equipment & Service Market [$ Million] by Modality – 2010-2016
Table 3 Global Decontamination Equipment, Service and Upgrade Markets  [$ Million] by Modality – 2010-2016
Table 4 Total Global Decontamination Equipment, Service and Upgrade Market [%]  by Modalities – 2010-2016
Table 5 Total Global CBRN Terror & Hazmat Decontamination Equipment, Service  and Upgrade Market [$ Million] by Countries/Regions – 2010-2016
Table 6 Global Decontamination Equipment Sales [$ Million] by Modality – 2010-2016
Table 7 Global  Decontamination Equipment Sales Shares [%] by Modality – 2010-2016
Table 8 Global Decontamination Equipment Sales [$ Million] by Countries/Regions – 2010-2016
Table 9 Contamination Detection Systems Equipment Sales [$ Million] by Countries/Regions – 2010-2016
Table 10 Equipment & Buildings Decontamination Systems Equipment Sales [$ Million] by Countries/Regions – 2010-2016
Table 11 People Decontamination Systems Equipment Sales [$ Million] by Countries/Regions – 2010-2016
Table 12 Service & Upgrade Market for CBRN Terror & Hazmat Incidents Decontamination Equipment [$ Million] by Modality – 2010-2016
Table 13 Service & Upgrade Market [$ Million] by Country – 2010-2016
Table 14 U.S. Service & Upgrade Market [$ Million] by Modality – 2010-2016
Table 15 Germany, the U.K., France and Italian Service & Upgrade Market  [$ Million] by Modality – 2010-2016
Table 16 China, India, Taiwan, Japan and the Middle East Service & Upgrade Market [$ Million] by Modality – 2010-2016
Table 17 Latin American Service & Upgrade Market [$ Million] by Modality –  2010-2016
Table 18 ROW Service & Upgrade Market [$ Million] by Modality – 2010-2016
Table 19 Total US Decontamination Equipment & Service Market [$ Million] by Modality – 2010-2016
Table 20 US Decontamination Equipment Market [$ Million] by Modality –  2010-2016
Table 21 US Decontamination Equipment Market Shares [%] by Modality –  2010-2016
Table 22 German, UK, French and Italian Equipment Market  [$ Million] by Modality – 2010-2016
Table 23 25 Japanese Fukushima Radioactive Fallout Decontamination Contractors and Consultors
Table 24 China, India, Taiwan, Middle East and Japan Decontamination Equipment Market [$ Million] by Modality – 2010-2016
Table 25 Latin America Decontamination Equipment Market [$ Million] by Modality – 2010-2016
Table 26 ROW CBRN Terror & Hazmat Decontamination Equipment Market  [$ Million] by Modality – 2010-2016
Table 27 Decontamination Equipment Selection Factors and Criteria
Table 28 Commercial Decontaminants Analysis
Table 29 Decontamination Delivery Systems (liquids) Analysis
Table 30 Decontamination Delivery Systems (Gaseous) Analysis.
Table 31 Decontamination Shower Systems Analysis
Table 32 Decontamination Shower Hardware Analysis
Table 33 Decontamination Kits Analysis
Table 34 Decontamination Containment Items Analysis
Table 35 Decontamination Support Equipment Analysis
Table 36 Physical and Chemical Properties of Common Nerve Agents
Table 37  Physical and Chemical Properties of Common Blister Agents

Figures

Figure 1 The March 2011 Fukushima Nuclear Event.
Figure 2 The post Fukushima Meltdown Radioactive Cesium Blankets 8% of Japan.
Figure 3 The Bio Attack Response Timeline
Figure 4 Global CBRN Terror & Hazmat Decontamination Equipment & Service Market [$ Million] – 2010-2016
Figure 5 Global CBRN Terror & Hazmat Decontamination Equipment & Service Market [$ Million] – 2010 & 2016
Figure 6 CBRN & HAZMAT Event Decontamination Command Structure
Figure 7 CBRN Terror Identification Roadmap
Figure 8 Decontamination Strategy: From Sample Collection to Decontamination Clearence
Figure 9 Basic Phases of Response and Recovery to a CBRN & HAZMAT Incident
Figure 10 Competitive Analysis
Figure 11 Decontamination Industry SWOT Analysis
Figure 12 The Decontamination: Technology, ICT, Command & Control and Decision Chain
Figure 13 Decontamination Method Down-selection Process
Figure 14 The Decision Criteria of the Introduction of a New Decontamination Technology
Figure 15 Procurement Agency Industry: the Pre-procurement Process
Figure 16 The Decontamination Systems Spiral Development and Evolution
Figure 17 Comparison in Weight of Pathogens between BW Agents and CW Agents [mg]
Figure 18 Closed Area (e.g., building) Decontamination Boundaries
Figure 19 Open Area Decontamination Boundaries
Figure 20 Decontamination Corridor
Figure 21 The Decontamination Cycle
Figure 22 Decontamination Process Flow Chart
Figure 23 Basic Facility Decontamination Process Flowchart
Figure 24 CBRN Scene Decontamination Diagram
Figure 25 People Decontamination Triage Decision Tree
Figure 26 The FBI CBRN Terror& Hazmat Response Teams Deployment Map
Figure 27 Decontamination Core Technologies Overview
Figure 28 Skin Decontaminate Lotion, Anachemia Canada, Inc.
Figure 29 Decontamination Kit, Personal No. 2, Mark 1, Richmond Packaging (U.K.) Ltd.
Figure 30 Portaflex Decontamination Shower System, High Safety Showers USA
Figure 31 K4-05 High Purity, Applied Surface Technologies, USE
Figure 32 Decocontain 3000, Karcher, Germany
Figure 33 Total Global Decontamination Equipment, Service and Upgrade Market by Modalities [$ Millions] – 2010-2016 
Figure 34 Total Global Decontamination Equipment, Service and Upgrade Markets by Modalities [%] – 2010 & 2016
Figure 35 Total Global Decontamination Equipment,Service and Upgrade Market [$ Million] by Region – 2010-2016
Figure 36 Total Global CBRN & Hazmat Incidents Decontamination Equipment,Service and Upgrade Market [%] by Region – 2010, 2013, 2016
Figure 37 Global Decontamination Equipment Sales [$ Million] by Modality – 2010-2016
Figure 38 Global Decontamination Equipment Sales by Modality Share [%] – 2010, 2013, 2016
Figure 39 Global Decontamination Equipment Sales [$ Million] by Countries/Regions – 2010-2016
Figure 40 Contamination Detection Systems Equipment Sales [$ Million] by Region – 2010-2016
Figure 41 Equipment & Buildings Decontamination Systems Equioment Sales [$ Million] by Region – 2010-2016
Figure 42 People Decontamination Systems Equipment Sales [$ Million] by Countries/Regions – 2010-2016
Figure 43 Service & Upgrade Market for CBRN Terror & Hazmat Incidents Decontamination Equipment [$ Million] by Modality – 2010-2016
Figure 44 Service & Upgrade Market [$ Million] by Modality, – 2009, 2013 &2016
Figure 45 Service & Upgrade Market [$ Million] by Region – 2010-2016
Figure 46 U.S. Service & Upgrade Market [$ Million] by Modality – 2010-2016
Figure 47 Germany, the UK, France and Italian Service & Upgrade Market [$ Million] by Modality – 2010-2016
Figure 48 China, India, Taiwan, Japan and the Middle East Service & Upgrade Market [$ Million] by Modality – 2010-2016
Figure 49 Latin American Service & Upgrade Market [$ Million] by Modality – 2010-2016
Figure 50 ROW Service & Upgrade Market [$ Million] by Modality – 2010-2016
Figure 51 Chicago’s Decontamination facility
Figure 52 Total US CBRN Terror & Hazmat Incidents Decontamination Equipment & Service Markets by Modalities [%] – 2010 & 2016
Figure 53 US Decontamination Equipment Market [$ Million] by Modality – 2010-2016
Figure 54 US Decontamination Equipment Market by Modality Market Share [%] – 2010, 2016
Figure 55 The UK Government Decontamination Service Organization
Figure 56 German, UK, French and Italian Decontamination Equipment Market [$ Million] by Modality – 2010-2016
Figure 57 The post Fukushima Decontamination Work Concept
Figure 58 The Fukushima Prefecture map.
Figure 59 China, India, Taiwan, Middle East and Japan Decontamination Equipment Market [$ Million] by Modality – 2010-2016
Figure 60 Latin American Equipment Market [$ Million] by Modality – 2010-2016
Figure 61 ROW CBRN Terror & Hazmat Incidents Decontamination Equipment Market [$ Million] by Modality – 2010-2016
Figure 62 ISOTRON System Scheme
Figure 63 Categories of the Bio-threat Divides
Figure 64 The Spraying of Anthrax from Aum Shinrikyo’s Headquarters June 1993
Figure 65 Anthrax Spores and Disease
Figure 66 Cholera Bacteria
Figure 67 Pneumonic Plague the Disease
Figure 68 Tularemia the Disease
Figure 69 Smallpox Virus and Disease
Figure 70 Ebola Virus Electron Microscopy Image
Figure 71 VEE Venezuelan Equine Encephalitis Virus in the Olfactory Mucosa of a Mouse
Figure 72 Q Fever
Figure 73 Typhus Microbe Electron Microscopy Image
Figure 74 Castor Plant and Structure for the Ricin Toxin
Figure 75 The Dinoflagellate Alexandrium Tamarense and Structure of Saxitoxin
Figure 76 A Simulation of the Impact of the Explosion of a 50 Grams of Cs-137 RDD (Dirty Bomb) in Washington DC
Figure 77  Categories of the Chemical Divides

Questions about this report?

Contact Sales: 1-571-527-1010 or Analysts: 1-202-455-0966

  • Have a question about CBRN & HAZMAT Incidents Decontamination: Technologies and Global Market - 2012 Edition
    Please fill out all fields in the form below and click "Submit" to send your question.
    Our representative will review your question and contact you with an answer as soon as possible.
  • 2+2=
  • This field is for validation purposes and should be left unchanged.
1
Interested in this report? Need more information?
X
Powered By