Top
HSRCCounter Misinformation -DeepFake & Fake News Solutions Market – 2020-2026
Counter DeepFake and Fake News Market 2020-2025 Report

Counter Misinformation -DeepFake & Fake News Solutions Market - 2020-2026

2020-2026 CAGR of 42%

  • Jan 2021
  • 136
  • 99
    • 4950 $
    • 5950 $
    • 8950 $
    • 12000 $

    Small Businesses, Startups & Academia - Up to 50% Off

Quantity
IBM
Amazon
Sandia National Lab
HITACHI
Thales
Smiths Detection
Nuctech
Korea Internet & Security Agency
L3Harris
Huawei
Leidos
NEC
Toshiba
Deloitte
MAG

Want to customize this report?

If you purchase this report, you are entitled to a 30% discount towards customizing it, to better fit your market research and strategic needs. Our Custom Research and Industry Insights Department will work with you to better understand your information gaps and strategic needs and will provide you with a tailor-made market research report within a short period of time.

Why Choose Us?

30+ Years of Experience
We are a multidisciplinary team of Transformational Technologies industry experts with over 30 years of experience.
Gold Standard
With over 950 private sector clients (73% repeat customers), including major defense and security vendors, and Forbes Global 2000 companies, HSRC earned the reputation as the industry’s Gold Standard for Transformational Technologies Market Reports.
Tailored Research Services
Provide you with clear, actionable recommendations designed to empower decision making and to help you exploit emerging opportunities in the Transformational Technologies industries.
Information Security
Your personal information is safe and secure.

From: $4,950

Description

For the past century Fake News has become a significant problem, as exploiting news outlets and social media platforms to disseminate misinformation to influence individuals’ actions has become widespread. The negative impact of Fake News, especially within the political, economic, and social environments is increasing, emphasizing the need to detect and identify these Fake News stories in near real-time. Furthermore, the latest trend of using Artificial Intelligence (AI) to create fake videos, known as “DeepFakes” or “FakeNews 2.0”, is a fast-growing phenomenon creating major concerns. AI technology enables, basically anyone, to create a fake video that shows a person or persons performing an action at an event that never occurred. Although DeepFakes are not as prevalent and widespread as Fake News articles, they are increasing in popularity and have a much greater effect on the general population. In addition, the sophistication behind the creation of DeepFake videos increases the difficulty of identifying and detecting them, making them a much more effective and destructive tool for perpetrators.


As the usage and threat of DeepFakes and Fake News intensifies, so do efforts to develop new detection methods, resulting in the next wave of (mis)information warfare. The proliferation of technology, specifically Artificial Intelligence, allow wide scale and easy to use solutions to create synthetic media that seems very real, either in video, photos, or text. In combination with networks of fake profiles, bot networks and smart utilization of social media, the attackers have many ways to influence either the public or specific individuals. As media and technology are now being used for cyber terrorism, criminal activity, espionage and military warfare, the new age of information warfare threatens democracies worldwide, pushing governments to combat this threat with large investments.


Intelligence, Law Enforcement, and other Governmental agencies are taking active roles in tackling the threat that (mis)information warfare poses and are spending growing budgets on technology that can detect and counter Fake News and DeepFake media.


The Counter Deepfake and Counter Fake News Software Solutions Market report is the first report to cover this up and coming market, focused on detection and mitigation solutions for Fake News and DeepFakes:

1. Fake News – the deliberate creation of false reality to influence public perception.

2. DeepFake – manipulated videos or audio produced by AI, that yield fabricated images and sounds that appear to be real.


In many cases the two are used simultaneously, however each one requires different tools and methods to detect and mitigate. Currently, most of the market spending goes towards the detection and monitoring part of the Information Warfare, while a smaller portion is invested towards digital forensics, trying to trace the source, after the damage has been done.


There are two major categories of DeepFake detection tools:

1. Pattern Analysis – looking and analyzing the behavior of people in the videos, learning the patterns, from hand gestures to pauses in speech, and comparing it to real life patterns. This approach has the advantage of possibly working even if the video quality itself is essentially perfect.

2. Quality of Video Analysis – analyzing the differences between deepfakes and real videos. Most deepfake videos are created by merging individually generated frames into videos. By analyzing the essential data from the faces in individual frames of a video and then tracking them through sets of concurrent frames one is able to detect inconsistencies in the flow of the information from one frame to another. This can also be used for face audio detection.


At the end of the day, it may be that both types of DeepFake detection methods will be needed in order to mitigate this potential threat.


Fake News are disseminated via networks of fake profiles, bot networks and smart utilization of social media, therefore, most tools developed and used to detect fake news are geared towards finding, analyzing and stopping these networks and bots. These tools are a mix of OSINT and Cyber technologies.


Counter Misinformation (DeepFake and Fake News) Solutions Market Organogram


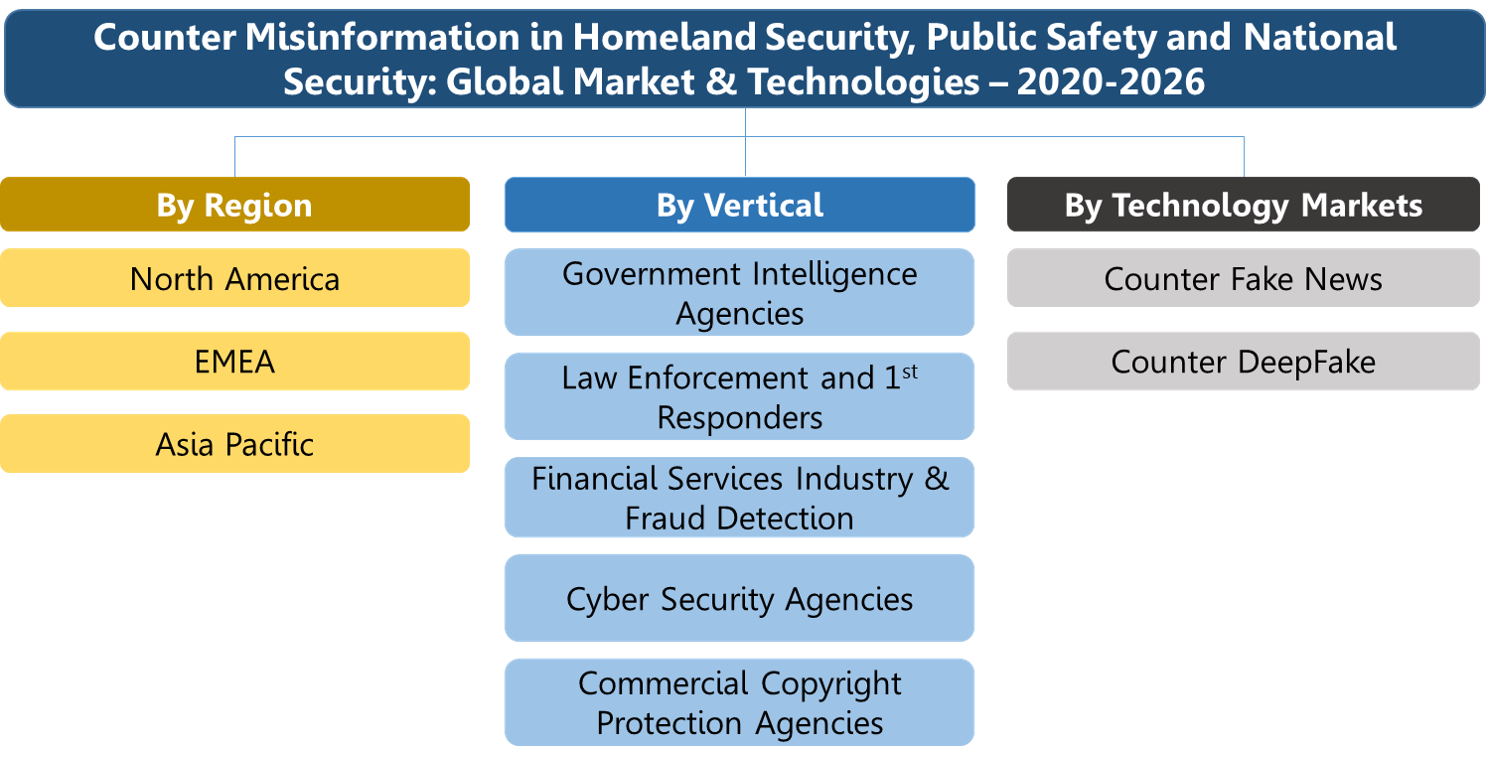
The counter DeepFake and counter Fake News software market forecast report presents for each submarket 2019 data and projects the 2020-2026 market. We address the “money trail” – each dollar spent – via the following 3 orthogonal market segments:


By Type of misinformation:

1. Fake News

2. DeepFake


By End User:

1. Police & Law Enforcement

2. Intelligence Organizations

3. Military

4. Other Government Organizations

5. Commercial Businesses

6. Consumers


By Regional Markets:

1. North America

2. Europe, Middle East & Africa (EMEA)

3. Asia Pacific


As most of the misinformation activity and content dissemination is done on social media platforms, the report covers the activity of tech giants to tackle this threat over their platforms and beyond. Facebook, Twitter, Microsoft, Youtube and other leading content platforms are investing time and money to better understand and detect deepfakes to make sure their platforms are not misused by criminals and state-owned operators. However, these efforts alone will not be enough and other institutions will have to take a more prominent role by allocating larger budgets to purchase or develop capabilities to mitigate the risk. In addition to detecting these fakes, journalists and the social media platforms also need to figure out how best to warn people about deepfakes when they are detected to minimize the damage done.


Such as in most tech heavily markets, end users are debating whether to work with an external vendor or to rely on internal developed capabilities as well as existing OSINT monitoring tools re-directed to a dedicated team. The report contains a detailed list and short profile of the companies that provide solutions for counter DeepFake and FakeNews monitoring and detection. Many of these companies are startups such as Cheq, Metafact, Cyabra, Falso Tech, Sensity, and others. In addition, large and mature corporations are also active in the market, some of them via M&A activities and other are developing solutions internally, such players include Axon, Microsoft, Facebook, Twitter and others.


These companies are leveraging several high-end technologies and methods to tackle this threat, such as:

1. AI analytics that can identify synthetic media

2. Digital authentication solutions

3. Content and social media monitoring tools (OSINT)

4. Fake profiles detectors

5. Fact checking tools

6. Related cybercrime activity


In addition to technological solutions, regulatory frameworks are also being put forth by Judicial systems across the globe as a method to deal with this threat. However, there are many issues regarding personal rights and the freedom of speech that make it hard to fight this kind of campaigns by only using the law.


Questions answered in this market report include:

1. What will be the counter deepfake and counter fake news software market size in 2019-2025? What will the relevant trends be during that time?

2. What will be the deepfake detection software market size in 2019-2025?

3. What will be the fake news detection software market size in 2019-2025?

4. Which submarkets in this field provide attractive business opportunities?

5. Which regions are expected to invest most in these capabilities?

6. Which end users are expected to invest most in these capabilities?

7. What are the market drivers and inhibitors?

8. Who are the prominent vendors in the market?

9. What type of regulations are countries implementing to fight the threats posed by deepfake and fake news activities?


Ideally, a deepfake verification tool should be available to everyone. However, this technology is in the early stages of development. Furthermore, developers need to improve the tools and protect them against hackers before releasing them broadly. Therefore, HSRC estimates this market will grow rapidly during the forecast period.

Table of Contents

Download TOC as PDF

1         Executive Summary. 14

1.1        Major Findings & Conclusions. 14

1.2        Market Dynamics & Opportunities. 15

1.3        Market Size – Assessment and Forecast – 2020-2026. 16

1.4        Market Dynamics 2020-2026. 17

1.5        Market Breakdown 2020-2026. 18

2         Misinformation in Homeland Security, Public Safety and National Security Market Background & Assessment 20

2.1        Misinformation Definition & Background. 20

2.2        Fake News Definition & Background. 21

2.3        DeepFake Definition & Background. 21

2.4        Fake News & DeepFake Economic Damages. 23

3         Counter Misinformation in Homeland Security, Public Safety and National Security Market Background & Assessment 25

3.1        Counter Misinformation Background. 25

3.2        Counter Misinformation Market: Drivers & Inhibitors. 26

3.2.1    Counter Misinformation Market Drivers. 26

3.2.2    Counter Misinformation Market Inhibitors. 27

3.3        Counter Misinformation in Homeland Security, Public Safety, and National Security Market Organogram.. 28

3.4        Counter Misinformation in Homeland Security, Public Safety, and National Security Market Estimations and Forecast 29

4         Counter Misinformation Country Regulatory Frameworks. 32

5         Select Counter Misinformation Projects and Programs in Homeland Security, Public Safety & National Security. 40

6         Global Security Concerns & Assessment 41

6.1        Global Risks 2020: A Regional Perceptive. 42

6.2        North America Homeland Security & Public Safety Market Drivers. 46

6.3        Cyber Attacks. 47

6.4        Data Fraud or Theft 47

6.5        Terrorism Threat 47

6.6        Europe Homeland Security & Public Safety Market Drivers. 47

6.7        Cyberattacks. 49

6.8        Assets bubble. 49

6.9        Interstate conflict 49

6.10     Terror financing. 49

6.11     APAC Homeland Security & Public Safety Market Drivers. 50

6.12     Water Crises. 51

6.13     Terrorist attacks. 51

6.14     Manmade environmental catastrophes. 51

6.15     Natural catastrophes. 52

6.16     Cyberattacks. 52

6.17     Interstate conflict 52

6.18     Middle East and Africa Homeland Security & Public Safety Market Drivers. 53

6.19     Unemployment or underemployment 54

6.20     Fiscal crises. 54

6.21     Energy price shock. 54

6.22     Latin America and the Caribbean Homeland Security & Public Safety Market Drivers. 55

6.23     Failure of national governance. 55

6.24     Economic issues. 56

6.25     Failure of critical infrastructure. 56

6.26     COVID-19 Pandemic Background & Assessment 57

6.27     North America COVID-19 Assessment 57

6.28     Europe COVID-19 Assessment 57

6.29     LATAM COVID-19 Assessment 57

6.30     APAC COVID-19 Assessment 58

6.31     Middle East & Africa COVID-19 Assessment 58

7         Homeland Security, Public Safety, and National Security Agencies Background. 59

8         Proliferation of Data. 60

9         Type of Data Sources. 60

9.1        Passive Data Sources. 60

9.2        Active Data Sources. 61

9.3        Data Sources. 61

9.3.1             OSINT (Social Media and Web) 61

9.3.1.1         Social Media Sources. 61

9.3.1.2         Leading Social Media Platforms. 62

10      Threats Generated by Misinformation Campaigns. 63

10.1     Election Campaigns and Politics. 63

10.2     Financial Fraud. 65

10.3     Public Health. 65

10.4     Personality Theft 66

10.5     Cyber-enabled Crime. 67

10.6     Revenge Porn & Sextortion. 67

11      Technology. 68

11.1     Consolidated Market 2020-2026. 68

11.2     Market Analysis 2020-2026. 68

11.3     Market Dynamics 2020-2026. 69

11.4     Market Breakdown 2020-2026. 69

11.5     Counter Misinformation Technology Background. 71

11.6     Counter Misinformation Technology Enablers & Applications. 72

11.6.1 AI & Machine Learning. 72

11.6.1.1      Machine Learning Methods. 72

11.6.1.2      Deep Machine Learning. 73

11.6.2 Natural Language Processing (NLP) 73

11.6.2.1      Natural Language Processing Components. 74

11.6.2.2      Natural Language Processing Application Types. 74

11.6.2.3      Speech Recognition & Machine Hearing. 75

11.6.2.4      Machine Vision. 76

11.6.2.5      Applications Types. 77

11.7     Bot Networks. 78

11.7.1 What are Bot Networks. 78

11.7.2 Bot Networks Detection Tools. 80

11.7.2.1      Intent Analysis Tools. 80

11.7.2.2      Device Fingerprinting. 81

11.7.2.3      Human Interaction Challenge. 81

11.7.2.4      Behavioral Analysis. 81

11.8     Counter Misinformation Technology Types and Solutions. 81

11.8.1 Fake News Detection Solutions. 81

11.8.1.1      Classic OSINT Tools for Monitoring Purposes. 82

11.8.1.2      Fake Profiles Detectors. 83

11.8.1.3      Non Tech Solutions. 83

11.8.1.4      Market Size – Assessment and Forecast – 2020-2026. 83

11.8.1.5      Market Dynamics 2020-2026. 84

11.8.1.6      Market Breakdown 2020-2026. 85

11.8.2 DeepFake Detection Solutions. 85

11.8.2.1      Software-based Detection. 85

11.8.3 Market Size – Assessment and Forecast – 2020-2026. 87

11.8.4 Market Dynamics 2020-2026. 88

11.8.5 Market Breakdown 2020-2026. 89

12      Vertical Markets. 90

12.1     Consolidated Market 2020-2026. 91

12.2     Market Analysis 2020-2026. 92

12.3     Market Dynamics 2020-2026. 92

12.4     Market Breakdown 2020-2026. 93

12.5     Government Intelligence Agencies. 95

12.5.1 Use Cases. 95

12.5.2 Market Size – Assessment and Forecast – 2020-2026. 95

12.5.3 Market Dynamics 2020-2026. 96

12.5.4 Market Breakdown 2020-2026. 97

12.6     LEAs & First Responders. 98

12.6.1 Use Cases. 98

12.6.2 Market Size – Assessment and Forecast – 2020-2026. 98

12.6.3 Market Dynamics 2020-2026. 99

12.6.4 Market Breakdown 2020-2026. 100

12.7     Financial Intelligence & Fraud Detection. 100

12.7.1 Use Cases. 100

12.7.2 Market Size – Assessment and Forecast – 2020-2026. 101

12.7.3 Market Dynamics 2020-2026. 102

12.7.4 Market Breakdown 2020-2026. 103

12.8     Cyber Security Agencies. 103

12.8.1 Use Cases. 103

12.8.2 Market Size – Assessment and Forecast – 2020-2026. 104

12.8.3 Market Dynamics 2020-2026. 105

12.8.4 Market Breakdown 2020-2026. 105

12.9     Military & Defense Intelligence. 106

12.9.1 Use Cases. 106

12.9.2 Market Size – Assessment and Forecast – 2020-2026. 106

12.9.3 Market Dynamics 2020-2026. 108

12.9.4 Market Breakdown 2020-2026. 108

12.10  Commercial Copyrights Protection. 109

12.10.1            Use Cases. 109

12.10.2            Market Size – Assessment and Forecast – 2020-2026. 109

12.10.3            Market Dynamics 2020-2026. 110

12.10.4            Market Breakdown 2020-2026. 111

13      Regional Markets. 112

13.1     North America Market Background. 112

13.1.1 Market Size – Assessment and Forecast – 2020-2026. 112

13.1.2 Market Dynamics 2020-2026. 114

13.1.3 Market Breakdown 2020-2026. 114

13.2     Europe, Middle East & Africa (EMEA) Market Background. 115

13.2.1 Europe. 115

13.2.2 Middle East 115

13.2.3 Africa. 116

13.2.4 Market Size – Assessment and Forecast – 2020-2026. 116

13.2.5 Market Dynamics 2020-2026. 117

13.2.6 Market Breakdown 2020-2026. 118

13.3     APAC Market Background. 119

13.3.1 Market Size – Assessment and Forecast – 2020-2026. 119

13.3.2 Market Dynamics 2020-2026. 120

13.3.3 Market Breakdown 2020-2026. 121

14      Leading Vendors. 122

14.1     Social Media Platform Conglomarates Misinformation Detection Initiatives. 122

14.2     Cheq. 123

14.2.1 Company Profile. 123

14.2.2 Misinformation Detection Solutions. 123

14.3     Cyabra. 124

14.3.1 Company Profile. 124

14.3.2 Misinformation Detection Solutions. 124

14.4     Falso Tech. 124

14.4.1 Company Profile. 124

14.4.2 Misinformation Detection Solutions. 125

14.5     Sensity. 125

14.5.1 Company Profile. 125

14.5.2 Misinformation Detection Solutions. 125

14.6     Microsoft 126

14.6.1 Company profile. 126

14.6.2 Misinformation Detection Solutions. 126

14.7     Axon. 127

14.7.1 Company profile. 127

14.7.2 Misinformation Detection Solutions. 127

14.8     Logically. 127

14.8.1 Company profile. 127

14.8.2 Misinformation Detection Solutions. 128

14.9     Datalytics24. 128

14.9.1 Company profile. 128

14.9.2 Misinformation Detection Solutions. 128

14.10  Wordproof 129

14.10.1            Company profile. 129

14.10.2            Misinformation Detection Solutions. 129

14.11  Truepic. 129

14.11.1            Company profile. 129

14.11.2            Misinformation Detection Solutions. 130

14.12  Right of Reply. 130

14.12.1            Company profile. 130

14.12.2            Misinformation Detection Solutions. 130

14.13  Factmata. 131

14.13.1            Company profile. 131

14.13.2            Misinformation Detection Solutions. 131

14.14  Digital Fingerprints. 131

14.14.1            Company profile. 131

14.14.2            Misinformation Detection Solutions. 132

14.15  Trueinchain. 132

14.15.1            Company profile. 132

14.15.2            Misinformation Detection Solutions. 132

14.16  Fabula AI (a Twitter company) 133

14.16.1            Company profile. 133

14.16.2            Misinformation Detection Solutions. 133

14.17  Shieldsquare. 133

14.17.1            Company profile. 133

14.17.2            Misinformation Detection Solutions. 134

14.18  Imperva. 134

14.18.1            Company profile. 134

14.18.2            Misinformation Detection Solutions. 134

14.19  Fastly. 135

14.19.1            Company profile. 135

14.19.2            Misinformation Detection Solutions. 135

15      Disclaimer & Copyright 136


Tables

Table 1- Counter Misinformation solution in homeland Security and National security public safety Market Size ($M) and Annual Growth Rates (%) – 2020-2026. 16

Table 2 – Counter Misinformatoin Country Regulatory Frameworks. 32

Table 3 – Select Homeland Security and Public Safety Counter Misinformation Projects and Programs. 40

Table 2 – Passive Data Sources. 60

Table 5 – Active Data Sources. 61

Table 6 – Leading Social Media Platforms. 62

Table 7- Counter Misinformation Solution in Homeland Security and National Security Public Safety Market ($M) by Technology Market – 2020-2026. 68

Table 8- Counter Misinformation solution in homeland Security and National security public safety Market ($M) and Compound Annual Growth Rate (%) by Technology Market – 2020, 2026. 69

Table 9- Counter Misinformation solution in homeland Security and National security public safety Market Annual Growth Rate (%) by Technology Market – 2021-2026. 69

Table 10- Counter Misinformation solution in homeland Security and National security public safety Market Share (%) by Technology Market – 2020-2026. 69

Table 11- Counter Misinformation solution in homeland Security and National security public safety Market ($M) and Cumulative Market Share (%) by Technology Market – 2020-2026. 70

Table 12 – Machine Learning Method Types. 73

Table 13 – Natural Language Processing Components. 74

Table 14 – The Structure of Machine Hearing. 76

Table 15- Counter Fake News Technology Market Size ($M) and Annual Growth Rates (%) – 2020-2026. 83

Table 16- Counter DeepFake Technology Market Size ($M) and Annual Growth Rates (%) – 2020-2026. 87

Table 17- Counter Misinformation solution in homeland Security and National security public safety Market ($M) by Vertical Market – 2020-2026. 91

Table 18- Counter Misinformation solution in homeland Security and National security public safety Market ($M) and Compound Annual Growth Rate (%) by Vertical Market – 2020, 2026. 92

Table 17- Counter Misinformation solution in homeland Security and National security public safety Market Annual Growth Rate (%) by Vertical Market – 2021-2026. 92

Table 20- Counter Misinformation solution in homeland Security and National security public safety Market Share (%) by Vertical Market – 2020-2026. 93

Table 21- Counter Misinformation solution in homeland Security and National security public safety Market ($M) and Cumulative Market Share (%) by Vertical Market – 2020-2026. 94

Table 22- Government Intelligence Vertical Market Size ($M) and Annual Growth Rates (%) – 2020-2026. 95

Table 23- LEAs & First Responders Vertical Market Size ($M) and Annual Growth Rates (%) – 2020-2026. 99

Table 24- Financial Intelligence Services Vertical Market Size ($M) and Annual Growth Rates (%) – 2020-2026. 101

Table 25- Cyber Security Agencies Vertical Market Size ($M) and Annual Growth Rates (%) – 2020-2026. 104

Table 26- Military & Defense Industries Vertical Market Size ($M) and Annual Growth Rates (%) – 2020-2026. 107

Table 27- Commercial Copyrights Protection Vertical Market Size ($M) and Annual Growth Rates (%) – 2020-2026. 109

Table 28- NA Counter Misinformation solution in homeland Security and National security public safety Market Size ($M) and Annual Growth Rates (%) – 2020-2026. 113

Table 29-EMEA Counter Misinformation solution in homeland Security and National security public safety Market Size ($M) and Annual Growth Rates (%) – 2020-2026. 116

Table 30- APAC Counter Misinformation solution in homeland Security and National security public safety Market Size ($M) and Annual Growth Rates (%) – 2020-2026. 119

Figures

Figure 1- Counter Misinformation solution in homeland Security and National security public safety solution Market Size ($M) – 2020-2026. 17

Figure 2- Counter Misinformation solution in homeland Security and National security public safety Market AGR (%) – 2020-2026. 17

Figure 3- Counter Misinformation solution in homeland Security and National security public safety Market ($M) by Region – 2020-2026. 18

Figure 4- Counter Misinformation solution in homeland Security and National security public safety Market ($M) by Type -2020-2026. 18

Figure 5- Counter Misinformation solution in homeland Security and National security public safety Market ($M) by Vertical Market – 2020-2026. 19

Figure 6 – Most Targeted Countries by Misinformation Campaigns (%) 20

Figure 7 – Economic Damages from Fake News by Sector, Annually (M$) 2019. 23

Figure 8- Global Counter Misinformation in Homeland Security, Public Safety, National Security Markets Organogram.. 28

Figure 9- Counter Misinformation solution in homeland Security and National security public safety Public Market Size ($M) – 2020-2026. 29

Figure 10- Counter Misinformation solution in homeland Security and National security public safety market ($M) by Region 2020-2026. 30

Figure 11- Counter Misinformation solution in homeland Security and National security public safety market ($M) by type – 2020-2026. 30

Figure 12- Counter Misinformation solution in homeland Security and National security public safety Market ($M) by Verticals – 2020-2026. 31

Figure 13 – Global Risks Landscape 2020. 42

Figure 14- Top Global Risks by Impact and Likelihood. 43

Figure 15- The Global Risks Interconnections Map 2020. 43

Figure 16- The Global Risks-Trends Interconnections Map 2019. 44

Figure 17- Global Risks 2020: A Regional Perceptive – Most Likely Global Risk. 45

Figure 18- Top 5 Risks of Doing Business in North America. 46

Figure 19 – Top 5 Risks to Doing Business in Europe. 48

Figure 20- Top 5 Risks to Doing Business in South Asia. 51

Figure 21 – Top 5 Risks to Doing Business in East Asia Pacific. 52

Figure 22- Top 5 Risks to Doing Business in Middle East and North Africa. 53

Figure 23- Top 5 Risks to Doing Business in Sub-Saharan Africa. 54

Figure 24- Top 5 Risks to Doing Business in Latin America and the Caribbean. 55

Figure 25 – Major Drug Trafficking Routes and Major Gold Mining Areas in Latin America. 56

Figure 26 – Vertical Markets and Types of Threats they Encounter 59

Figure 27 – Total Facebook Users Engagement for top 20 Election Stories 2016 (fake news vs. large media outlets) 64

Figure 28- Counter Misinformation solution in homeland Security and National security public safety Market ($M) by Technology Market – 2020-2026. 68

Figure 29- Counter Misinformation solution in homeland Security and National security public safety Market Share (%) by Technology Market – 2020-2026. 70

Figure 30- Counter Misinformation solution in homeland Security and National security public safety Market ($M) and Cumulative Market Share (%) by Technology Market 2020-2026. 71

Figure 31 – Social Media Bots Uses (examples are fictitious) 79

Figure 32 – Tips How to Spot Fake News. 82

Figure 33- Counter Fake News Technology Market Size ($M) – 2020-2026. 84

Figure 34- Counter Fake News Technology Market AGR (%) – 2020-2026. 84

Figure 35- Counter Fake News Technology Market Share (%) – 2020-2026. 85

Figure 36- Counter DeepFake Technology Market Size ($M) – 2020-2026. 88

Figure 37- Counter DeepFake Technology Market AGR (%) – 2020-2026. 88

Figure 38- Counter DeepFake Technology Market Share (%) – 2020-2026. 89

Figure 39- Counter Misinformation solution in homeland Security and National security public safety Market ($M) by Vertical Market – 2020-2026. 91

Figure 40- Counter Misinformation solution in homeland Security and National security public safety Market Share (%) by Vertical Market – 2020-2026. 93

Figure 41- Counter Misinformation solution in homeland Security and National security public safety Market ($M) and Cumulative Market Share (%) by Vertical Market 2020-2026. 94

Figure 42- Government Intelligence Vertical Market Size ($M) – 2020-2026. 96

Figure 43- Government Intelligence Vertical Market AGR (%) – 2020-2026. 96

Figure 44- Government Intelligence Agencies Vertical Market Share (%) – 2020-2026. 97

Figure 45- LEAs & First Responders Vertical Market Size ($M) – 2020-2026. 99

Figure 46- LEAs & First Responders Vertical Market AGR (%) – 2020-2026. 99

Figure 47- LEAs & First Responders Vertical Market Share (%) – 2020-2026. 100

Figure 48- Financial Intelligence Services Vertical Market Size ($M) – 2020-2026. 102

Figure 49- Financial Intelligence Services Vertical Market AGR (%) – 2020-2026. 102

Figure 50- Financial Intelligence Vertical Market Share (%) – 2020-2026. 103

Figure 51- Cyber Security Agencies Vertical Market Size ($M) – 2020-2026. 104

Figure 52- Cyber Security Agencies Vertical Market AGR (%) – 2020-2026. 105

Figure 53- Cyber Security Agencies Vertical Market Share (%) – 2020-2026. 105

Figure 54- Military & Defense Industries Vertical Market Size ($M) – 2020-2026. 107

Figure 55- Military & Defense Industries Vertical Market AGR (%) – 2020-2026. 108

Figure 56- Military & Defense Industries Vertical Market Share (%) – 2020-2026. 108

Figure 57- Commercial Copyrights Protection Vertical Market Size ($M) – 2020-2026. 110

Figure 58- Commercial Copyrights Protection Vertical Market AGR (%) – 2020-2026. 110

Figure 59- Commercial Copyrights Protection Vertical Market Share (%) – 2020-2026. 111

Figure 60- NA Counter Misinformation solution in homeland Security and National security public safety Market Size ($M) – 2020-2026. 113

Figure 61- NA Counter Misinformation solution in homeland Security and National security public safety Market AGR (%) – 2020-2026. 114

Figure 62- NA Counter Misinformation solution in homeland Security and National security public safety Market Share (%) – 2020-2026. 114

Figure 63 – Overview of EU Joint & Coordinated Action Against Disinformation. 115

Figure 64- EMEA Counter Misinformation solution in homeland Security and National security public safety Market Size ($M) – 2020-2026. 117

Figure 65- EMEA Counter Misinformation solution in homeland Security and National security public safety Market AGR (%) – 2020-2026. 117

Figure 66- EMEA Counter Misinformation solution in homeland Security and National security public safety Market Share (%) – 2020-2026. 118

Figure 67- APAC Counter Misinformation solution in homeland Security and National security public safety Market Size ($M) – 2020-2026. 120

Figure 68- APAC Counter Misinformation solution in homeland Security and National security public safety Market AGR (%) – 2020-2026. 120

Figure 69- APAC Counter Misinformation solution in homeland Security and National security public safety Market Share (%) – 2020-2026  121

Questions about this report?

Contact Sales: 1-571-527-1010 or Analysts: 1-202-455-0966

  • Have a question about Counter Misinformation -DeepFake & Fake News Solutions Market - 2020-2026
    Please fill out all fields in the form below and click "Submit" to send your question.
    Our representative will review your question and contact you with an answer as soon as possible.
  • 2+2=
  • This field is for validation purposes and should be left unchanged.
1
Interested in this report? Need more information?

You may also like…

X
Powered By