Top
HSRCExplosives & Narcotics Trace Detection (ETD) Market & Technologies – 2015-2020
Placeholder

Explosives & Narcotics Trace Detection (ETD) Market & Technologies - 2015-2020

Paris Terror Drives Europe to Lead ETD Market Growth: CAGR 16%

  • Q1 2015
  • 538
  • 294
    • 3450 $
    • 4450 $
    • 6950 $
    • 8000 $

    Small Businesses, Startups & Academia - Up to 50% Off

Quantity
IBM
Amazon
Sandia National Lab
HITACHI
Thales
Smiths Detection
Nuctech
Korea Internet & Security Agency
L3Harris
Huawei
Leidos
NEC
Toshiba
Deloitte
MAG

Want to customize this report?

If you purchase this report, you are entitled to a 30% discount towards customizing it, to better fit your market research and strategic needs. Our Custom Research and Industry Insights Department will work with you to better understand your information gaps and strategic needs and will provide you with a tailor-made market research report within a short period of time.

Why Choose Us?

30+ Years of Experience
We are a multidisciplinary team of Transformational Technologies industry experts with over 30 years of experience.
Gold Standard
With over 950 private sector clients (73% repeat customers), including major defense and security vendors, and Forbes Global 2000 companies, HSRC earned the reputation as the industry’s Gold Standard for Transformational Technologies Market Reports.
Tailored Research Services
Provide you with clear, actionable recommendations designed to empower decision making and to help you exploit emerging opportunities in the Transformational Technologies industries.
Information Security
Your personal information is safe and secure.

From: $3,450

Description

Checkout our updated Explosives Trace Detection Market & ETD Technologies 2017-2022 report.

Explosives and Narcotics Trace Detection (ETD) is a key modality within the Homeland Security, military and public safety infrastructure. Uses of ETD include air-sea-land transportation security, force protection, law enforcement, critical infrastructure protection and public safety.

Following the January 2015 terror attacks in Paris we forecast that the demand for ETD systems will increase in the European aviation & public transportation security sector, secured facilities, first responders and public venues security.

Explosives & Narcotics Trace Detection (ETD): Technologies & Global Market - 2015-2020 Explosives & Narcotics Trace Detection (ETD): Technologies & Global Market - 2015-2020
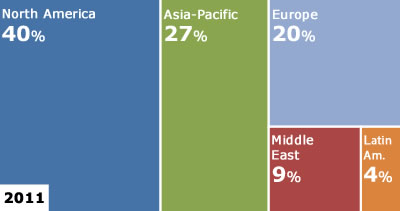
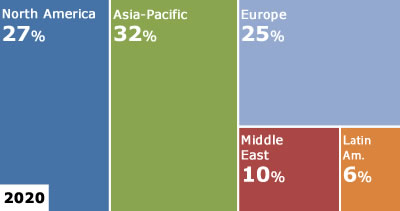
ETD Systems Sales & Aftersale Revenues Market Share [%] by Region – 2011, 2020

The multibillion-dollar ETD market is to undergo an accelerated growth period driven by:

  • The January 2015 Paris terror attack leading to a European security funding hike
  • No competitive explosives and narcotics trace detection products on the horizon
  • Oil-gas industry security needs
  • China’s massive investments in new airports and public security
  • Middle Eastern terror
  • Latin America war on drugs
  • The Indian government counter terror investments
  • The U.S. and the EU legislations enforcing 100% cargo screening on all passenger flights

Homeland Security Research Corporation analysts forecast that the 2015-2020 ETD market (including systems sales, service, consumables and upgrades) will present multibillion-dollar business opportunities growing at a CAGR of 14%. The Explosives & Narcotics Trace Detection (ETD): Technologies & Global Market 2015-2020 report segmented into 45 submarkets, offers for each submarket 2011-2014 data, as well as 2015-2020 forecast and analysis. In 538 pages, 157 tables and 137 figures, the report analyzes and projects the market and technologies from several perspectives, including:

  • Vertical submarkets (e.g., transportation security, secured facilities security)
  • National and regional markets (U.S., Europe, China, Asia-Pacific, Middle East, Latin America, ROW)
  • 27 national markets data including: national ETD market background, aviation security and more
  • Over 1700 airports, segmented by country, with their recent traffic data
  • ETD sales vs. upgrade, consumables and service revenues
  • Sales by product configuration (hand-held, table-top and other detectors)
  • Product comparison tables
  • Major ETD vendors profiles, products and prices including: Auto Clear US (Formerly Control Screening LLC), Biosensor Applications AB, DetectaChem, LLC, Electronic Sensor Technology, Hitachi, Ltd, ICx Technologies (Flir), Implant Sciences Corp., Ion Applications, Inc., Ketech Defence, Mistral Security, Inc, Morpho Detection Inc., NUCTECH Co. Ltd, Red X Defense, SCANNA MSC Ltd., Scent Detection Technologies, Scintrex Trace, Sibel Ltd, Smiths Detection, Syagen Technology, Thermo Fisher Scientific Inc., Westminster International Ltd.
  • Market analysis (e.g., market dynamics, market drivers and inhibitors)
  • Recent U.S. government contracts with ETD suppliers (including general terms & conditions, price lists and more): Control Screening LLC, Federal Resources Supply Co., ICx Technologies Inc., Implant Sciences Corp, Laurus Systems Inc., Morpho Detection, Security 20/20 Inc., Security Detection, Smiths Detection, Treasure Electronics, Inc., Veteran Corps of America, Winvale Group.
  • Contact info of more than 550 potential ETD customers (authorized air-cargo screening facilities)
  • Current and pipeline ETD technologies including: Ion Mobility Spectroscopy (IMS), ChemiLuminescence (Thermal Energy Analyzers), Electron Capture Detectors (ECD), Surface Acoustic Wave (SAW), Nanotechnology-enabled Technologies for Explosives Detection, Advanced Sample Collection, Dual Sensor ETD Technology, Chemical Warfare and Narcotics Trace Detectors, Receptor-based Technologies, Molecularly Imprinted Polymers, Nano-mechanical Sensors, Electronic Nose, Silica Micro-cantilever, Surface Enhanced Raman Scattering, Protein Coated Carbon Nanotubes, Piezo-resistive Polymer Cantilever, Inkjet Based Wireless ETD Sensor, Amino-silane Coated Nanowires Arrays, Free-surface Microfluidic Control of Surface-Enhanced Raman Spectroscopy, Molecularly Imprinted Polymers, Cantilever Nano Mechanical Sensors, Sensor Array and Neural Network, Temperature-Stepped Desorption, UV-PLF, Non-Contact Explosives Harvesting, Pulsed-Ultraviolet Laser Raman Spectroscopy, Nanowire-Nano-cluster Hybrids, Laser-Induced Breakdown Spectroscopy (LIBS), MEMS-Based Explosive Particle Detection, Remote Particle Stimulation, Laser Vaporization.
  • Business opportunities
  • Product price lists, including list prices and U.S. government prices of 100’s systems and consumables
  • Competitive analysis & SWOT analysis

Key Questions Answered in this Report

  • What will the market size be in 2015-2020?
  • What are the key and pipeline technologies?
  • What are the key market trends?
  • What are the opportunities to increase your market share?
  • What is driving this market?
  • What are the inhibitors to your growth?
  • What are the risks to your market share?
  • Who are the key vendors in this market?
  • What are the threats faced by the key vendors?

Table of Contents

Download TOC as PDF
1 Summary
2 Extended Summary
2.1 Major Findings
2.2 Major Conclusions
2.3 Global ETD Market – 2015-2020
2.3.1 The 2015-2020 Global ETD Market Outlook
2.3.2 Global ETD Market: Systems Sales & Aftersales Revenues – 2015-2020
2.3.3 Global Vertical ETD Submarkets -2011-2020
2.3.4 ETD Total Market by Country/Region – 2015-2020
2.3.5 Cumulative 2013-2020 Global ETD Market by Vertical Submarket and Country/Region
3 Narcotics Trafficking
3.1 Illegal Narcotics Trade
3.2 Narcotics Trafficking via West Africa
3.3 Narcotics Trafficking Route in Asia
3.4 Narcotics Trafficking in the United States
3.5 Narcotics Trafficking in Mexico
3.6 Narcotics Industry in Colombia
4 ETD Market: Drivers
5 ETD Market: Inhibitors
6 SWOT Analysis
6.1 Strengths
6.2 Weaknesses
6.3 Opportunities
6.4 Threats
7 Competitive Analysis
8 Explosives and Narcotics Detection Technologies
8.1 Explosive Materials Classification
8.2 Canine Explosives and NarcoticsScreening
8.3 Explosives and Narcotics Detection Technologies
8.3.1 Explosives and Narcotics Trace Detection (ETD)
8.3.2 Bulk Explosives and Narcotics Detection
8.3.3 Current Explosives & Narcotics Detection Technologies Map
8.3.4 ETD vs. Bulk Explosives & Narcotics Detection: Pros & Cons
8.4 ETD and Other Explosive Detection Systems: Prices
8.5 Emerging People Screening Technologies
9 Current Explosives and Narcotics Trace Detection (ETD) Technologies
9.1 ETD Principles of Operation
9.2 ETD Core Technologies
9.2.1 Overview
9.2.2 Ion Mobility Spectroscopy (IMS)
9.2.3 ChemiLuminescence (Thermal Energy Analyzers)
9.2.4 Electron Capture Detectors (ECD)
9.2.5 Surface Acoustic Wave (SAW)
9.2.6 Nanotechnology-enabled Technologies for Explosives and Narcotics Detection
10 Technology Outlook – 2015-2020
10.1 Introduction
10.2 Techno-Tactical Needs
10.3 ETD of the Future: Techno-Tactical Drivers
10.4 ETD of the Future: Performance & Operational Goals
10.5 Advanced Sample Collection
10.6 Dual Sensor ETD Technology
10.7 Integrated Explosives, Chemical Warfare and Narcotics Trace Detectors
11 Pipeline ETD Technologies
11.1 Nanotechnology Explosives and Narcotics Trace Detection: Challenges
11.2 Receptor-based ETD
11.3 Molecularly Imprinted Polymers Based ETD
11.4 Nano-mechanical Sensor Based ETD
11.5 Electronic Nose Based ETD
11.6 Silica Micro-cantilever Based ETD
11.7 Surface Enhanced Raman Scattering Based ETD
11.8 Hybrid Nano-sensor Based ETD
11.9 Protein Coated Carbon Nanotubes, Nano Based ETD
11.1 Piezo-resistive Polymer Cantilever Nano Based ETD
11.11 Inkjet Based Wireless Sensor ETD Technology
11.12 Amino-silane Coated Nanowires Arrays Based ETD
11.13 Free-surface Microfluidic Control of Surface-Enhanced Raman Spectroscopy Based ETD
11.13.1 Introduction
11.13.2 Trace Chemical Vapor Detection Cartridge
11.13.3 Free Surface MicroFluidic Chip
11.13.4 Continuous Preconcentrator
11.13.5 Raman Chemical Specific Signatures
11.14 Molecularly Imprinted Polymers Explosives and Narcotics Detection Kit
11.15 Quantum Sniffer™ Portable ETD
11.16 Cantilever Nano Mechanical Sensors
11.17 Sensor Array and Neural Network Based ETD
11.18 Temperature-Stepped Desorption Based ETD
11.19 Trace Detection of Nitrogen-Based Explosives with UV-PLF
11.2 Non-Contact Explosives and Narcotics Harvesting ETD
11.20.1 Non-Contact Harvesting
11.20.2 ETD Transport
11.20.3 ETD Analysis
11.20.4 ETD Reporting
11.21 Check Point Explosives and Narcotics Detection System
11.22 Trace Detection of Small Molecules by Pulsed-Ultraviolet Laser Raman Spectroscopy
11.23 Sensing Trace Amounts of Nitro-Aromatic Explosives and Narcotics Using Nanowire-Nanocluster Hybrids
11.24 Detection of Explosives and Narcotics at Trace Levels by Laser-Induced Breakdown Spectroscopy (LIBS)
11.25 Universal Explosive Detection System
11.26 MEMS-Based Explosive Particle Detection and Remote Particle Stimulation
11.27 Laser Vaporization of Trace Explosives and Narcotics for Enhanced Non-Contact Detection
11.28 Advanced Materials and Sensor Platforms
11.29 Basic Research
12 Pipeline ETD Systems by Configuration and Application
12.1 ETD Based Document Scanner
12.2 Boarding Gate Explosives Scanners
12.3 Vehical Screening ETD Systems
13 Aviation Security Screening
13.1 Market Background
13.2 Legislation and Regulations Schedule
13.3 People Screening Portals
13.4 Checked Luggage Screening
13.4.1 Screening Process
13.4.2 Screening Process
13.4.3 ETD Based Screening
13.5 Air Cargo Screening
13.5.1 Air Cargo Explosives Screening: Background
13.5.2 Global Air Travel 1980-2012 Growth
14 Global ETD Market – 2011-2014 Data & 2015-2020 Forecast
14.1 ETD Global Market
14.1.1 Global Systems Sales vs. Service, Consumables & Upgrade Revenues – 2011 – 2020
14.1.2 Global Vertical ETD Submarkets
14.2 Global ETD Systems Sales
14.2.1 Sales by Vertical Submarket – 2011- 2020
14.2.2 Sales by Configuration: Hand-Held, Table-Top & Other Configurations – 2011- 2020
14.3 Global ETD Aftersale Market
14.3.1 ETD Aftersales Market Trends
14.3.2 Contracted ETD Service Business
14.3.3 Time and Materials Revenues
14.3.4 ETD Spare Parts Revenues
14.3.5 ETD Consumables Revenues
14.3.6 Typical ETD Lifecycle
14.4 Global Vertical ETD Submarkets
14.4.1 Global Transportation Security ETD Market – 2011-2014 Data & 2015-2020 Forecast
14.4.2 Global Secured Facilities ETD Market – 2011-2014 Data & 2015-2020 Forecast
14.4.3 Global “Other Applications” ETD Market – 2011-2014 Data & 2015-2020 Forecast
14.5 ETD Market by Country/Region
14.5.1 ETD Total Market ( Incl. Systems Sales & Aftersales Revenues) by Country/Region – 2015-2020
14.5.2 Systems Sales by Country/Region – 2011-2014 Data & 2015-2020 Forecast
14.6 ETD Aftersale Market by Country/Region
14.7 Cumulative 2013-2020 Global Market by Vertical Submarket & Country/Region
15 U.S. ETD Market – 2011-2014 Data & 2015-2020 Forecast
15.1 Market Background
15.1.1 Transportation Sector
15.1.2 Transportation Security
15.1.2.1 Managing and Coordinating Transportation Industry Security Responsibilities
15.2 U.S. ETD Market Overview
15.3 TSA ETD Related Programs
15.3.1 Passengers Checkpoint Support Program
15.3.2 TSA EDS and ETD Procurement and Installation Program
15.3.3 TSA Screening Technology Maintenance & Utilities Program
15.4 U.S. Air-Cargo Screening Regulations
15.5 TSA Certified Air-Cargo Screening Program (CCSP)
15.5.1 Air-Cargo Screening Legislation
15.5.2 U.S. ETD Air Cargo Business Considerations
15.5.2.1 CCSP Benefits
15.5.2.2 TSA air Cargo Screening Requirements
15.5.2.3 TSA Air Cargo Screening
15.5.2.4 Air Cargo Screening Chain of Custody
15.5.2.5 Certified Cargo Screening Locations
15.5.2.6 Independent U.S. Cargo Screening Facility Screening Locations
15.5.3 Networked ETD Systems
15.5.4 U.S. ETD Related Regulations
15.5.5 U.S. Aviation Passenger Security Screening Statistics
15.6 U.S. ETD Market Analysis, 2011-2014 Data & 2015-2020 Forecast
15.7 U.S. ETD Systems Sales
15.8 U.S. ETD Aftersale Market
15.9 Total U.S. ETD Market
15.9.1 U.S. Vertical ETD Submarkets – 2011-2014 Data & 2015-2020 Forecast
15.9.2 U.S. ETD Market: Systems Sales, Service, Consumables & Upgrade Revenues – 2011-2014 Data & 2015-2020 Forecast
15.1 U.S. Vertical ETD Submarkets
15.10.1 U.S. Transportation Security ETD Market – 2011-2014 Data & 2015-2020 Forecast
15.10.2 U.S. Secured Facilities ETD Market – 2011-2014 Data & 2015-2020 Forecast
15.10.3 Other Applications ETD Market – 2011-2014 Data & 2015-2020 Forecast
16 European ETD Market – 2015-2020
16.1 European ETD Market Background
16.1.1 Overview
16.1.2 EU ETD Related Regulation
16.1.3 Screening of Air Cargo Routed to the U.S.
16.2 European Aviation Passenger Security Market by Countries
16.2.1 United Kingdom Aviation Security Background
16.2.1.1 UK Aviation Passenger Security Screening Statistics
16.2.2 Sweden Aviation Passenger Security Screening Statistics
16.2.3 Denmark Aviation Passenger Security Screening Statistics
16.2.4 Netherlands Aviation Passenger Security Screening Statistics
16.2.5 Belgium Aviation Passenger Security Screening Statistics
16.2.6 Germany Aviation Security Background
16.2.6.1 Germany Aviation Passenger Security Screening Statistics
16.2.7 France Aviation Security Background
16.2.7.1 France Aviation Passenger Security Screening Statistics
16.2.8 Spain Aviation Passenger Security Screening Statistics
16.2.9 Italy Aviation Security Background
16.2.9.1 Italy Aviation Passenger Security Screening Statistics
16.2.10 Austria Aviation Passenger Security Screening Statistics
16.2.11 Czech Republic Aviation Passenger Security Screening Statistics
16.2.12 Poland Aviation Passenger Security Screening Statistics
16.2.13 Russia Aviation Security Background
16.2.13.1  Russia Aviation Passenger Security Screening Statistics
16.3 Europe Market Analysis, 2011-2012 Market Data & 2013-2020 Market Forecast
16.4 Systems Sales
16.5 ETD Aftersales Market
16.6 EuropeTotal Market
16.6.1 Vertical European Submarkets – 2011-2014 Data & 2015-2020 Forecast
16.6.2 Systems Sales, Service, Consumables & Upgrade Revenues – 2011-2014 Data & 2015-2020 Forecast
16.7 Vertical Submarkets
16.7.1 Transportation Security ETD Market – 2011-2014 Data & 2015-2020 Forecast
16.7.2 Secured Facilities ETD Market – 2011-2014 Data & 2015-2020 Forecast
16.7.3 Other Applications ETD Market – 2011-2014 Data & 2015-2020 Forecast
17 Middle East ETD Market – 2011-2014 Data & 2015-2020 Forecast
17.1 Market Background
17.1.1 Overview
17.1.2 Screening of Air Cargo Routed from the Middle East to the U.S.
17.2 Middle East Aviation Passenger Security Market by Countries
17.2.1 Turkey Aviation Security Background
17.2.1.1 Turkey Aviation Passenger Security Screening Statistics
17.2.2 Israel Aviation Security Background
17.2.2.1 Israel Aviation Passenger Security Screening Statistics
17.2.3 Saudi Arabia Aviation Security Background
17.2.3.1 Saudi Arabia Aviation Passenger Security Screening Statistics
17.2.4 U.A.E. Aviation Security Background
17.2.4.1 U.A.E. Aviation Passenger Security Screening Statistics
17.2.5 Qatar Aviation Security Background
17.2.5.1 Qatar Aviation Passenger Security Screening Statistics
17.2.6 Kuwait Aviation Passenger Security Screening Statistics
17.2.7 Iraq Aviation Passenger Security Screening Statistics
17.2.8 Nigeria Aviation Security Background
17.2.8.1 Nigeria Aviation Passenger Security Screening Statistics
17.2.9 South Africa Aviation Passenger Security Screening Statistics
17.3 Middle East Market Analysis, 2011-2012 Market Data & 2013-2020 Market Forecast
17.4 Systems Sales
17.5 Middle East ETD Aftersale Market
17.6 Total Middle Eastern ETD Market
17.6.1 ETD Vertical Submarkets – 2011-2014 Data & 2015-2020 Forecast
17.6.2 Systems Sales, Service, Consumables & Upgrade Revenues – 2011-2014 Data & 2015-2020 Forecast
17.6.3 Transportation Security ETD Market – 2011-2014 Data & 2015-2020 Forecast
17.6.4 Secured Facilities ETD Market – 2011-2014 Data & 2015-2020 Forecast
17.6.5 Other Applications ETD Market – 2011-2014 Data & 2015-2020 Forecast
18 China ETD Market – 2011-2014 Data & 2015-2020 Forecast
18.1 Market Background
18.1.1 Overview
18.1.2 China Explosives and Narcotics & Contraband Screening Devices: Market Background
18.1.3 China Aviation Security Market
18.1.4 China Aviation Security Background
18.1.5 China Aviation Passenger Security Screening Statistics
18.1.6 China Maritime Security
18.1.6.1 China’s Container Security Initiative (CSI)
18.1.7 China Mass Transportation Security
18.1.7.1 Land Transport Infrastructure in China
18.1.7.2 China Metro Transportation Security
18.1.7.3 China Railway Security
18.2 China ETD Market Analysis, 2011-2014 Data & 2015-2020 Forecast
18.3 China ETD Systems Sales
18.3.1 ETD Systems Sale Market by Vertical Submarkets.
18.4 China ETD Aftersale Market
18.5 China ETD Total Market
18.5.1 ETD Vertical Submarkets – 2011-2014 Data & 2015-2020 Forecast
18.5.2 Systems Sales, Service, Consumables & Upgrade Revenues – 2011-2014 Data & 2015-2020 Forecast
18.6 Vertical Submarkets
18.6.1 Transportation Security ETD Market – 2011-2014 Data & 2015-2020 Forecast
18.6.2 Secured Facilities ETD Market – 2011-2014 Data & 2015-2020 Forecast
18.6.3 Other Applications ETD Market – 2011-2014 Data & 2015-2020 Forecast
19 Asia-Pacific ETD Market – 2011-2014 Data & 2015-2020 Forecast
19.1 Market Background
19.2 Asia Pacific Aviation Passenger Security by Countries
19.2.1 Azerbaijan Aviation Passenger Security Security Screening Statistics
19.2.2 Kazakhstan Aviation Passenger Security Screening Statistics
19.2.3 Pakistan Aviation Passenger Security Screening Statistics
19.2.4 India Aviation Security Background
19.2.4.1 India Aviation Passenger Security Screening Statistics
19.2.5 Taiwan Aviation Passenger Security Screening Statistics
19.2.6 South Korea Aviation Passenger Security Screening Background
19.2.6.1 South Korea Aviation Passenger Security Screening Statistics
19.2.7 Japan Aviation Security Background
19.2.7.1 Japan Aviation Passenger Security Screening Statistics
19.2.8 Singapore Aviation Passenger Security Screening Statistics
19.2.9 Malaysia Aviation Passenger Security Screening Statistics
19.2.10 Indonesia Aviation Security Background
19.2.10.1 Indonesia Aviation Passenger Security Screening Statistics
19.2.11 Australia Aviation Security Background
19.2.11.1 Australia Aviation Passenger Security Screening Statistics
19.3 Asia-Pacific ETD Market Analysis, 2011-2014 Market Data & 2015-2020 Market Forecast
19.4 Systems Sales
19.5 Asia Pacific (Excl. China) ETD Aftersale Market
19.6 Total Market (Systems, Service, Consumables & Upgrade)
19.6.1 ETD Vertical Submarkets – 2011-2014 Data & 2015-2020 Forecast
19.6.2 Systems Sales, Service, Consumables & Upgrade Revenues – 2011-2014 Data & 2015-2020 Forecast
19.7 Vertical Submarkets
19.7.1 Transportation Security ETD Market – 2011-2014 Data & 2015-2020 Forecast
19.7.2 Secured Facilities ETD Market – 2011-2014 Data & 2015-2020 Forecast
19.7.3 Other Applications ETD Market – 2011-2014 Data & 2015-2020 Forecast
20 Latin America ETD Market – 2011-2014 Data & 2015-2020 Forecast
20.1 Market Background
20.2 Latin America Aviation Passenger Security Market by Countries
20.2.1 Mexico Aviation Passenger Security Screening Statistics
20.2.2 Colombia Aviation Passenger Security Screening Statistics
20.2.3 Brazil Aviation Security Background
20.2.3.1 Brazil Aviation Passenger Security Screening Statistics
20.2.4 Argentina Aviation Passenger Security Screening Statistics
20.3 Latin America Market Analysis, 2011-2012 Market Data & 2013-2020 Market Forecast
20.4 Systems Sales
20.5 ETD Aftersale Market
20.6 Total Market (Systems, Service, Consumables & Upgrade)
20.6.1 ETD Vertical Submarkets – 2011-2014 Data & 2015-2020 Forecast
20.6.2 Systems Sales, Service, Consumables & Upgrade Revenues – 2011-2014 Data & 2015-2020 Forecast
20.7 Vertical Submarkets
20.7.1 Transportation Security ETD Market – 2011-2014 Data & 2015-2020 Forecast
20.7.2 Secured Facilities ETD Market – 2011-2014 Data & 2015-2020 Forecast
20.7.3 Other Applications ETD Market – 2011-2014 Data & 2015-2020 Forecast
21 ROW ETD Market – 2011-2014 Data & 2015-2020 Forecast
21.1 ROW ETD Market Background
21.2 ROW Market Analysis, 2011-2012 Market Data & 2013 -2020 Market Forecast
21.3 Systems Sales
21.4 ROW ETD Aftersale Market
21.5 Total Market (Systems, Service, Consumables & Upgrade)
21.5.1 ETD Vertical Submarkets – 2011-2014 Data & 2015-2020 Forecast
21.5.2 Systems Sales, Service, Consumables & Upgrade Revenues – 2011-2014 Data & 2015-2020 Forecast
21.6 Vertical Submarkets
21.6.1 Transportation Security ETD Market – 2011-2014 Data & 2015-2020 Forecast
21.6.2 Secured Facilities ETD Market – 2011-2014 Data & 2015-2020 Forecast
21.6.3 Other Applications ETD Market – 2011-2014 Data & 2015-2020 Forecast
22 ETD Systems from 2012 TSA Air Cargo Screening Technology List
22.1 ETD Devices Qualified for Screening Operations
22.2 ETD Devices Conditionally Approved for Screening Operations
23 ETD Business Opportunities
23.1 Improved Detection Quality
23.2 Enable Multiple-threat Detection
23.3 ReduceTransaction Cost
23.4 Increase Automation
23.5 Reduce Throughput Delays
23.6 Ease of Integration
23.7 Medium Capacity, Multi-Threat Screening Systems
23.8 Upgraded Bio-Chem, Narcotics & Explosives Multi-Threat Trace Detection Screening
23.9 “Power” Multi-Threat ETD Vapor-trace Collector
23.1 Fused Technology Screening Systems with RFID and Risk Assessment Infrastructure
23.11 Third Party Service
24 Leading Vendors
24.1 American Innovations, Inc.
24.2 Auto Clear US (Formerly Control Screening LLC)
24.2.1 Company Profile & Contact Information
24.2.2 ETD Screening Products
24.3 Biosensor Applications AB
24.3.1 Company Profile & & Contact Information
24.3.2 ETD Screening Products
24.4 Bruker Corporation
24.5 DetectaChem, LLC
24.5.1 Company Profile & Contact Information
24.5.2 ETD Screening Products
24.6 Electronic Sensor Technology
24.6.1 Company Profile & Contact Information
24.6.2 ETD Screening Products
24.7 FLIR Systems, Inc.
24.7.1 Company Profile & Contact Information
24.7.2 ETD Screening Products
24.8 Hitachi, Ltd
24.8.1 Company Profile & Contact Information
24.8.2 ETD Screening Products
24.9 ICx Technologies
24.9.1 Company Profile & Contact Information
24.9.2 ETD Screening Products
24.1 Implant Sciences
24.10.1 Company Profile & Contact Information
24.10.2 ETD Screening Products
24.11 Ion Applications, Inc.
24.11.1 Company Profile & Contact Information
24.11.2 ETD Screening Products
24.12 Ketech Defence
24.12.1 Company Profile & Contact Information
24.12.2 ETD Screening Products
24.13 Mistral Security, Inc
24.13.1 Company Profile & Contact Information
24.13.2 ETD Screening Products
24.14 Morpho Detection Inc.
24.14.1 Company Profile & Contact Information
24.14.2 ETD Screening Products
24.15 NUCTECH Co. Ltd
24.15.1 Company Profile & Contact Information
24.15.2 ETD Screening Products
24.16 Red X Defense
24.16.1 Company Profile & Contact Information
24.16.2 ETD Screening Products
24.17 SCANNA MSC Ltd.
24.17.1 Company Profile & Contact Information
24.17.2 ETD Screening Products
24.18 Scent Detection Technologies
24.18.1 Company Profile & Contact Information
24.18.2 ETD Screening Products
24.19 Scintrex Trace
24.19.1 Company Profile & Contact Information
24.19.2 ETD Screening Products
24.2 Sibel Ltd
24.20.1 Company Profile & Contact Information
24.20.2 ETD Screening Products
24.21 Smiths Detection
24.21.1 Company Profile & Contact Information
24.21.2 ETD Screening Products
24.22 Syagen Technology
24.22.1 Company Profile & Contact Information
24.22.2 ETD Screening Products
24.23 Thermo Fisher Scientific Inc.
24.23.1 Company Profile & Contact Information
24.23.2 ETD Screening Products
24.24 Westminster International Ltd.
24.24.1 Company Profile & Contact Information
24.24.2 ETD Screening Products
25 Appendix A: ETD Product Comparison
25.1 Desktop ETD Products: Vendors, Prices, Technologies, Detection & Capabilities Comparison
25.2 Colorimetric ETD Products by Vendors, Prices, Technologies & Detection
25.3 Hand-Held ETD by: Products, Vendors, Prices, Technologies, Detection & Capabilities Comparison
25.4 ETD Document Scanners: Products, Prices, Technologies & Explosives
25.5 People Screening ETD Portals: Products, Vendors Price Comparison
26 Appendix B: ETD Products – Prices and Procurement Contracts
26.1 American Innovations, Inc.
26.1.1 Contractor Information
26.1.2 ETD Screening Products
26.2 Anchortex Corporation
26.2.1 Contractor Information
26.2.2 ETD Screening Products
26.3 Control Screening LLC
26.3.1 Contractor Information
26.3.2 ETD Screening Products
26.3.3 Control Screening LLC – U.S. Government Contract
26.4 Federal Resources Supply Co.
26.4.1 Contractor Information
26.4.2 ETD Screening Products
26.4.3 Federal Resources Supply Co. – U.S. Government Contract
26.5 ICx Technologies, Inc.
26.5.1 Contractor Information
26.5.2

ETD Screening P

Tables

Table 1 Global ETD: Systems Sales, Service, Consumables and Upgrade Revenues, Total Market [$M] and CAGR [%] – 2011-2020
Table 2 Global ETD Vertical Submarkets [$M] – 2011-2020
Table 3 Global ETD: Systems Sales, Service, Consumables and Upgrade Revenues, Total Market [$M] and CAGR [%] – 2011-2020
Table 4 Global ETD Market (Incl. Systems Sales, Service, Consumables & Upgrade) [$M] by Vertical Submarket – 2011-2020
Table 5 ETD Market (Incl. Systems Sales, Service, Consumables & Upgrade) by Country/Region [$M] and CAGR [%] – 2011-2020
Table 6 Global Cumulative 2013-2020 ETD Market [$M] by: Vertical Submarket, Systems Sales, Aftersales Revenues and Region/Country
Table 7 Number and Costs of TSA Canine Teams by Type of Team
Table 8 ETD vs. Bulk Explosives and Narcotics Detection Technologies
Table 9 Checkpoint Technology Average U.S. Government Price per System
Table 10 Emerging Technologies: Description
Table 11 ETD Core Technologies by Current Use and TSA Approval
Table 12 ETD Nanotechnology Techniques
Table 13 Quantum Sniffer: Features & Benefits
Table 14 The Aviation Industry, by Passenger Traffic RPK CAGR and Air Cargo RTK CAGR-2010-2030
Table 15 Annual Aviation Passengers Traffic [RPK in Billion] by Region – 2002-2030
Table 16 Aviation Security Explosives Screening: Regulatory Schedule
Table 17 ETD Portals – Sensor Technology Comparison
Table 18 Checked Luggage Screening TSA Approved ETD Systems Performance
Table 19 Global ETD: Systems Sales, Service, Consumables and Upgrade Revenues, Total Market [$M] and CAGR [%] – 2011-2020
Table 20 Global ETD Market (Incl. Systems Sales, Service, Consumables & Upgrade) [$M] by Vertical Submarket – 2011-2020
Table 21 Global ETD Systems Sales [$M] by Vertical Submarket – 2011-2020
Table 22 Global ETD Systems Sales [$M] by: Hand-Held, Desktop & Other ETD Systems – 2011-2020
Table 23 Global ETD Systems Sales Market Share [%] of: Hand-Held, Desk-Top & Other ETD Systems – 2011-2020
Table 24 Global ETD Aftersales Market [$M] by Vertical Submarket – 2011-2020
Table 25 Global Transportation Security ETD Systems Sales, Service, Consumables & Upgrade Revenues [$M] and AGR[%] – 2011-2020
Table 26 Global Secured Facilities ETD Systems Sales, Service, Consumables & Upgrade Revenues [$M] and AGR [%] – 2011-2020
Table 27 Global Other Applications ETD Systems Sales, Service, Consumables & Upgrade Revenues [$M] and AGR [%] – 2011-2020
Table 28 Global ETD Market (Incl. Sales, Service, Consumables & Upgrade) [$M] and CAGR [%] by Country/Region – 2011-2020
Table 29 Global ETD Systems Sales [$M] and CAGR [%] by Country/Region – 2011-2020
Table 30 ETD Service, Consumables & Upgrade Market [$M] and CAGR [%] by Country/Region – 2011-2020
Table 31 Global Cumulative 2013-2020 ETD Market [$M] by: Vertical Submarket, Systems Sales, Aftersales Revenues and Region/Country
Table 32 Transportation Systems Industry, Divisions Statistics
Table 33 U.S.A. Potential Sites Requiring ETD Screening
Table 34 TSA Airport Passengers and Baggage Installed Base [Units] and Procurement Plans Statistics by Modality.
Table 35 TSA Program Progress Relative to EDS/ETD Deployment and Facility Modifications – Projections through FY 2013
Table 36 TSA Screening Technology Maintenance & Utilities Program Components
Table 37 FY 2013 TSA Checked Baggage Screening Systems Maintenance Cost [$M] and by System Model [unit]
Table 38 U.S. ETD Related Regulatory Schedule
Table 39 U.S. Passenger Screening [M] by 501 Airports
Table 40 U.S. ETD Market [$M] and AGR [%] – 2011-2020
Table 41 U.S. ETD Systems Sales [$M] by Vertical Submarket – 2011-2020
Table 42 U.S. ETD Service, Consumables & Upgrade Revenues [$M] by Vertical Submarket – 2011-2020
Table 43 U.S. ETD Market (Incl. Systems Sales, Service, Consumables & Upgrade) [$M] by Vertical Submarket – 2011-2020
Table 44 U.S. ETD Market: Systems Sales, Service, Consumables & Upgrade Revenues, Total Market [$M] and CAGR [%] – 2011-2020
Table 45 U.S. Transportation Security ETD Market: Systems Sales, Service, Consumables & Upgrade Revenues [$M] and AGR[%] – 2011-2020
Table 46 U.S. Secured Facilities ETD Market: Systems Sales, Service, Consumables & Upgrade Revenues [$M] and AGR[%] – 2011-2020
Table 47 U.S. Other Applications ETD Market: Systems Sales, Service, Consumables & Upgrade Revenues [$M] and AGR [%] – 2011-2020
Table 48 EU ETD Regulatory Schedule
Table 49 UK Passenger Screening [M] by 38 Airports
Table 50 Sweden Passenger Screening [M] by 18 Airports
Table 51 Denmark Passenger Screening [M] by 7 Airports
Table 52 Netherlands Passenger Screening [M] by 5 Airports
Table 53 Belgium Passenger Screening [M] by 5 Airports
Table 54 Germany Passenger Screening [M] by 26 Airports
Table 55 France Passenger Screening [M] by 57 Airports
Table 56 Spain Passenger Screening [M] by 30 Airports
Table 57 Italy Passenger Screening [M] by 31 Airports – 2013-2014
Table 58 Austria Passenger Screening [M] by 6 Airports
Table 59 Czech Republic Passenger Screening [M]
Table 60 Poland Passenger Screening [M] by 11 Airports
Table 61 Russia Passenger Screening [M] by 58 Airports
Table 62 Europe ETD Market [$M] and AGR [%] – 2011-2020
Table 63 Europe ETD Systems Sales [$M] by Vertical Submarket – 2011-2020
Table 64 Europe ETD Service, Consumables & Upgrade Revenues [$M] by Vertical Submarket – 2011-2020
Table 65 Europe ETD Market (Incl. Systems Sales, Service, Consumables & Upgrade) [$M] by Vertical Submarket – 2011-2020
Table 66 Europe ETD Market By: Total Market, Systems Sales, Service, Consumables and Upgrade Revenues [$M] and CAGR [%] – 2011-2020
Table 67 Europe Transportation Security ETD Market: Systems Sales, Service, Consumables & Upgrade Revenues [$M] and AGR [%] – 2011-2020
Table 68 Europe Secured Facilities ETD Market: Systems Sales, Service, Consumables & Upgrade Revenues [$M] and AGR [%] – 2011-2020
Table 69 Europe Other Applications Other Applications ETD Market: Systems Sales, Service, Consumables & Upgrade Revenues [$M] and AGR [%] – 2011-2020
Table 70 Turkey Passenger Screening [M] by 36 Airports
Table 71 Israel Airport Passenger Screening Data [M]
Table 72 Saudi Arabia Passenger Screening [M] by 4 Airports
Table 73 U.A.E. Passenger Screening [M] by 3 Airports
Table 74 Doha Airport Passenger Screening [M]
Table 75 Kuwait Airport Passenger Screening [M]
Table 76 Iraq Passenger Screening [M] by 2 Airports
Table 77 Nigeria Passenger Screening [M] by 12 Airports
Table 78 South Africa Passenger Screening [M] by 9 Airports
Table 79 Middle East ETD Market [$M] and AGR [%] – 2011-2020
Table 80 Middle East ETD Systems Sales [$M] by Vertical Submarket – 2011-2020
Table 81 Middle East ETD Service, Consumables & Upgrade Revenues [$M] by Vertical Submarket – 2011-2020
Table 82 Middle East ETD Market (Incl. Systems Sales, Service, Consumables & Upgrade) [$M] by Vertical Submarket – 2011-2020
Table 83 Middle East ETD Market: Systems Sales, Service, Consumables & Upgrade Revenues, Total Market [$M] and CAGR [%] – 2011-2020
Table 84 Middle East Transportation Security ETD Market: Systems Sales, Service, Consumables & Upgrade Revenues [$M] and AGR [%] – 2011-2020
Table 85 Middle East Secured Facilities ETD Market: Systems Sales, Service, Consumables & Upgrade Revenues [$M] and AGR [%] – 2011-2020
Table 86 Other Applications ETD Market: Systems Sales, Service, Consumables & Upgrade Revenues [$M] and AGR [%] – 2011-2020
Table 87 Number of New Airports – 2000-2020
Table 88 China Air Cargo and Air Passenger Volume
Table 89 China Passenger Screening [M] by 100 Airports
Table 90 China Maritime Industry [$M] – 2010-2013
Table 91 Investments in Developing Chinese Coastal Ports – 1991-2020
Table 92 Metro Upgrade Projects in China Key Cities – 2012-2020
Table 93 China ETD Market [$M] and AGR [%] – 2011-2020
Table 94 China ETD Systems Sales [$M] by Vertical Submarket – 2011-2020
Table 95 China ETD Service, Consumables & Upgrade Revenues [$M] by Vertical Submarket – 2011-2020
Table 96 China ETD Market (Incl. Systems Sales, Service, Consumables & Upgrade) [$M] by Vertical Submarket – 2011-2020
Table 97 China ETD Market: Systems sales, Service, Consumables & Upgrade Revenues, Total Market [$M] and CAGR [%] – 2011-2020
Table 98 China Transportation Security ETD Market: Systems Sales, Service, Consumables & Upgrade Revenues [$M] and AGR [%] – 2011-2020
Table 99 China Secured Facilities ETD Market: Systems Sales, Service, Consumables & Upgrade Revenues [$M] and AGR [%] – 2011-2020
Table 100 China Other Applications ETD Market: Systems Sales, Service, Consumables & Upgrade Revenues [$M] and AGR [%] – 2011-2020
Table 101 Azerbaijan Passenger Screening [M] in Baku Airport
Table 102 Kazakhstan Airport Passengers Screening [M]
Table 103 Pakistan Passenger Screening [M] by 8 Airports
Table 104 India Passenger Screening [M] by 46 Airports – 2013-2014
Table 105 Taiwan Passenger Screening [M] by 6 Airports
Table 106 South Korea Passenger Screening [M] by 13 Airports
Table 107 Japan Passenger Screening [M] by 50 Airports
Table 108 Singapore Passenger Screening [M] – Changi Airport
Table 109 Malaysia Passenger Screening [M] by 18 Airports
Table 110 Indonesia Passenger Screening [M] by 33 Airports
Table 111 Australia Passenger Screening [M] by 20 Airports
Table 112 Asia-Pacific ETD Market [$M] and AGR [%]
Table 113 Asia-Pacific ETD Systems Sales [$M] by Vertical Submarket – 2011-2020
Table 114 Asia-Pacific ETD Service, Consumables & Upgrade Revenues [$M] by Vertical Submarket – 2011-2020
Table 115 Asia-Pacific ETD Market (Incl. Systems Sales, Service, Consumables & Upgrade) [$M] by Vertical Submarket – 2011-2020
Table 116 Asia-Pacific ETD Market: Systems sales, Service, Consumables & Upgrade Revenues, Total Market [$M] and CAGR [%] – 2011-2020
Table 117 Asia-Pacific Transportation Security ETD Market: Systems Sales, Service, Consumables & Upgrade Revenues [$M] and AGR [%] – 2011-2020
Table 118 Asia-Pacific Secured Facilities ETD Market: Systems Sales, Service, Consumables & Upgrade Revenues [$M] and AGR [%] – 2011-2020
Table 119 Asia-Pacific Other Applications ETD Market: Systems Sales, Service, Consumables & Upgrade Revenues [$M] and AGR [%] – 2011-2020
Table 120 Mexico Passenger Screening [M] by 50 Airports
Table 121 Colombia Passenger Screening [M] by 15 Airports
Table 122 Brazil Passenger Screening [M] by 41 Airports
Table 123 Argentina Passenger Screening [M]
Table 124 Latin America ETD Market [$M] and AGR [%] – 2011-2020
Table 125 Latin America ETD Systems Sales [$M] by Vertical Submarket – 2011-2020
Table 126 Latin America ETD Service, Consumables & Upgrade Revenues [$M] by Vertical Submarket – 2011-2020
Table 127 Latin America ETD Market (Incl. Systems Sales, Service, Consumables & Upgrade) [$M] by Vertical Submarket – 2011-2020
Table 128 Latin America ETD Market By: Total Market, Systems Sales, Service, Consumables & Upgrade Revenues and Total Market [$M] – 2011-2020
Table 129 Latin America Transportation Security ETD Market: Systems Sales, Service, Consumables & Upgrade Revenues [$M] and AGR [%] – 2011-2020
Table 130 Latin America Secured Facilities ETD Market: Systems Sales, Service, Consumables & Upgrade Revenues [$M] and AGR [%] – 2011-2020
Table 131 Latin America Other Applications ETD Market: Systems Sales, Service, Consumables & Upgrade Revenues [$M] and AGR [%] – 2011-2020
Table 132 ROW ETD Market [$M] and AGR [%] – 2011-2020
Table 133 ROW ETD Systems Sales [$M] by Vertical Submarket – 2011-2020
Table 134 ROW ETD Service, Consumables & Upgrade Revenues [$M] by Vertical Submarket – 2011-2020
Table 135 ROW ETD Market (Incl. Systems Sales, Service, Consumables & Upgrade) [$M] by Vertical Submarket – 2011-2020
Table 136 ROW ETD Market: Systems Sales, Service, Consumables & Upgrade Revenues, Total Market [$M] and CAGR [%] – 2011-2020
Table 137 ROW Transportation Security ETD Market: Systems Sales, Service, Consumables & Upgrade Revenues [$M] and AGR [%] – 2011-2020
Table 138 ROW Secured Facilities ETD Market: Systems Sales, Service, Consumables & Upgrade Revenues [$M] and AGR [%] – 2011-2020
Table 139 ROW Other Applications ETD Market: Systems Sales, Service, Consumables & Upgrade Revenues [$M] and AGR [%] – 2011-2020
Table 140 ETD Devices Qualified for Screening Operations
Table 141 ETD Devices Conditionally Approved for Screening Operations
Table 142 Autoclear ETD Products
Table 143 Desktop ETD Products by: Vendors, Prices, Technologies, Detection & Capabilities Comparison
Table 144 Colorimetric ETD Products by: Vendors, Prices, Explosives Detection and Technologies
Table 145 Hand-Held ETD: Products, Vendors, Prices, Technologies and Detection
Table 146 ETD Document Scanners: Products, Prices, Technologies & Capabilities Comparison
Table 147 People Screening ETD Portals: Products, Vendors Price Comparison
Table 148 Potential ETD Machines-Equipment Assumptions
Table 149 ETD Geometrical & Power Consumption Specification Characteristics
Table 150 Manufacturer Points of Contact
Table 151 Certified 2D X-ray Devices
Table 152 Certified ETD Devices
Table 153 Certified Tomographic Explosive Detection Systems (EDS)
Table 154 Certified Carbon Dioxide (CO2) Monitors
Table 155 Certified Non-EDS 2D X-ray Devices
Table 156 Certified Electronic Metal Detection (EMD) Devices
Table 157  List of Authorized Air-Cargo on Passenger Plans Screening Facilities

Figures

Figure 1 IATA Outlook of an Airport Passengers Security Screening Infrastructure
Figure 2 ETD Global Market Share [%] by Country/Region – 2013 & 2020
Figure 3 A Multi-lane People Screening Site
Figure 4 Global ETD: Systems Sales, Service, Consumables & Upgrade Revenues and Total Market [$M] – 2011-2020
Figure 5 Global ETD Market (Incl. Systems Sales, Service, Consumables & Upgrade) [$M] by Vertical Submarket – 2011-2020
Figure 6 Global ETD Market (Incl. Systems Sales, Service, Consumables & Upgrade) [$M] by Country/Region – 2011-2020
Figure 7 ETD Global Market Share [%] by Country/Region – 2013 & 2020
Figure 8 International Narcotics Routes.
Figure 9 ETD Market Competitive Analysis
Figure 10 Explosive Materials Classification
Figure 11 The Most Commonly Used Explosives Classification
Figure 12 Canine Team Air Cargo Explosives and Narcotics Screening
Figure 13 Explosives Detection Technologies: Bulk vs. Trace Detection
Figure 14 ETD: Principle of Operation
Figure 15 ETD Operational Workflow
Figure 16 The Airborne Concentration of Military & IED Explosives
Figure 17 Typical Sensitivity of Various ETD Technologies
Figure 18 Free-surface Microfluidic Control of Surface-enhanced Raman Spectroscopy Based ETD
Figure 19 Surface Enhanced Raman Spectroscopy Sysem
Figure 20 Microfluidic Control Surface-Enhanced Raman Spectroscopy Based ETD Process
Figure 21 Falcon First Responder Kit
Figure 22 Cantilever (a) Without Detection. (b) With Detection of Molecules at its Surface
Figure 23 Schematic of Basic Sensor Design.
Figure 24 Schematic Diagram of an ETD Based on a Sensor Array and Neural Network
Figure 25 Non-Contact ETD Explosives and Narcotics Harvesting, Transport, Analysis and Reporting Process
Figure 26 Smiths Detection IONSCAN Document Scanner
Figure 27 Boarding Gate with Build-in ETD Screening Technology
Figure 28 ETD Based Vehicle Screening System
Figure 29 Aviation Cargo and Passengers Growth Rate (CAGR): 2010-2030
Figure 30 ETD People Screening Portals
Figure 31 ETD People Screening Portals – Principle of Operation
Figure 32 Diagram of a Three-Level Checked Baggage Inspection
Figure 33 Schematic Diagram of EDS and ETD Checked Luggage Flow Chart
Figure 34 Standalone EDS and ETD Luggage Screening Configuration
Figure 35 Stand-Alone Table Top ETD Systems Configuration for Small Airports
Figure 36 Flow of Cargo from Shipper to Air Carrier
Figure 37 Global Air Travel Growth -1980-2012
Figure 38 Global Aviation Passengers vs. GDP Annual Growth [%] -1970-2010
Figure 39 Global Air Travel Growth Forecast – 2012-2020
Figure 40 The Global Air Cargo Growth – 1980-2011
Figure 41 Global Air Cargo Traffic Forecast Until 2029
Figure 42 Global ETD: Systems Sales, Service, Consumables & Upgrade Revenues and Total Market [$M] – 2011-2020
Figure 43 Global ETD Systems Sales and Aftersales Revenues Market Share [%]: – 2013 & 2020
Figure 44 Global ETD Market (Incl. Systems Sales, Service, Consumables & Upgrade) [$M] by Vertical Submarket – 2011-2020
Figure 45 Global ETD Systems Sales [$M] by Vertical Submarket – 2011-2020
Figure 46 Global ETD Systems Sales [$M] by: Hand-Held, Desktop & Other ETD Systems – 2011-2020
Figure 47 ETD Cycle [years] and Sub-markets Trends by Customer Sector
Figure 48 Aftersales Revenues Breakdown by: Service Contracts, Time and Materials, Spare Parts and Consumables
Figure 49 Global ETD Aftersales Market [$M] by Vertical Submarket – 2011-2020
Figure 50 Global Transportation Security ETD Systems Sales, Service, Consumables & Upgrade Revenues and Total Market [$M] – 2011-2020
Figure 51 Global Transportation Security ETD Systems Sales and Aftersales Revenues Market Share [%] – 2013 & 2020
Figure 52 Global Secured Facilities ETD Systems Sales, Service, Consumables & Upgrade Revenues and Total Market [$M] – 2011-2020t
Figure 53 Global Secured Facilities ETD Systems Sales and Aftersales Revenues Market Share [%] – 2013 & 2020
Figure 54 Global Other Applications ETD Systems Sales, Service, Consumables & Upgrade Revenues and Total Market [$M] – 2011-2020
Figure 55 Global Other Applications ETD Systems Sales and Aftersale Revenues Market Share [%] – 2013 & 2020
Figure 56 Global ETD Market (Incl. Systems Sales, Service, Consumables & Upgrade) [$M] by Country/Region – 2011-2020
Figure 57 ETD Global Market Share [%] by Country/Region – 2013 & 2020
Figure 58 Global ETD Systems Sales [$M] by Country/Region – 2011-2020
Figure 59 Global ETD Systems Sales Market Shares [%] by Country/Region – 2013 & 2020
Figure 60 Global ETD Service, Consumables & Upgrade Market [$M] by Country/Region – 2011-2020
Figure 61 Global ETD Service, Consumables & Upgrade Market Share [%] by Country/Region – 2013 & 2020
Figure 62 Transportation Systems Sector Government Coordination Organization
Figure 63 Transportation Systems Sector Risk Management Framework
Figure 64 Transportation Systems Industry Management Approach
Figure 65 The Transportation Industry – Government Partnership Model
Figure 66 U.S. ETD Market AGR [%] – 2011-2020
Figure 67 U.S. ETD Systems Sales [$M] by Vertical Submarket – 2011-2020
Figure 68 U.S. ETD Service, Consumables & Upgrade Revenues [$M] by Vertical Submarket – 2011-2020
Figure 69 U.S. ETD Market (Incl. Systems Sales, Service, Consumables & Upgrade) [$M] by Vertical Submarket – 2011-2020
Figure 70 U.S. ETD Market: Systems Sales, Service, Consumables & Upgrade Revenues and Total Market [$M] – 2011-2020
Figure 71 U.S. Transportation Security ETD Market: Systems Sales, Service, Consumables & Upgrade Revenues & Total Market [$M] – 2011-2020
Figure 72 U.S. Secured Facilities ETD Market: Systems Sales, Service, Consumables & Upgrade Revenues and Total Market [$M] – 2011-2020
Figure 73 U.S. Other Applications ETD Market: Systems Sales, Service, Consumables & Upgrade Revenues and Total Market [$M] – 2011-2020
Figure 74 UK Passengers Share [%] by Airports
Figure 75 Europe ETD Market AGR [%] – 2012-2020
Figure 76 Europe ETD Systems Sales [$M] by Vertical Submarket – 2011-2020
Figure 77 Europe ETD Service, Consumables & Upgrade Revenues [$M] by Vertical Submarket – 2011-2020
Figure 78 Europe ETD Market (Incl. Systems Sales, Service, Consumables & Upgrade) [$M] by Vertical Submarket – 2011-2020
Figure 79 Europe ETD Market: Systems Sales, Service, Consumables & Upgrade Revenues and Total Market [$M] – 2011-2020
Figure 80 Transportation Security ETD Market: Systems Sales, Service, Consumables & Upgrade Revenues and Total Market [$M] – 2011-2020
Figure 81 Europe Secured Facilities ETD Market: Systems Sales, Service, Consumables & Upgrade Revenues and Total Market [$M] – 2011-2020
Figure 82 Europe Other Applications ETD Market: Systems Sales, Service, Consumables & Upgrade Revenues and Total Market [$M] – 2011-2020
Figure 83 Saudi Arabia Annual Passengers [M]
Figure 84 Air Passengers [M] to & from Qatar Airports
Figure 85 Middle East ETD Market AGR [%] – 2012-2020
Figure 86 Middle East ETD Systems Sales [$M] by Vertical Submarket – 2011-2020
Figure 87 Middle East ETD Service, Consumables & Upgrade Revenues [$M] by Vertical Submarket – 2011-2020
Figure 88 Middle East ETD Market (Incl. Systems Sales, Service, Consumables & Upgrade) [$M] by Vertical Submarket – 2011-2020
Figure 89 ETD Market: Systems Sales, Service, Consumables & Upgrade Revenues and Total Market [$M] – 2011-2020
Figure 90 Middle East Transportation Security ETD Market: Systems Sales, Service, Consumables & Upgrade Revenues and Total Market [$M] – 2011-2020
Figure 91 Secured Facilities ETD Market: Systems Sales, Service, Consumables & Upgrade Revenues and Total Market [$M] – 2011-2020
Figure 92 Middle East Other Applications ETD Market: Systems Sales, Service, Consumables & Upgrade Revenues and Total Market [$M] – 2011-2020
Figure 93 China Air Traffic Trend: By 2031 China Air Traffic will be 200% of the U.S.A. 2011 Traffic
Figure 94 China ETD Market AGR [%] – 2012-2020
Figure 95 China ETD Systems Sales [$M] by Vertical Submarket – 2011-2020
Figure 96 China ETD Service, Consumables & Upgrade Revenues [$M] by Vertical Submarket – 2011-2020
Figure 97 China ETD Market (Incl. Systems Sales, Service, Consumables & Upgrade) [$M] by Vertical Submarket – 2011-2020
Figure 98 China ETD Market: Systems sales, Service, Consumables & Upgrade Revenues and Total Market [$M] – 2011-2020
Figure 99 China Transportation Security ETD Market: Systems Sales, Service, Consumables & Upgrade Revenues and Total Market [$M] – 2011-2020
Figure 100 China Secured Facilities ETD Market: Systems Sales, Service, Consumables & Upgrade Revenues and Total Market [$M] – 2011-2020
Figure 101 China Other Applications ETD Market: Systems Sales, Service, Consumables & Upgrade Revenues and Total Market [$M] – 2011-2020
Figure 102 Airports Authority of India: FY2006/07 to FY2011/12
Figure 103 Passenger Movements at Changi Airport
Figure 104 Asia-Pacific ETD Market AGR [%] – 2012-2020
Figure 105 Asia-Pacific ETD Systems sales [$M] by Vertical Submarket – 2011-2020
Figure 106 Asia-Pacific ETD Service, Consumables & Upgrade Revenues [$M] by Vertical Submarket – 2011-2020
Figure 107 Asia-Pacific ETD Market (Incl. Systems Sales, Service, Consumables & Upgrade) [$M] by Vertical Submarket – 2011-2020
Figure 108 Asia-Pacific ETD Market: Systems sales, Service, Consumables & Upgrade Revenues and Total Market [$M] – 2011-2020
Figure 109 Asia-Pacific Transportation Security ETD Market: Systems Sales, Service, Consumables & Upgrade Revenues and Total Market [$M] – 2011-2020
Figure 110 Asia-Pacific Secured Facilities ETD Market: Systems Sales, Service, Consumables & Upgrade Revenues and Total Market [$M] – 2011-2020
Figure 111 Asia-Pacific Other Applications ETD Market: Systems Sales, Service, Consumables & Upgrade Revenues and Total Market [$M] – 2011-2020
Figure 112 Air passengers [M] to & from Brazil Airports-2007-2011
Figure 113 Latin America ETD Market AGR [%] – 2012-2020
Figure 114 Latin America ETD Systems Sales [$M] by Vertical Submarket – 2011-2020
Figure 115 Latin America ETD Service, Consumables & Upgrade Revenues [$M] by Vertical Submarket – 2011-2020
Figure 116 Latin America ETD Market (Incl. Systems Sales, Service, Consumables & Upgrade) [$M] by Vertical Submarket – 2011-2020
Figure 117 Latin America ETD Market: Systems Sales, Service, Consumables & Upgrade Revenues and Total Market [$M] – 2011-2020
Figure 118 Latin America Transportation Security ETD Market: Systems Sales, Service, Consumables & Upgrade Revenues and Total Market [$M] – 2011-2020
Figure 119 Latin America Secured Facilities ETD Market: Systems Sales, Service, Consumables & Upgrade Revenues and Total Market [$M] – 2011-2020
Figure 120 Latin America Other Applications ETD Market: Systems Sales, Service, Consumables & Upgrade Revenues and Total Market [$M] – 2011-2020
Figure 121 ROW ETD Market AGR [%] – 2012-2020
Figure 122 ROW ETD Systems Sales [$M] by Vertical Submarket – 2011-2020
Figure 123 ROW ETD Service, Consumables & Upgrade Revenues [$M] by Vertical Submarket – 2011-2020
Figure 124 ROW ETD Market (Incl. Systems Sales, Service, Consumables & Upgrade) [$M] by Vertical Submarket – 2011-2020
Figure 125 ROW ETD Market: Systems Sales, Service, Consumables & Upgrade Revenues and Total Market [$M] – 2011-2020
Figure 126 ROW Transportation Security ETD Market: Systems Sales, Service, Consumables & Upgrade Revenues and Total Market [$M] – 2011-2020
Figure 127 ROW Secured Facilities ETD Market: Systems Sales, Service, Consumables & Upgrade Revenues and Total Market [$M] – 2011-2020
Figure 128 ROW Other Applications ETD Market: Systems Sales, Service, Consumables & Upgrade Revenues and Total Market [$M] – 2011-2020
Figure 129 The ETD Performance Criteria
Figure 130 Ex-Detect Model XD-2 Kit
Figure 131 Checked Luggage ETD-EDS Screening Configuration – 1
Figure 132 Checked Luggage ETD-EDS Screening Configuration – 2
Figure 133 Schematic Visualization of a Mini in-Line System
Figure 134 Checked Luggage ETD-EDS Screening Configuration – 3 Mini In-Line System with Light Integration
Figure 135 Checked Luggage ETD-EDS Screening Configuration – Stand-Alone EDS
Figure 136 Stand-Alone Checked Luggage ETD System
Figure 137  Airport Explosives Threats Vectors

Questions about this report?

Contact Sales: 1-571-527-1010 or Analysts: 1-202-455-0966

  • Have a question about Explosives & Narcotics Trace Detection (ETD) Market & Technologies - 2015-2020
    Please fill out all fields in the form below and click "Submit" to send your question.
    Our representative will review your question and contact you with an answer as soon as possible.
  • 2+2=
  • This field is for validation purposes and should be left unchanged.
1
Interested in this report? Need more information?
X
Powered By