Download TOC as PDFVolume 1
Table of Contents
1 Executive Summary………………………………………………. 12
1.1 Key Findings & Conclusions……………………………….. 12
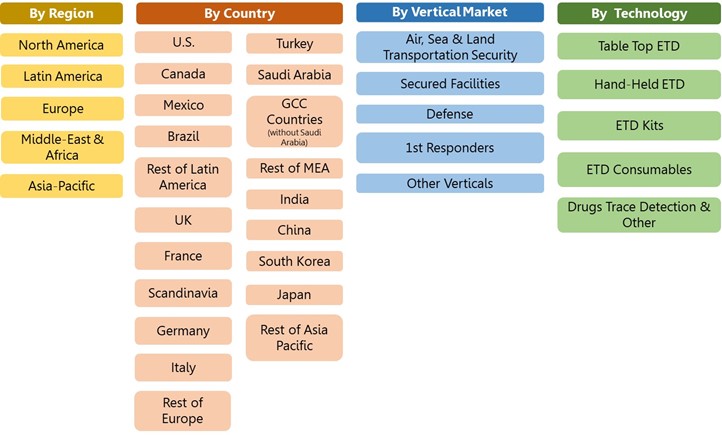
1.2 Global ETD Market Research Vectors…………………… 25
1.3 Global Explosives Trace Detection (ETD) Market – 2019-2026………………………………………………………. 25
1.3.1 Technology Explosives Trace Detection (ETD) Markets…………………………………………………….. 26
1.3.2 Explosives Trace Detection (ETD) Market by Vertical Market……………………………………………………… 27
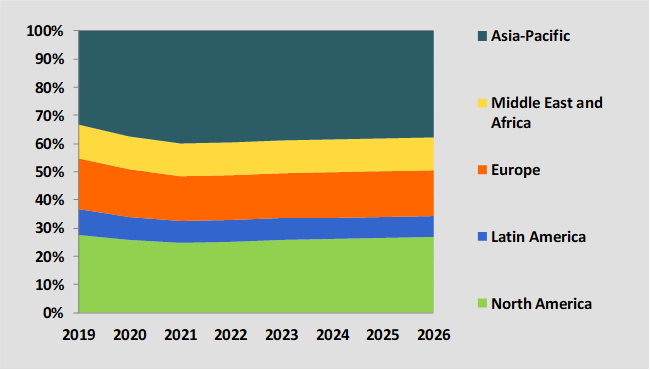
1.3.3 Regional Explosives Trace Detection (ETD) Markets………………………………………………………………. 28
1.3.4 National Explosives Trace Detection (ETD) Markets………………………………………………………………. 29
2 COVID-19 Impact on the ETD Market………………………… 31
3 ETD Market Drivers……………………………………………….. 32
4 ETD Market Inhibitors……………………………………………. 34
5 ETD Market SWOT Analysis……………………………………. 36
5.1 Strengths……………………………………………………….. 36
5.2 Weaknesses…………………………………………………… 37
5.3 Opportunities…………………………………………………… 38
5.4 Threats………………………………………………………….. 39
6 Competitive Analysis: Market Barriers to New Entry, Supplier Power, Buyer Power, Barriers to Substitution and Competitive Rivalry…………………………………………. 41
7 ETD Industry Value Chain………………………………………. 43
7.1 Background…………………………………………………….. 43
7.2 The ETD Industry Primary Activities……………………… 44
7.3 Support Activities……………………………………………… 44
TECHNOLOGY MARKETS……………………………………………… 45
8 Global Explosives Trace Detection (ETD) Technology Markets……………………………………………………………….. 45
8.1 Explosives Trace Detection (ETD) Market Size by Technology– 2019-2026…………………………………….. 45
8.2 Explosives Trace Detection (ETD) Market Dynamics – 2019-2026………………………………………………………. 46
8.3 Global Market Breakdown – 2019-2026………………… 47
9 Table Top ETD Market – 2019-2026………………………….. 48
9.1 Tabletop ETD Market Background……………………….. 48
9.1.1 Introduction……………………………………………….. 48
9.1.2 Tabletop ETD Consumables Vendors……………… 50
9.2 Table Top ETD Market – 2019-2026…………………….. 51
9.3 Table Top ETD Market Dynamics – 2019-2026………. 52
9.4 Table Top ETD Market Share – 2019-2026……………. 52
10 Hand-Held ETD Market – 2019-2026…………………………. 54
10.1 Hand-Held ETD Market Background…………………….. 54
10.2 Hand-Held ETD Market Size – 2019-2026……………… 56
10.3 Hand-Held ETD Market Dynamics – 2019-2026………. 57
10.4 Hand-Held ETD Market Share – 2019-2026…………… 58
11 ETD Kits Market – 2019-2026…………………………………… 59
11.1 ETD Kits Market Background………………………………. 59
11.2 ETD Kits Market Size – 2019-2026………………………. 59
11.3 ETD Kits Market Dynamics – 2019-2026……………….. 60
11.4 ETD Kits Market Share – 2019-2026…………………….. 61
12 ETD Consumables Market – 2019-2026…………………….. 62
12.1 ETD Consumables Market Size – 2019-2026…………. 62
12.2 ETD Consumables Market Dynamics – 2019-2026….. 62
12.3 ETD Consumables Market Share – 2019-2026……….. 63
13 Drugs Trace Detection & Other Technologies Market – 2019-2026…………………………………………………………….. 64
13.1 Drugs Trace Detection & Other Technologies Market Size – 2019-2026…………………………………………….. 64
13.2 Drugs Trace Detection & Other Technologies Market Dynamics – 2019-2026……………………………………… 65
13.3 Drugs Trace Detection & Other Technologies Market Share – 2019-2026…………………………………………… 65
VERTICAL MARKETS……………………………………………………. 66
14 Global Explosives Trace Detection Vertical Markets…… 66
14.1 Explosives Trace Detection Vertical Markets Size – 2019-2026………………………………………………………. 66
14.2 Explosives Trace Detection Vertical Markets Dynamics – 2019-2026………………………………………………………. 67
14.3 Global Explosives Trace Detection Vertical Markets Breakdown – 2019-2026……………………………………. 68
15 Air, Sea & Land Transportation Security Explosives Trace Detection Market – 2019-2026………………………… 69
15.1 Air, Sea & Land Transportation Security Market Size – 2019-2026………………………………………………………. 69
15.2 Air, Sea & Land Transportation Security Explosives Trace Detection Market Dynamics – 2019-2026………. 70
15.3 Air, Sea & Land Transportation Security Market Share – 2019-2026………………………………………………………. 70
16 Secured Facilities Explosives Trace Detection Market – 2019-2026…………………………………………………………….. 71
16.1 Secured Facilities Market Size – 2019-2026…………… 71
16.2 Secured Facilities Explosives Trace Detection Market Dynamics – 2019-2026……………………………………… 72
16.3 Secured Facilities Market Share – 2019-2026…………. 72
17 Defense Explosives Trace Detection Market – 2019-2026 73
17.1 Defense Market Size – 2019-2026……………………….. 73
17.2 Defense Explosives Trace Detection Market Dynamics – 2019-2026………………………………………………………. 74
17.3 Defense Market Share – 2019-2026…………………….. 74
18 1st Responders Explosives Trace Detection Market – 2019-2026…………………………………………………………….. 75
18.1 1st Responders Market Size – 2019-2026……………… 75
18.2 1st Responders Explosives Trace Detection Market Dynamics – 2019-2026……………………………………… 76
18.3 1st Responders Market Share – 2019-2026…………… 76
19 Other Vertical Explosives Trace Detection Markets – 2019-2026…………………………………………………………….. 77
19.1 Other Vertical Markets Size – 2019-2026………………. 77
19.2 Other Vertical Explosives Trace Detection Markets Dynamics – 2019-2026……………………………………… 78
19.3 Other Vertical Markets Share – 2019-2026…………….. 78
REGIONAL MARKETS…………………………………………………… 79
20 Regional Explosives Trace Detection Markets…………… 79
20.1 Regional Markets – 2019-2026……………………………. 79
20.2 Regional Explosives Trace Detection Markets Dynamics – 2019-2026……………………………………………………. 80
20.3 Global Market Share by Region – 2019-2026…………. 81
21 North America Explosives Trace Detection Market…….. 82
21.1 North America Market – 2019-2026……………………… 82
21.2 North America Explosives Trace Detection Market Dynamics – 2019-2026……………………………………… 83
21.3 North America Market Share – 2019-2026……………… 83
22 Latin America Explosives Trace Detection Market……… 84
22.1 Latin America Market – 2019-2026………………………. 84
22.2 Latin America Explosives Trace Detection Market Dynamics – 2019-2026……………………………………… 85
22.3 Latin America Market Share – 2019-2026……………… 85
23 Europe Explosives Trace Detection Market………………. 86
23.1 Europe Market – 2019-2026……………………………….. 86
23.2 Europe Explosives Trace Detection Market Dynamics – 2019-2026………………………………………………………. 87
23.3 Europe Market Share – 2019-2026………………………. 87
24 Middle East & Africa Explosives Trace Detection Market 88
24.1 Middle East & Africa Market – 2019-2026………………. 88
24.2 Middle East & Africa Explosives Trace Detection Market Dynamics – 2019-2026……………………………………… 89
24.3 Middle East & Africa Market Share – 2019-2026……… 89
25 Asia Pacific Explosives Trace Detection Market………… 90
25.1 Asia Pacific Market – 2019-2026…………………………. 90
25.2 Asia Pacific Explosives Trace Detection Market Dynamics – 2019-2026……………………………………… 91
25.3 Asia Pacific Market Share – 2019-2026…………………. 91
Volume 2
NATIONAL MARKETS…………………………………………………… 12
1 Global Explosives Trace Detection (ETD) Market by Country……………………………………………………………….. 12
1.1 Explosives Trace Detection (ETD) Market Size by Country– 2019-2026…………………………………………. 12
1.2 National Explosives Trace Detection (ETD) Markets Dynamics – 2019-2026……………………………………… 14
1.3 Global Market Breakdown by Country – 2019-2026…. 15
2 U.S. Explosives Trace Detection (ETD) Market – 2019-2026……………………………………………………………………. 17
2.1 U.S. Market Background……………………………………. 17
2.2 U.S. Market Size – 2019-2026…………………………….. 17
2.3 U.S. Explosives Trace Detection (ETD) Market Dynamics – 2019-2026……………………………………… 18
2.4 U.S. Market Share – 2019-2026………………………….. 18
3 Canada Explosives Trace Detection (ETD) Market – 2019-2026……………………………………………………………………. 19
3.1 Canada Market Background……………………………….. 19
3.2 Canada Market Size – 2019-2026………………………… 19
3.3 Canada Explosives Trace Detection (ETD) Market Dynamics – 2019-2026……………………………………… 20
3.4 Canada Market Share – 2019-2026……………………… 20
4 Mexico Explosives Trace Detection (ETD) Market – 2019-2026……………………………………………………………………. 21
4.1 Mexico Market Background………………………………… 21
4.2 Mexico Market Size – 2019-2026…………………………. 21
4.3 Mexico Explosives Trace Detection (ETD) Market Dynamics – 2019-2026……………………………………… 22
4.4 Mexico Market Share – 2019-2026………………………. 22
5 Brazil Explosives Trace Detection (ETD) Market – 2019-2026……………………………………………………………………. 23
5.1 Brazil Market Background………………………………….. 23
5.2 Brazil Market Size – 2019-2026…………………………… 23
5.3 Brazil Explosives Trace Detection (ETD) Market Dynamics – 2019-2026……………………………………… 24
5.4 Brazil Market Share – 2019-2026…………………………. 24
6 Rest of Latin America Explosives Trace Detection (ETD) Market – 2019-2026……………………………………………….. 25
6.1 Rest of Latin America Market Background……………… 25
6.2 Rest of Latin America Market Size – 2019-2026……… 25
6.3 Rest of Latin America Explosives Trace Detection (ETD) Market Dynamics – 2019-2026……………………………. 26
6.4 Rest of Latin America Market Share – 2019-2026……. 26
7 UK Explosives Trace Detection (ETD) Market – 2019-2026 27
7.1 UK Market Background……………………………………… 27
7.2 UK Market Size – 2019-2026………………………………. 27
7.3 UK Explosives Trace Detection (ETD) Market Dynamics – 2019-2026……………………………………………………. 28
7.4 UK Market Share – 2019-2026……………………………. 28
8 France Explosives Trace Detection (ETD) Market – 2019-2026……………………………………………………………………. 29
8.1 France Market Background………………………………… 29
8.2 France Market Size – 2019-2026…………………………. 29
8.3 France Explosives Trace Detection (ETD) Market Dynamics – 2019-2026……………………………………… 30
8.4 France Market Share – 2019-2026………………………. 30
9 Scandinavian Countries Explosives Trace Detection (ETD) Market – 2019-2026……………………………………….. 31
9.1 Scandinavian Countries Market Background………….. 31
9.2 Scandinavian Countries Market Size – 2019-2026…… 31
9.3 Scandinavian Countries Explosives Trace Detection (ETD) Market Dynamics – 2019-2026…………………… 32
9.4 Scandinavian Countries Market Share – 2019-2026…. 32
10 Germany Explosives Trace Detection (ETD) Market – 2019-2026…………………………………………………………….. 33
10.1 Germany Market Background……………………………… 33
10.2 Germany Market Size – 2019-2026………………………. 33
10.3 Germany Explosives Trace Detection (ETD) Market Dynamics – 2019-2026……………………………………… 34
10.4 Germany Market Share – 2019-2026……………………. 34
11 Italy Explosives Trace Detection (ETD) Market – 2019-2026……………………………………………………………………. 35
11.1 Italy Market Background…………………………………….. 35
11.2 Italy Market Size – 2019-2026…………………………….. 35
11.3 Italy Explosives Trace Detection (ETD) Market Dynamics – 2019-2026……………………………………… 36
11.4 Italy Market Share – 2019-2026…………………………… 36
12 Rest of Europe Explosives Trace Detection (ETD) Market – 2019-2026………………………………………………………….. 37
12.1 Rest of Europe Market Background……………………… 37
12.2 Rest of Europe Market Size – 2019-2026………………. 37
12.3 Rest of Europe Explosives Trace Detection (ETD) Market Dynamics – 2019-2026……………………………. 38
12.4 Rest of Europe Market Share – 2019-2026…………….. 38
13 Turkey Explosives Trace Detection (ETD) Market – 2019-2026……………………………………………………………………. 39
13.1 Turkey Market Background………………………………… 39
13.2 Turkey Market Size – 2019-2026…………………………. 39
13.3 Turkey Explosives Trace Detection (ETD) Market Dynamics – 2019-2026……………………………………… 40
13.4 Turkey Market Share – 2019-2026……………………….. 40
14 Saudi Arabia Explosives Trace Detection (ETD) Market – 2019-2026…………………………………………………………….. 41
14.1 Saudi Arabia Market Background…………………………. 41
14.2 Saudi Arabia Market Size – 2019-2026…………………. 41
14.3 Saudi Arabia Explosives Trace Detection (ETD) Market Dynamics – 2019-2026……………………………………… 42
14.4 Saudi Arabia Market Share – 2019-2026……………….. 42
15 GCC Countries* Explosives Trace Detection (ETD) Market – 2019-2026………………………………………………………….. 43
15.1 GCC Countries* Market Background…………………….. 43
15.2 GCC Countries* Market Size – 2019-2026…………….. 43
15.3 GCC Countries* Explosives Trace Detection (ETD) Market Dynamics – 2019-2026……………………………. 44
15.4 GCC Countries* Market Share – 2019-2026…………… 44
16 Rest of MEA Explosives Trace Detection (ETD) Market – 2019-2026…………………………………………………………….. 45
16.1 Rest of MEA Market Background…………………………. 45
16.2 Rest of MEA Market Size – 2019-2026………………….. 45
16.3 Rest of MEA Explosives Trace Detection (ETD) Market Dynamics – 2019-2026……………………………………… 46
16.4 Rest of MEA Market Share – 2019-2026……………….. 46
17 India Explosives Trace Detection (ETD) Market – 2019-2026……………………………………………………………………. 47
17.1 India Market Background…………………………………… 47
17.2 India Market Size – 2019-2026……………………………. 47
17.3 India Explosives Trace Detection (ETD) Market Dynamics – 2019-2026……………………………………… 48
17.4 India Market Share – 2019-2026………………………….. 48
18 China Explosives Trace Detection (ETD) Market – 2019-2026……………………………………………………………………. 49
18.1 China Market Background………………………………….. 49
18.2 China Market Size – 2019-2026…………………………… 49
18.3 China Explosives Trace Detection (ETD) Market Dynamics – 2019-2026……………………………………… 50
18.4 China Market Share – 2019-2026………………………… 50
19 South Korea Explosives Trace Detection (ETD) Market – 2019-2026…………………………………………………………….. 51
19.1 South Korea Market Background…………………………. 51
19.2 South Korea Market Size – 2019-2026………………….. 51
19.3 South Korea Explosives Trace Detection (ETD) Market Dynamics – 2019-2026……………………………………… 52
19.4 South Korea Market Share – 2019-2026……………….. 52
20 Japan Explosives Trace Detection (ETD) Market – 2019-2026……………………………………………………………………. 53
20.1 Japan Market Background………………………………….. 53
20.2 Japan Market Size – 2019-2026………………………….. 53
20.3 Japan Explosives Trace Detection (ETD) Market Dynamics – 2019-2026……………………………………… 54
20.4 Japan Market Share – 2019-2026………………………… 54
21 Rest of Asia Pacific Explosives Trace Detection (ETD) Market – 2019-2026……………………………………………….. 55
21.1 Rest of Asia Pacific Market Background………………… 55
21.2 Rest of Asia Pacific Market Size – 2019-2026…………. 55
21.3 Rest of Asia Pacific Explosives Trace Detection (ETD) Market Dynamics – 2019-2026……………………………. 56
21.4 Rest of Asia Pacific Market Share – 2019-2026………. 56
Volume 3
VENDORS…………………………………………………………………… 16
- Key Vendors………………………………………………………… 16
1.1. Contact Information………………………………………….. 16
1.2. 908 Devices……………………………………………………. 17
1.2.1. Company Profile…………………………………………. 17
1.2.2. Explosives Trace Detection Products………………. 17
1.2.3. Contact Info………………………………………………. 18
1.3. Airsense Analytics……………………………………………. 19
1.3.1. Company Profile…………………………………………. 19
1.3.2. Explosives Trace Detection Products………………. 19
1.3.3. Contact Info………………………………………………. 20
1.4. Auto Clear………………………………………………………. 21
1.4.1. Company Profile…………………………………………. 21
1.4.2. Explosives Trace Detection Products………………. 22
1.4.3. Contact Info………………………………………………. 25
1.5. Astrotech Corporation……………………………………….. 26
1.5.1. Company Profile…………………………………………. 26
1.5.2. Explosives Trace Detection Products………………. 27
1.5.3. Contact Info………………………………………………. 27
1.6. Biosensor Applications AB…………………………………. 27
1.6.1. Company Profile…………………………………………. 28
1.6.2. Explosives Trace Detection Products………………. 28
1.6.3. Contact Info………………………………………………. 29
1.7. Bruker Detection………………………………………………. 29
1.7.1. Company Profile…………………………………………. 29
1.7.2. Explosives Trace Detection Products………………. 30
1.7.3. Contact Info………………………………………………. 31
1.8. Chemring Group………………………………………………. 31
1.8.1. Company Profile…………………………………………. 31
1.8.2. Explosives Trace Detection Products………………. 32
1.8.3. Contact Info………………………………………………. 32
1.9. DetectaChem LLC……………………………………………. 33
1.9.1. Company Info…………………………………………….. 33
1.9.2. Explosives Trace Detection Products………………. 33
1.9.3. Contact Info………………………………………………. 35
1.10. Electronics Sensor Technology……………………………. 35
1.10.1. Company Profile…………………………………………. 35
1.10.2. Explosives Trace Detection Products………………. 36
1.10.3. Contact Info………………………………………………. 36
1.11. FLIR (Teledyne FLIR LLC)…………………………………. 37
1.11.1. Company Profile…………………………………………. 37
1.11.2. Explosives Trace Detection Products………………. 38
1.11.3. Contact Info………………………………………………. 41
1.12. GreyScan Australia Pty Ltd………………………………… 42
1.12.1. Company Profile…………………………………………. 42
1.12.2. Explosives Trace Detection Products………………. 43
1.12.3. Contact Info………………………………………………. 43
1.13. Hitachi…………………………………………………………… 44
1.13.1. Company Profile…………………………………………. 44
1.13.2. Explosives Trace Detection Products………………. 44
1.13.3. Contact Info………………………………………………. 45
1.14. Inward Detection………………………………………………. 46
1.14.1. Company Profile…………………………………………. 46
1.14.2. Explosives Trace Detection Products………………. 46
1.14.3. Contact Info………………………………………………. 46
1.15. Leidos LLC……………………………………………………… 47
1.15.1. Company Profile…………………………………………. 47
1.15.2. Explosives Trace Detection Products………………. 48
1.15.3. Contact Info………………………………………………. 49
1.16. Mistral Security Inc…………………………………………… 50
1.16.1. Company Profile…………………………………………. 50
1.16.2. Explosives Trace Detection Products………………. 50
1.16.3. Contact Info………………………………………………. 51
1.17. MS Technologies Inc………………………………………… 51
1.17.1. Company Profile…………………………………………. 51
1.17.2. Explosives Trace Detection Products………………. 51
1.17.3. Contact Info………………………………………………. 53
1.18. Nuctech Co. Ltd……………………………………………….. 54
1.18.1. Company Profile…………………………………………. 54
1.18.2. Explosives Trace Detection Products………………. 54
1.18.3. Contact Info………………………………………………. 54
1.19. OSI Systems, Inc……………………………………………… 55
1.19.1. Company Profile…………………………………………. 55
1.19.2. Explosives Trace Detection Products………………. 55
1.19.3. Contact Info………………………………………………. 55
1.20. Rapiscan Systems, Inc. (OSI)……………………………… 56
1.20.1. Company Profile…………………………………………. 56
1.20.2. Explosives Trace Detection Products………………. 56
1.20.3. Contact Info………………………………………………. 58
1.21. Red X Defense………………………………………………… 59
1.21.1. Company Profile…………………………………………. 59
1.21.2. Explosives Trace Detection Products………………. 59
1.21.3. Contact Info………………………………………………. 60
1.22. Rs Dynamics…………………………………………………… 60
1.22.1. Company Profile…………………………………………. 60
1.22.2. Explosives Trace Detection Products………………. 61
1.22.3. Contact Info………………………………………………. 62
1.23. Scanna MSC Ltd……………………………………………… 63
1.23.1. Company Profile…………………………………………. 63
1.23.2. Explosives Trace Detection Products………………. 63
1.23.3. Contact Info………………………………………………. 64
1.24. Scent Detection Technologies…………………………….. 65
1.24.1. Company Profile…………………………………………. 65
1.24.2. Explosives Trace Detection Products………………. 65
1.24.3. Contact Info………………………………………………. 65
1.25. Scintrex Trace…………………………………………………. 66
1.25.1. Company Profile…………………………………………. 66
1.25.2. Explosives Trace Detection Products………………. 67
1.25.3. Contact Info………………………………………………. 69
1.26. Sibel Ltd…………………………………………………………. 69
1.26.1. Company Profile…………………………………………. 69
1.26.2. ETD Screening Products………………………………. 70
1.26.3. Contact Info………………………………………………. 70
1.27. Smiths Detection Inc…………………………………………. 71
1.27.1. Company Profile…………………………………………. 71
1.27.2. Explosives Trace Detection Products………………. 72
1.27.3. Contact Info………………………………………………. 74
1.28. Syagen Technology………………………………………….. 74
1.28.1. Company Profile…………………………………………. 74
1.28.2. Explosives Trace Detection Products………………. 75
1.28.3. Contact Info………………………………………………. 75
1.29. Thermo Fisher Scientific Inc……………………………….. 76
1.29.1. Company Profile…………………………………………. 76
1.29.2. Explosives Trace Detection Products………………. 77
1.29.3. Contact Info………………………………………………. 77
1.30. Westminster International Ltd……………………………… 78
1.30.1. Company Profile…………………………………………. 78
1.30.2. Explosives Trace Detection Products………………. 78
1.30.3. Contact Info………………………………………………. 79
APPENDICES………………………………………………………………. 80
Appendix A: National Markets Background……………………… 80
North America……………………………………………………………… 80
- U.S. Market…………………………………………………………… 80
2.1. U.S. Public Safety & Homeland Security: Introduction. 80
2.2. U.S. Federal Homeland Security Related Organizations 83
2.2.1. Department of Homeland Security (DHS)…………. 84
2.2.2. Department of Homeland Security: Agencies and Units………………………………………………………… 85
2.2.3. DHS – Transportation Security Administration (TSA)………………………………………………………………. 88
2.2.4. DHS – U.S. Customs & Border Protection (CBP).. 90
2.2.5. DHS – Federal Emergency Management Agency (FEMA)…………………………………………………….. 90
2.2.6. DHS – U.S. Immigration & Customs Enforcement (ICE)………………………………………………………… 91
2.2.7. DHS – U.S. Coast Guard (USCG)…………………… 91
2.2.8. U.S. Secret Service (USSS)………………………….. 92
2.2.9. DHS – Science & Technology Directorate (S&T)… 92
2.2.10. DHS – Domestic Nuclear Detection Office (DNDO)………………………………………………………………. 93
2.2.11. DHS – U.S. Citizenship & Immigration Services (USCIS)……………………………………………………. 94
2.2.12. DHS – National Protection and Programs Directorate (NPPD)……………………………………… 95
2.2.13. Department of Defense (DOD)………………………. 96
2.2.14. Department of Justice (DOJ)…………………………. 96
2.2.15. Federal Bureau of Investigation (FBI)………………. 99
2.3. U.S. Police Forces………………………………………….. 100
2.4. U.S. Airports Security Statistics………………………….. 100
2.4.1. Air Passengers Checkpoint CCTV Support Program……………………………………………………………… 107
2.4.2. CCTV Assisted Secure Flight Program…………… 108
2.5. U.S. Land Border Security………………………………… 109
2.5.1. Introduction……………………………………………… 109
2.5.2. U.S. Land Border Security Components…………. 110
2.6. U.S. Critical Infrastructure Security……………………… 111
2.6.1. Major Findings………………………………………….. 111
2.6.2. Critical Infrastructure Security Tactics……………. 114
2.6.3. Critical Infrastructure Vulnerabilities………………. 115
2.6.4. Planning of Infrastructure Security………………… 116
2.7. U.S. Maritime Security……………………………………… 116
2.7.1. Major Findings & Conclusions……………………… 116
2.7.2. Maritime Security Infrastructure……………………. 118
2.7.3. Port Critical Infrastructure Operations……………. 120
2.7.4. The Container Security Initiative (CSI)……………. 121
2.8. U.S. Land Transportation Security……………………… 122
2.8.1. Scope…………………………………………………….. 122
2.8.2. Land Transportation Security: Background……… 123
2.8.3. Mass Transit Security………………………………… 124
2.9. U.S. Energy Sector Security……………………………… 124
2.9.1. Scope…………………………………………………….. 124
2.9.2. U.S. Energy Sector Security: Background………. 125
2.10. U.S. Public Events Security………………………………. 126
2.10.1. Scope…………………………………………………….. 126
2.10.2. U.S. Natural & Manmade Disaster Mitigation…… 127
- Canada Market……………………………………………………. 129
3.1. Canada Market Background……………………………… 129
3.1.1. Canada Geopolitical Overview……………………… 129
3.1.2. Crime in Canada……………………………………….. 129
3.1.3. Canada’s Counter Terror & Law Enforcement Legislation……………………………………………….. 130
3.1.4. Canada’s Homeland Security & Public Safety Agencies…………………………………………………. 131
3.1.5. Canada’s Police Forces……………………………… 131
3.1.6. Canada’s Security Intelligence Services…………. 132
3.1.7. Canada’s Defense Forces…………………………… 132
3.1.8. Canada: Airport Security Statistics………………… 133
3.1.9. Canada Border Security……………………………… 134
Latin America…………………………………………………………….. 136
- Mexico Market…………………………………………………….. 136
4.1. Mexico Market Background………………………………. 136
4.1.1. Mexico Geopolitical Overview………………………. 136
4.1.2. Mexico Homeland Security & Public Safety Industry……………………………………………………………… 136
4.1.3. Crime in Mexico………………………………………… 140
4.1.4. Mexico’s Counter Terror Legislation & Law Enforcement…………………………………………….. 141
4.1.5. Mexico’s Homeland Security & Public Safety Agencies…………………………………………………. 142
4.1.6. Mexico’s Police Forces………………………………. 143
4.1.7. Mexico’s Intelligence Services……………………… 144
4.1.7.1. Center for Research and National Security…… 144
4.1.7.2. Secretariat of National Defense………………….. 144
4.1.8. Mexico’s Defense Forces……………………………. 144
4.1.9. Mexico: Safe City Projects…………………………… 145
4.1.9.1. Mexico’s Urban Crime and Insurgency………… 145
4.1.9.2. Security Policy……………………………………….. 146
4.1.10. Mexico: Airport Security Statistics…………………. 147
- Brazil Market………………………………………………………. 149
5.1. Brazil Market Background…………………………………. 149
5.1.1. Brazil Geopolitical Overview………………………… 149
5.1.2. Brazil Homeland Security & Public Safety Industry……………………………………………………………… 151
5.1.3. Crime in Brazil………………………………………….. 152
5.1.4. Terror in Brazil………………………………………….. 153
5.1.5. Brazil’s Counter Terror Legislation & Law Enforcement…………………………………………….. 153
5.1.6. Brazil’s Homeland Security & Public Safety Agencies…………………………………………………. 153
5.1.7. Brazil’s Police Forces…………………………………. 154
5.1.8. Brazil’s Intelligence Services……………………….. 154
5.1.8.1. ABIN……………………………………………………. 154
5.1.9. Brazil’s Defense Forces……………………………… 155
5.1.10. Brazil: Safe City Projects…………………………….. 156
5.1.11. Brazil: Airport Security Statistics…………………… 157
5.1.12. Brazil Border Security………………………………… 158
Europe……………………………………………………………………… 160
- UK Market…………………………………………………………… 160
6.1. UK Market Background……………………………………. 160
6.1.1. UK Geopolitical Overview……………………………. 160
6.1.2. The Brexit Effects……………………………………… 160
6.1.3. UK Homeland Security & Public Safety: Market Background……………………………………………… 161
6.1.4. UK National Security Risk Assessment………….. 163
6.1.5. Crime in the UK………………………………………… 165
6.1.6. Terror in the UK………………………………………… 165
6.1.6.1. UK Homeland Security and Public Safety Strategy…………………………………………………………… 166
6.1.6.2. Countering Terrorism Financing…………………. 167
6.1.6.3. UK Intelligence Agencies Funding………………. 168
6.1.7. The UK Homeland Security & Public Safety Agencies…………………………………………………. 169
6.1.8. The UK Police Forces………………………………… 169
6.1.9. UK Intelligence Services…………………………….. 171
6.1.9.1. Security Service – MI5……………………………… 171
6.1.9.2. National Domestic Extremism & Disorder Intelligence Unit (NDEDIU)……………………….. 172
6.1.9.3. National Crime Agency (NCA)……………………. 172
6.1.9.4. National Ballistics Intelligence Service (NABIS) 172
6.1.9.5. National Fraud Intelligence Bureau (NFIB)……. 172
6.1.9.6. MI6, Secret Intelligence Service…………………. 173
6.1.9.7. Defense Intelligence (DI)………………………….. 173
6.1.9.8. Government Communications Headquarters (GCHQ)………………………………………………… 173
6.1.9.9. The Joint Intelligence Organization……………… 174
6.1.9.10. The Parliament Intelligence and Security Committee…………………………………………….. 175
6.1.9.11. National Security Secretariat (NSS)…………….. 175
6.1.9.12. Office for Security and Counter-Terrorism (OSCT)…………………………………………………………… 175
6.1.9.13. UK Intelligence Agencies Budgets………………. 175
6.1.10. UK Defense Forces…………………………………… 175
6.1.11. UK: Safe City Projects………………………………… 176
6.1.11.1. Urban Security……………………………………….. 176
6.1.11.2. UK Security Policy…………………………………… 177
6.1.11.3. Urban Crime Data…………………………………… 177
6.1.11.4. UK Safe City Projects: Introduction……………… 178
6.1.12. UK: Airport Security Statistics………………………. 178
6.1.13. UK Border Security……………………………………. 179
6.1.13.1. Overview………………………………………………. 179
6.1.13.2. UK Home Office Border Force……………………. 180
6.1.13.3. The UK Immigration Legislation…………………. 181
- Germany Market………………………………………………….. 182
7.1. Germany Market Background……………………………. 182
7.1.1. Germany Geopolitical Overview……………………. 182
7.1.2. Germany: Economy, Immigration & Terror………. 182
7.1.3. Germany Homeland Security & Public Safety Industry…………………………………………………… 185
7.1.4. Crime in Germany…………………………………….. 185
7.1.5. Terror in Germany…………………………………….. 186
7.1.6. Germany’s Counter Terror Legislation & Law Enforcement…………………………………………….. 186
7.1.6.1. Germany Approach to Homeland Security and Public Safety………………………………………….. 188
7.1.7. Germany’s Homeland Security & Public Safety Agencies…………………………………………………. 189
7.1.8. Germany’s Police Forces……………………………. 190
7.1.8.1. BPOL – Federal Police……………………………… 190
7.1.8.2. GSG 9 – Special Operations & Counterterrorism Unit……………………………………………………… 190
7.1.8.3. ASSIK – Special Task Force Protection in Crisis Areas…………………………………………………… 191
7.1.8.4. ZKA – Customs Investigation Bureau…………… 191
7.1.8.5. ZUZ – Customs SWAT Unit……………………….. 191
7.1.8.6. Military Police…………………………………………. 192
7.1.8.7. State Police Forces…………………………………. 192
7.1.8.8. SEK – State Special Operations Command Part of Uniformed Police…………………………………….. 192
7.1.8.9. MEK – Mobile Task Force units, Part of Criminal Police…………………………………………………… 193
7.1.9. Germany’s Intelligence Services…………………… 193
7.1.9.1. Federal Intelligence Service (BND)……………… 193
7.1.9.2. Federal Office for the Protection of the Constitution (BfV)……………………………………. 194
7.1.9.3. Military Counterintelligence Service (MAD)…… 194
7.1.9.4. The State Office for the Protection of the Constitution…………………………………………… 195
7.1.10. Germany’s Defense Forces…………………………. 195
7.1.11. Germany’s Safe City………………………………….. 195
7.1.11.1. Urban Crime in Germany………………………….. 195
7.1.11.2. Germany: Safe City Projects……………………… 196
7.1.11.3. Safe City Project in Stuttgart……………………… 197
7.1.11.4. German Safe City Market Eco-System………… 197
7.1.12. Germany: Airport Security Statistics………………. 199
7.1.13. Germany Border Security……………………………. 200
7.1.13.1. German E-Passport…………………………………. 201
7.1.13.2. Automated Border Control (ABC) Gates………. 201
- France Market…………………………………………………….. 204
8.1. France Market Background………………………………. 204
8.1.1. France Geopolitical Overview………………………. 204
8.1.2. France Homeland Security & Public Safety Industry……………………………………………………………… 204
8.1.3. Crime in France………………………………………… 205
8.1.4. Terror in France………………………………………… 205
8.1.5. France’s Terror Threats & Counter Terror Strategy……………………………………………………………… 209
8.1.5.1. The New Realities of Terror………………………. 209
8.1.5.2. 2015-2018 Counter Terror Policy Transformation…………………………………………………………… 210
8.1.5.3. Threat Levels…………………………………………. 211
8.1.6. French Anti-Terror Legislation……………………… 211
8.1.7. France’s Homeland Security & Public Safety Agencies…………………………………………………. 215
8.1.8. France’s Police Forces……………………………….. 215
8.1.8.1. The National Police…………………………………. 216
8.1.8.2. Research, Assistance, Intervention, Deterrence (RAID)………………………………………………….. 217
8.1.8.3. National Police Intervention Groups (GIPN)….. 217
8.1.8.4. Paris Police Prefecture…………………………….. 217
8.1.8.5. The Municipal Police……………………………….. 218
8.1.8.6. The National Gendarmerie………………………… 218
8.1.8.7. National Gendarmerie Intervention Group…….. 218
8.1.8.8. Police Forces Statistics…………………………….. 219
8.1.9. France’s Intelligence Services……………………… 220
8.1.9.1. Domestic Counter-terrorism & Counter-espionage Intelligence (DGSI)………………………………….. 220
8.1.9.2. Central Directorate of the Judicial Police (DCPJ)…………………………………………………………… 220
8.1.9.3. General Directorate for External Security (DGSE)…………………………………………………………… 221
8.1.9.4. Directorate of Protection and Defense Security (DPSD)…………………………………………………. 221
8.1.9.5. Directorate of Military Intelligence (DRM)……… 222
8.1.9.6. Anti-Terrorist Bureau (BLAT)……………………… 222
8.1.9.7. Inter-Departmental Coordination on Terrorism Matters…………………………………………………. 222
8.1.10. France’s Defense Forces……………………………. 223
8.1.11. France: Safe City Projects…………………………… 224
8.1.12. France: Airport Security Statistics…………………. 225
8.1.13. France Border Security………………………………. 227
8.1.13.1. France Immigration Data………………………….. 229
8.1.13.2. France Visa Policy………………………………….. 229
8.1.13.3. France E-Passport………………………………….. 230
8.1.13.4. France Immigration Legislation………………….. 230
- Italy Market…………………………………………………………. 231
9.1. Italy Market Background…………………………………… 231
9.1.1. Italy Geopolitical Overview………………………….. 231
9.1.2. Italy Security & Safety Industry…………………….. 232
9.1.3. Crime in Italy……………………………………………. 233
9.1.4. Terror in Italy……………………………………………. 234
9.1.5. Italy’s Counter Terror Legislation & Law Enforcement…………………………………………….. 235
9.1.6. Italy’s Homeland Security & Public Safety Agencies……………………………………………………………… 236
9.1.7. Italy’s Police Forces…………………………………… 237
9.1.8. Italy’s Intelligence Services…………………………. 239
9.1.8.1. Internal Information and Security Agency (AISI) 239
9.1.8.2. External Intelligence and Security Agency (AISE)…………………………………………………………… 239
9.1.8.3. Department of Information for Security (DIS)…. 240
9.1.8.4. Interministerial Committee for the Security of the Republic (CISR)……………………………………… 240
9.1.9. Italy: Airport Security Statistics…………………….. 241
9.1.10. Italy Border Security…………………………………… 242
- Sweden Market……………………………………………………. 244
10.1. Sweden Market Background……………………………… 244
10.1.1. Sweden Geopolitical Overview…………………….. 244
10.1.2. Sweden Homeland Security & Public Safety Industry……………………………………………………………… 244
10.1.3. Crime in Sweden………………………………………. 244
10.1.4. Terror in Sweden………………………………………. 245
10.1.5. Sweden’s Counter Terror Legislation & Law Enforcement…………………………………………….. 246
10.1.6. Sweden’s Homeland Security & Public Safety Agencies…………………………………………………. 246
10.1.7. Sweden’s Police Forces……………………………… 247
10.1.8. Sweden’s Defense Forces…………………………… 247
10.1.9. Sweden’s Intelligence Services…………………….. 248
10.1.10. Sweden: Safe City Projects…………………………. 248
10.1.11. Sweden: Airport Security Statistics………………… 248
- Denmark Market………………………………………………….. 250
11.1. Denmark Market Background……………………………. 250
11.1.1. Denmark Geopolitical Overview……………………. 250
11.1.2. Denmark Security & Public Safety Industry……… 250
11.1.3. Crime in Denmark……………………………………… 251
11.1.4. Terror in Denmark…………………………………….. 251
11.1.5. Denmark’s Counter Terror Legislation & Law Enforcement…………………………………………….. 252
11.1.6. Denmark’s Police Forces……………………………. 253
11.1.7. Denmark’s Intelligence Services…………………… 254
11.1.8. Denmark’s Defense Forces…………………………. 254
11.1.9. Denmark: Airport Security Statistics………………. 254
Middle East & Africa……………………………………………………. 256
- Turkey Market…………………………………………………….. 256
12.1. Turkey Public Safety & Homeland Security Market Background…………………………………………………… 256
12.1.1. Turkey Homeland Security & Public Safety Market……………………………………………………………… 256
12.1.2. Turkey COVID-19 Pandemic……………………….. 258
12.1.3. Crime in Turkey………………………………………… 258
12.1.4. Terror in Turkey………………………………………… 259
12.1.5. Turkey’s Counter Terror Legislation & Law Enforcement…………………………………………….. 259
12.1.6. Turkey’s Homeland Security & Public Safety Agencies…………………………………………………. 260
12.1.7. Turkey’s Police Forces……………………………….. 260
12.1.8. Turkey’s Intelligence Services……………………… 262
12.1.8.1. The National Intelligence Organization (MIT)…. 262
12.1.9. Turkey’s Defense Forces……………………………. 262
12.1.10. Turkey: Airport Security Statistics…………………. 263
12.1.11. Turkey Border Security………………………………. 265
- Saudi Arabia Market…………………………………………….. 266
13.1. Saudi Arabia Market Background……………………….. 266
13.1.1. Saudi Arabia Homeland Security & Public Safety Market……………………………………………………. 266
13.1.2. Saudi Arabia COVID-19 Pandemic……………….. 266
13.1.3. Crime in Saudi Arabia………………………………… 267
13.1.4. Saudi Arabia’s Counter Terror Legislation & Law Enforcement…………………………………………….. 267
13.1.5. Saudi Arabia’s Homeland Security & Public Safety Agencies…………………………………………………. 268
13.1.5.1. Ministry of Interior……………………………………. 271
13.1.5.2. Saudi National Guard………………………………. 272
13.1.5.3. Paramilitary Security Forces……………………… 273
13.1.6. Saudi Arabia’s Police Forces……………………….. 273
13.1.7. Saudi Arabia’s Intelligence Services……………… 274
13.1.7.1. General Intelligence Presidency (GIP)…………. 274
13.1.7.2. General Investigation Directorate (GID or Mabahith)……………………………………………… 274
13.1.8. Saudi Arabia’s Defense Forces…………………….. 275
13.1.8.1. Armed Services………………………………………. 275
13.1.8.2. Independent Forces………………………………… 276
13.1.9. Saudi Arabia’s Safe City Projects………………….. 276
13.1.9.1. Saudi Arabia – 34 Ongoing and Future Safe Cities Projects………………………………………………… 280
13.1.9.2. The Hajj Safe City Strategy……………………….. 280
13.1.10. Saudi Arabia: Airport Security Statistics…………. 281
13.1.11. Saudi Arabia Border Security……………………….. 281
- UAE Market………………………………………………………… 282
14.1. UAE Market Background………………………………….. 282
14.1.1. UAE Homeland Security & Public Safety Market. 282
14.1.2. UAE COVID-19 Pandemic…………………………… 287
14.1.3. Crime in the UAE………………………………………. 287
14.1.4. Terror in the UAE………………………………………. 287
14.1.5. UAE’s Counter Terror Legislation & Law Enforcement…………………………………………….. 288
14.1.6. UAE’s Homeland Security & Public Safety Agencies……………………………………………………………… 290
14.1.7. UAE Police Forces…………………………………….. 290
14.1.8. UAE’s Intelligence Services…………………………. 293
14.1.9. UAE’s Defense Forces……………………………….. 293
14.1.9.1. Military Contribution Abroad………………………. 293
14.1.10. UAE’s Safe City Projects…………………………….. 294
14.1.11. UAE: Airport Security Statistics…………………….. 296
14.1.12. UAE Border Security………………………………….. 296
- Qatar Market……………………………………………………….. 297
15.1. Qatar Market Background………………………………… 297
15.1.1. Qatar Homeland Security & Public Safety Market 297
15.1.2. Qatar COVID-19 Pandemic…………………………. 299
15.1.3. Crime in Qatar………………………………………….. 299
15.1.4. Terror in Qatar………………………………………….. 300
15.1.5. Qatar’s Counter Terror Legislation & Law Enforcement…………………………………………….. 301
15.1.6. Qatar’s Police Forces…………………………………. 302
15.1.7. Qatar’s Intelligence Services……………………….. 303
15.1.8. Qatar’s Defense Forces……………………………… 304
15.1.9. Qatar’s Safe City Projects…………………………… 305
15.1.10. Qatar: Airport Security Statistics…………………… 305
15.1.11. Qatar Border Security………………………………… 305
- Kuwait Market…………………………………………………….. 307
16.1. Kuwait Market Background……………………………….. 307
16.1.1. Kuwait Homeland Security & Public Safety Market……………………………………………………………… 307
16.1.2. COVID-19 pandemic in Kuwait…………………….. 307
16.1.3. Crime in Kuwait………………………………………… 308
16.1.4. Kuwait’s Counter Terror Legislation & Law Enforcement…………………………………………….. 308
16.1.5. Kuwait’s Homeland Security & Public Safety Agencies…………………………………………………. 309
16.1.6. Kuwait’s Police Forces……………………………….. 310
16.1.7. Kuwait’s Intelligence Services………………………. 310
16.1.8. Kuwait’s Defense Forces…………………………….. 311
16.1.9. Kuwait’s Safe City Projects………………………….. 312
16.1.10. Kuwait: Airport Security Statistics………………….. 313
16.1.11. Kuwait Border Security……………………………….. 313
Asia Pacific……………………………………………………………….. 314
- India Market………………………………………………………… 314
17.1. India Market Background………………………………….. 314
17.1.1. India Homeland Security & Public Safety Market 314
17.1.2. COVID-19 Pandemic in India……………………….. 316
17.1.3. Crime in India…………………………………………… 317
17.1.3.1. Crime in New Delhi………………………………….. 317
17.1.3.2. Crime in Mumbai…………………………………….. 318
17.1.3.3. Crime in Hyderabad………………………………… 318
17.1.4. Terror in India…………………………………………… 319
17.1.5. India’s Counter Terror Legislation & Law Enforcement…………………………………………….. 319
17.1.6. India’s Homeland Security & Public Safety Agencies……………………………………………………………… 320
17.1.7. India’s Police Forces………………………………….. 321
17.1.8. India’s Defense Market………………………………. 322
17.1.9. India’s Intelligence Services………………………… 325
17.1.9.1. Intelligence Bureau (IB)……………………………. 325
17.1.9.2. Research and Analysis Wing (RAW)…………… 326
17.1.10. India’s Defense Forces………………………………. 326
17.1.11. India’s Safe City Projects……………………………. 327
17.1.12. India: Airport Security Statistics……………………. 328
17.1.13. India Border Security…………………………………. 330
- China Market………………………………………………………. 332
18.1. China Market Background………………………………… 332
18.1.1. China Geopolitical Overview………………………… 332
18.1.2. China Economy………………………………………… 333
18.1.3. China: Security Threat Assessment………………. 336
18.1.4. China’s Security Industry…………………………….. 337
18.1.5. China Homeland Security & Public Safety Market……………………………………………………………… 340
18.1.6. Crime in China………………………………………….. 340
18.1.7. Terror in China…………………………………………. 342
18.1.8. China’s Counter Terror Legislation & Law Enforcement…………………………………………….. 343
18.1.9. China’s Homeland Security & Public Safety Agencies…………………………………………………. 345
18.2. National Security Commission of the Communist Party of China (CNSC)…………………………………………….. 345
18.3. The 610 Office……………………………………………….. 346
18.3.1. China’s Police Forces………………………………… 349
18.3.2. China’s Intelligence Services……………………….. 349
18.3.3. China’s Ministry of Public Security………………… 350
18.3.4. China’s Public Security Bureau…………………….. 351
18.3.5. China’s Ministry of State Security………………….. 351
18.3.6. China’s Defense Forces……………………………… 352
18.3.7. Natural Disasters in China…………………………… 356
18.3.8. China’s Safe City Projects…………………………… 357
18.3.8.1. China Public Security………………………………. 357
18.3.8.2. China Urbanization Plan…………………………… 358
18.3.8.3. China Safe Cities Market………………………….. 358
18.3.8.4. China’s 200 Largest Safe City Projects………… 360
18.3.9. China: Airport Security Statistics…………………… 361
18.3.10. China Border Security………………………………… 367
- South Korea Market……………………………………………… 368
19.1. South Korea Market Background……………………….. 368
19.1.1. South Korea Homeland Security & Public Safety Market……………………………………………………. 368
19.1.2. Crime in South Korea…………………………………. 369
19.1.3. Terror in South Korea………………………………… 369
19.1.4. South Korea’s Homeland Security & Public Safety Agencies…………………………………………………. 370
19.1.5. South Korea’s Police Forces……………………….. 371
19.1.6. South Korea’s Intelligence Services………………. 371
19.1.6.1. National Intelligence Service (NIS)……………… 371
19.1.7. South Korea’s Defense Forces…………………….. 372
19.1.8. South Korea’s Safe City Projects………………….. 372
19.1.9. South Korea: Airport Security Statistics………….. 374
19.1.10. South Korea Border Security……………………….. 374
- Japan Market………………………………………………………. 375
20.1. Japan Market Background………………………………… 375
20.1.1. Japan Homeland Security & Public Safety Market……………………………………………………………… 375
20.1.2. Crime in Japan…………………………………………. 375
20.1.3. Terror in Japan…………………………………………. 376
20.1.4. Japan’s Homeland Security & Public Safety Agencies…………………………………………………. 377
20.1.5. Japan’s Police Forces………………………………… 378
20.1.6. Japan’s Intelligence Services……………………….. 378
20.1.6.1. Public Security Intelligence Agency (PSIA)…… 378
20.1.6.2. Intelligence and Analysis Service……………….. 379
20.1.7. Japan’s Defense Forces……………………………… 379
20.1.8. Japan’s Safe City Projects…………………………… 380
20.1.9. Natural Disasters in Japan………………………….. 380
20.1.10. Japan: Airport Security Statistics…………………… 382
20.1.11. Japan Border Security………………………………… 384
Volume 4
1 Appendix B: Current Explosives and Narcotics Detection Technologies……………………………………………………….. 11
1.1 Explosive Materials Classification………………………… 11
1.2 Canine Explosives and Narcotics Screening…………… 13
1.3 Explosives and Narcotics Detection Technologies…… 14
1.3.1 Explosives and Narcotics Trace Detection (ETD).. 14
1.3.2 Bulk Explosives and Narcotics Detection………….. 15
1.3.3 Current Explosives & Narcotics Detection Technologies Map………………………………………. 16
1.3.4 ETD vs. Bulk Explosives & Narcotics Detection: Pros & Cons…………………………………………………….. 18
1.4 Emerging People Screening Technologies…………….. 18
1.5 ETD Principles of Operation……………………………….. 19
1.6 ETD Core Technologies…………………………………….. 20
1.6.1 Overview…………………………………………………… 20
1.6.2 Ion Mobility Spectroscopy (IMS)…………………….. 22
1.6.3 Gas Chromatography-Ion Mobility Spectrometry (GC-IMS)………………………………………………….. 24
1.6.4 High Pressure Mass Spectrometry™ (HPMS)…… 24
1.6.5 ChemiLuminescence (Thermal Energy Analyzers) 25
1.6.6 Amplifying Fluorescent Polymer (AFP)…………….. 25
1.6.7 High Frequency Quartz Crystal Microbalance (HF-QCM)……………………………………………………….. 26
1.6.8 Metal Oxide Sensors (MOS)………………………….. 26
1.6.9 Capillary Zone Electrophoresis (CZE)……………… 26
1.6.10 Automated Colorimetry………………………………… 27
1.6.11 Thermo-Redox…………………………………………… 28
1.6.12 Electron Capture Detectors (ECD)………………….. 28
1.6.13 Surface Acoustic Wave (SAW) Detectors…………. 29
1.6.14 Nanotechnology-enabled Technologies for Explosives and Narcotics Detection………………… 30
2 Appendix C: Pipeline ETD Technologies…………………. 33
2.1 Introduction…………………………………………………….. 33
2.2 Techno-Tactical Requirements……………………………. 34
2.3 ETD of the Future: Performance & Operational Goals. 35
2.4 Advanced Sample Collection………………………………. 35
2.5 Dual Sensor ETD Technology…………………………….. 36
2.6 Integrated Explosives, Chemical Warfare and Narcotics Trace Detectors……………………………………………….. 36
2.7 Drivers for Superior ETD Technologies…………………. 36
2.8 Nanotechnology ETDs: Challenges………………………. 37
2.9 Receptor-based ETD………………………………………… 38
2.10 Molecularly Imprinted Polymers Based ETD…………… 38
2.11 Nano-mechanical Sensor Based ETD…………………… 38
2.12 Electronic Nose Based ETD……………………………….. 39
2.13 Silica Micro-cantilever Based ETD……………………….. 39
2.14 Surface Enhanced Raman Scattering Based ETD…… 40
2.15 Hybrid Nano-sensor Based ETD………………………….. 40
2.16 Protein Coated Carbon Nanotubes, Nano Based ETD 40
2.17 Piezo-resistive Polymer Cantilever Nano Based ETD.. 41
2.18 Inkjet Based Wireless Sensor ETD Technology………. 41
2.19 Amino-silane Coated Nanowires Arrays Based ETD… 41
2.20 Free-surface Microfluidic Control of Surface-Enhanced Raman Spectroscopy Based ETD………………………… 42
2.20.1 Introduction……………………………………………….. 42
2.20.2 Trace Chemical Vapor Detection Cartridge………. 43
2.20.3 Free Surface MicroFluidic Chip………………………. 43
2.20.4 Continuous Preconcentrator………………………….. 44
2.20.5 Raman Chemical Specific Signatures……………… 44
2.21 Molecularly Imprinted Polymers Explosives and Narcotics Detection Kit………………………………………. 45
2.22 Quantum Sniffer™ Portable ETD…………………………. 46
2.23 Cantilever Nano Mechanical Sensors……………………. 47
2.24 Sensor Array and Neural Network Based ETD………… 48
2.25 Temperature-Stepped Desorption Based ETD………… 49
2.26 Trace Detection of Nitrogen-Based Explosives with UV-PLF………………………………………………………………. 50
2.27 Non-Contact Explosives and Narcotics Harvesting ETD 50
2.27.1 Non-Contact Harvesting……………………………….. 50
2.27.2 ETD Transport……………………………………………. 51
2.27.3 ETD Analysis…………………………………………….. 51
2.27.4 ETD Reporting…………………………………………… 51
2.28 Check Point Explosives and Narcotics Detection System 51
2.29 Trace Detection of Small Molecules by Pulsed-Ultraviolet Laser Raman Spectroscopy………………….. 52
2.30 Sensing Trace Amounts of Nitro-Aromatic Explosives and Narcotics Using Nanowire-Nanocluster Hybrids…. 52
2.31 Detection of Explosives and Narcotics at Trace Levels by Laser-Induced Breakdown Spectroscopy (LIBS)….. 52
2.32 Universal Explosive Detection System………………….. 53
2.33 MEMS-Based Explosive Particle Detection and Remote Particle Stimulation…………………………………………… 53
2.34 Laser Vaporization of Trace Explosives and Narcotics for Enhanced Non-Contact Detection……………………. 53
2.35 Atmospheric Flow Tube Mass Spectrometry Technology (AFT-MS)……………………………………………………….. 54
2.36 Advanced Materials and Sensor Platforms…………….. 55
2.37 Basic Research……………………………………………….. 55
3 Appendix D: Pipeline ETD Systems by Configuration and Application…………………………………………………………… 57
3.1 Standoff Explosives Trace Detection…………………….. 57
3.2 ETD Based Document Scanner…………………………… 57
3.3 Boarding Gate Explosives Scanners…………………….. 58
3.4 Vehicle Screening ETD Systems…………………………. 59
4 Appendix E: ETD Business Opportunities……………….. 61
4.1 Improved Detection Quality………………………………… 61
4.2 Enable Multiple-threat Detection………………………….. 61
4.3 Reduce Transaction Cost…………………………………… 62
4.4 Increase Automation…………………………………………. 62
4.5 Reduce Throughput Delays………………………………… 62
4.6 Ease of Integration……………………………………………. 62
4.7 Medium Capacity, Multi-Threat Screening Systems…. 62
4.8 Upgraded Bio-Chem, Narcotics & Explosives Multi-Threat Trace Detection Screening……………………….. 62
4.9 “Power” Multi-Threat ETD Vapor-trace Collector……… 63
4.10 Fused Technology Screening Systems with RFID and Risk Assessment Infrastructure…………………………… 63
4.11 Third Party Service…………………………………………… 63
5 Appendix F: ETD Products: Prices, Features & Vendors 64
6 Appendix G: Checked Luggage EDS & ETD Screening Configurations……………………………………………………… 68
7 Appendix H: ETD Screening: ICAO Recommendations 75
8 Appendix I: TSA Air Cargo Facility Regulations………… 76
8.1 Introduction to Cargo Security…………………………….. 76
8.2 Air Cargo Explosives Screening…………………………… 76
8.3 Airport – Cargo Processing Facilities…………………….. 77
8.4 Operational Considerations………………………………… 77
8.5 Access Control Considerations……………………………. 78
8.6 Information and Requirement Resources………………. 80
9 Appendix J: TSA Air Cargo Screening Technology List (ACSTL) – 2022……………………………………………………… 81
9.1 Document Purpose…………………………………………… 81
9.2 Certified ETD Devices……………………………………….. 81
9.3 Approved ETD Devices……………………………………… 81
9.4 Grandfathered ETD Devices……………………………….. 82
10 Appendix K: Authorized Air-Cargo Screening Facilities Roster…………………………………………………………………. 83
11 Appendix L: EU Screening Equipment Certification & Standards…………………………………………………………… 107
11.1 EU Certification of Aviation Security Screening Equipment…………………………………………………….. 107
11.2 ECAC/EU Performance Standard Equipment Evaluation 108
12 Appendix M: The DOJ ETD Evaluation Protocol for 1st Responders………………………………………………………… 109
12.1 Introduction…………………………………………………… 109
12.2 The Basics of Instrument Operation……………………. 109
12.3 Protocol for Characterizing a Trace Explosives Detector 112
12.3.1 Probability of Detection – P(d)………………………. 113
12.3.2 Detection Limit (DL)…………………………………… 113
12.3.3 False-Negative Rate………………………………….. 115
12.3.4 False-Positive Test……………………………………. 115
12.3.5 Nuisance-Alarm Rate…………………………………. 116
12.3.6 Interference Tests……………………………………… 116
12.3.7 Throughput Rate………………………………………. 117
12.3.8 Sampling Time…………………………………………. 118
12.3.9 Analysis Time…………………………………………… 119
12.3.10 Total Processing Time……………………………….. 119
13 Appendix N: Consumables……………………………………. 120
13.1 ETD Consumables Market………………………………… 120
13.2 TSA Requirements………………………………………….. 120
13.3 Consumables Vendors…………………………………….. 120
13.4 Consumables by Manufacturer: ETD Model, Description 121
14 Appendix O: The Narcotics Trafficking “Industry”……. 123
14.1 Illegal Narcotics Trade……………………………………… 123
14.2 Narcotics Trafficking via West Africa…………………… 124
14.3 Narcotics Trafficking Route in Asia……………………… 124
14.4 Narcotics Trafficking in the United States…………….. 125
14.5 Narcotics Trafficking in Mexico………………………….. 126
14.6 Narcotics Industry in Colombia………………………….. 128
15 Appendix P: Improvised and Military Explosives……… 129
15.1 Background…………………………………………………… 129
15.2 Explosives Categories……………………………………… 129
15.2.1 Chemical Explosives………………………………….. 129
15.2.2 Explosives Train……………………………………….. 131
15.2.3 Low Explosives…………………………………………. 132
15.2.4 Nitrocellulose……………………………………………. 133
15.2.5 High Explosives………………………………………… 134
15.2.6 Primary High Explosives…………………………….. 135
15.3 Secondary High Explosives………………………………. 137
15.3.1 PETN……………………………………………………… 137
15.3.2 RDX……………………………………………………….. 138
15.3.3 Main Charges…………………………………………… 138
15.4 Improvised Explosives……………………………………… 141
15.4.1 Introduction……………………………………………… 141
15.4.2 Hexamethylene Triperoxide Diamine (HMTD)….. 142
15.4.3 Triacetone Triperoxide (TATP)…………………….. 142
16 Appendix Q: IATA Airport Screening Checkpoints Recommended……………………………………………………. 144
17 Appendix R: Glossary & Abbreviations…………………… 149
18 Report Research Methodology………………………………. 170
18.1 Report Structure…………………………………………….. 170
18.2 Assumptions………………………………………………….. 170
18.3 Research Methodology……………………………………. 171
18.4 For Whom is This Report?………………………………… 172
19 Disclaimer & Copyright………………………………………… 173