Top
HSRCGlobal Airport Security Market, Technologies & Industry – 2016-2020
Placeholder

Global Airport Security Market, Technologies & Industry - 2016-2020

Airport Security Market – The 7.4% CAGR Global Market Growth is Driven by Europe & Asia-Pacific

  • Q1 2015
  • 819
  • 785
    • 3450 $
    • 4450 $
    • 6950 $
    • 8000 $

    Small Businesses, Startups & Academia - Up to 50% Off

Quantity
IBM
Amazon
Sandia National Lab
HITACHI
Thales
Smiths Detection
Nuctech
Korea Internet & Security Agency
L3Harris
Huawei
Leidos
NEC
Toshiba
Deloitte
MAG

Want to customize this report?

If you purchase this report, you are entitled to a 30% discount towards customizing it, to better fit your market research and strategic needs. Our Custom Research and Industry Insights Department will work with you to better understand your information gaps and strategic needs and will provide you with a tailor-made market research report within a short period of time.

Why Choose Us?

30+ Years of Experience
We are a multidisciplinary team of Transformational Technologies industry experts with over 30 years of experience.
Gold Standard
With over 950 private sector clients (73% repeat customers), including major defense and security vendors, and Forbes Global 2000 companies, HSRC earned the reputation as the industry’s Gold Standard for Transformational Technologies Market Reports.
Tailored Research Services
Provide you with clear, actionable recommendations designed to empower decision making and to help you exploit emerging opportunities in the Transformational Technologies industries.
Information Security
Your personal information is safe and secure.

From: $3,450

SKU: 7735 Category:

Description

Check out our new Aviation Security Market 2019-2025 Report – Click Here – 

One cannot underestimate the importance of effective airport security. Since the end of the cold war, no single event has had a greater effect on the global geopolitics and defense than the 9/11 attacks which were made possible by the pre-9/11 airport security processes loopholes.

The airport security technologies, industry & markets are going through major shifts. Markets once dominated by the U.S. TSA are now moving to European, Middle Eastern and Asia-Pacific airports. New and maturing sectors and technologies such as automated border control kiosks, cargo screening, cyber security, airport perimeter security systems and advanced ICT technologies create new market niches and fresh business opportunities. According to the report, the aviation security market is forecasted to make a robust comeback, generating a 2014-2020 CAGR of 7.4%.

Airport Security Market Forecast Airport Security: Technologies, Industry & Markets
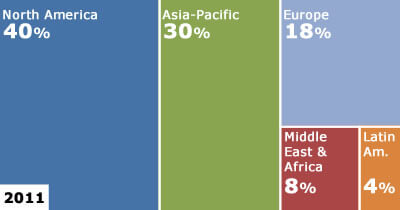
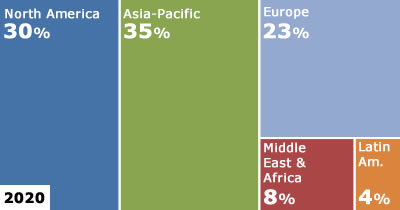
Airport Security Market Share [%] by Region – 2011 & 2020

According to the report, the market growth is boosted by the following drivers:

  1. The global air passenger volume growth, particularly in the Middle East and Asia-Pacific regions.
  2. The growing importance of enhanced airport security.
  3. Advancements in airport security technology and infrastructure.
  4. The fast growth of the Asia Pacific airport sector (e.g., China new airports and upgrades, 2 out of every 3 new airport projects in the world are in mainland China).
  5. The moderate growth of the aviation sector in other regions.
  6. Worsening of radical Islamists terror threats to European & Middle East airports.
  7. The need to streamline airport security processes using airport security baggage scanners and additional technology and reduce passengers’ waiting time.
  8. Replacement and upgrades of outdated airport security systems such as baggage scanners and metal detectors .
  9. Growing aftersale revenues.

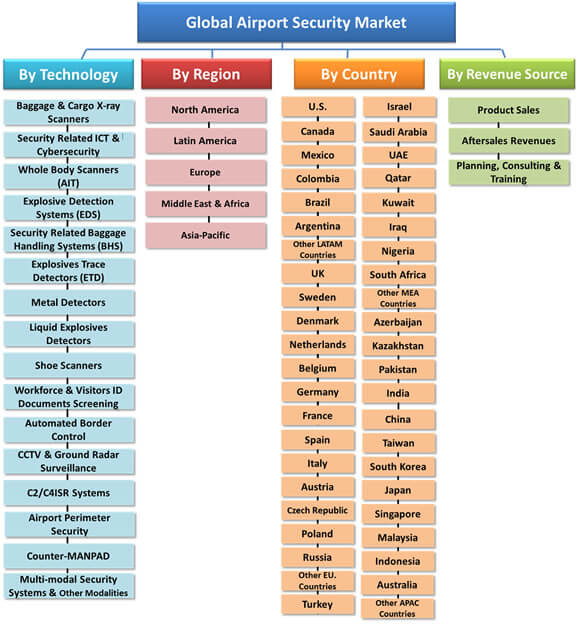
The report examines each dollar spent in the airport security systems market via 4 orthogonal money trails:

  1. By 3 revenue sources including Product Sale, Aftersale Revenues, Planning, Consulting & Training.
  2. By 5 regional markets: North America, Latin America, Europe, Middle East and Africa, Asia-Pacific.
  3. By 16 airport security technology markets: Baggage & Cargo X-ray Scanners, Security-Related ICT & Cybersecurity, Whole Body Scanners (AIT), Explosive Detection Systems (EDS), Security-Related Baggage Handling Systems (BHS), Explosives Trace Detectors (ETD), Metal Detectors, Liquid Explosives Detectors, Shoe Scanners, Workforce & Visitors ID Documents Screening, Automated Border Control, CCTV & Ground Radar Surveillance, C2/C4ISR Systems, Airport Perimeter Security, Counter-MANPAD, Multi-modal Security Systems and other Modalities.
  4. By 44 national markets: U.S., Canada, Mexico, Columbia, Brazil, Argentina, other Latin American countries, U.K., Sweden, Denmark, Netherlands, Belgium, Germany, France, Spain, Italy, Austria, Czech Republic, Poland, Russia, other European countries, Turkey, Israel, Saudi Arabia, UAE, Qatar, Kuwait, Iraq, Nigeria, South Africa, other MEA countries, Azerbaijan, Kazakhstan, Pakistan, India, China, Taiwan, South Korea, Japan, Singapore, Malaysia, Indonesia, Australia, other Asia-Pacific countries.

These can be seen below:

Airport Security Market

The “Global Airport Security: Technologies, Industry & Markets – 2015-2020” report is a resource for decision-makers in the aviation security community. It has been explicitly customized for airport security industry executives to identify business opportunities, developing technologies, market trends and risks; as well as to benchmark business plans.

Questions answered in this 3-volume 819 page report include:

  • What are the procurement models, and how do they affect the industry’s business models?
  • What are the main end-user trends?
  • How can the supplier industry introduce new products and services to meet the security needs of future airport operating models?
  • What are the challenges to market penetration?
  • What will the market size be in 2015-2020?
  • What are the key and pipeline airport security technologies including airport security baggage scanners?
  • How does the balance of passenger satisfaction & operational efficiency versus stringent security measures affect the security industry?
  • What are the key market trends?
  • What are the opportunities to increase your market share?
  • Where are the most attractive business opportunities?
  • What is driving this market?
  • What are the inhibitors to your growth?
  • What are the risks to your market share?
  • Who are the key vendors in this market?
  • What are the threats faced by the key vendors?

With 819 pages, 317 tables and 468 figures, this 3-volume “Global Airport Security: Technologies, Industry & Markets – 2015-2020″ is the most extensive Aviation Security market & technology research project ever conducted. This landmark airport security market report offers for each of its 212 sub-markets 2011-2014 market data and analyses, as well as 2015-2020 forecasts and analyses.

Detailed market analysis frameworks include:

  • Market drivers & inhibitors
  • Business opportunities & challenges
  • SWOT analysis
  • Aviation security eco-system
  • Competitive analysis
  • Business environment

Airpot security companies operating in the market (profiles, products and contact info):  American Science and Engineering Inc., Auto Clear, IBM, Lockheed Martin, ADANI, Red X Defense, Syagen Technology. Thermo Electron Corporation, Biosensor Applications, Hitachi, Scent Detection Technologies, Ketech Defence, Mistral Security Inc, Appealing Products Inc. (API), ChemSee, DetectaChem LLC, Scintrex Trace, Flir Systems, Implant Sciences Corp., Ion Applications Inc, BAHIA Corp (Sibel Ltd.), CEIA, Fisher Labs, Brijot Imaging Systems, TeraView, ThruVision Systems, Gilardoni SpA, L-3 Communications Security & Detection Systems, QinetiQ Ltd., Westminster International Ltd., LIXI Inc, MilliVision, MINXRAY Inc., Morpho Detection Inc., Nuctech Co. Ltd., Rapiscan Security Products Inc., Scanna MSC Ltd., Smiths Detection, Vidisco Ltd.

Airports Security Screening Data at over 1300 airports in 40 countries: The airport security market report provides screening data at each and every airport segmented by over 1,300 airports which screen 2,552 million passengers (89% of the global aviation passengers). For each country, all the airports with over 100,000 annual screened passengers are presented, including details on the number of screened passengers and the annual growth rate.

Table of Contents

Download TOC as PDF

3 Volumes:

Global Airport Security: Technologies, Industry & Markets – Volume 1

Global Airport Security: Technologies, Industry & Markets – Volume 2

Global Airport Security: Technologies, Industry & Markets – Volume 3


Global Airport Security: Technologies, Industry & Markets – Volume 1

1 Summary
2 Extended Summary
2.1 Scope
2.2 Airport Security Market Major Findings
2.3 Airport Security Market Major Conclusions
GLOBAL MARKET
3 Market Background
3.1 Aviation Security Terror Threats
3.2 Aviation Security Strategy
3.3 Aviation Security Market Demand Side
3.4 Airports
3.5 Airlines
3.6 Freight Forwarders
3.7 Customs Services
3.8 Security Service Providers
3.9 Aviation Passenger Screening Technologies Outlook: 2015-2020
4 Aviation Security Market Drivers
5 Aviation Security Market Inhibitors
6 Aviation Security: 20 Business Opportunities
7 Aviation Security Industry: SWOT Analysis
7.1 Airport Security Market Strengths
7.2 Airport Security Market Weaknesses
7.3 Airport Security Market Opportunities
7.4 Threats
8 Aviation Security Market Competitive Analysis
9 Global Airport Security Market – 2011-2020
9.1 Global Airport Security Market by Region
9.1.1 Consolidated Airport Security Market by Region – 2015-2020
9.1.2 Airport Security Market Dynamics – 2015-2020
9.1.3 Airport Security Market Breakdown – 2015-2020
9.2 Global Airport Security Market by Technology
9.2.1 Consolidated Aviation Security Market – 2015-2020
9.2.2 Aviation Security Market Dynamics – 2015-2020
9.2.3 Aviation Security Market Breakdown – 2015-2020
NORTH AMERICA Aviation Security MARKET
10 North America Airport Security Market – 2011-2020
11 U.S. Airport Security Market – 2011-2020
11.1 U.S. Aviation Security Market Background
11.1.1 The Transportation Security Administration
11.1.1.1 Passengers Screening Partnership Program
11.1.1.2 Passengers Screening Training and Other Programs
11.1.1.3 Passengers Checkpoint Support Program
11.1.1.4 Screening Technology Maintenance & Utilities Program
11.1.2 U.S. Aviation Regulations and Enforcement Programs
11.1.3 Airport Management, IT and Support Programs
11.1.4 U.S. Air Cargo Security Program
11.1.5 Secure Flight Program
11.1.6 Federal Air Marshal Service Program
11.2 U.S. Passenger Screening Statistics by 501 Airports
11.3 U.S. Airport Security Market
11.3.1 Airport Security Market Size – 2011-2020
11.3.2 Airport Security Market Dynamics – 2012-2020
11.3.3 Airport Security Market Breakdown – 2011-2020
12 Canada Airport Security Market – 2011-2020
12.1 Canada Aviation Background
12.2 Canada Aviation Security Market Background
12.2.1 Aviation Security Mandated Activities
12.2.2 Air Travelers Security
12.2.3 Air Cargo Screening
12.2.4 AIT Screening
12.3 Canada Passenger Screening Statistics by 20 Airports
12.4 Canada Airport Security Market
12.4.1 Airport Security Market Size – 2011-2020
12.4.2 Airport Security Market Dynamics – 2012-2020
12.4.3 Airport Security Market Breakdown – 2011-2020
LATIN AMERICA MARKET
13 Latin America Airport Security Market – 2011-2020
14 Mexico Airport Security Market – 2011-2020
14.1 Mexico Aviation Security Market Background
14.2 Mexico Passenger Screening Statistics by 50 Airports
14.3 Mexico Airport Security Market
14.3.1 Airport Security Market Size – 2011-2020
14.3.2 Airport Security Market Dynamics – 2012-2020
14.3.3 Airport Security Market Breakdown – 2011-2020
15 Colombia Airport Security Market – 2011-2020
15.1 Colombia Aviation Security Market Background
15.2 Colombia Passenger Screening Statistics by 15 Airports
15.3 Colombia Airport Security Market
15.3.1 Airport Security Market Size – 2011-2020
15.3.2 Airport Security Market Dynamics – 2012-2020
15.3.3 Airport Security Market Breakdown – 2011-2020
16 Brazil Airport Security Market – 2011-2020
16.1 Brazil Aviation Security Market Background
16.2 Brazil Passenger Screening Statistics by 41 Airports
16.3 Brazil Airport Security Market
16.3.1 Airport Security Market Size – 2011-2020
16.3.2 Airport Security Market Dynamics – 2012-2020
16.3.3 Airport Security Market Breakdown – 2011-2020
17 Argentina Airport Security Market – 2011-2020
17.1 Argentina Aviation Security Market Background
17.2 Argentina Passenger Screening Statistics by Airports
17.3 Argentina Airport Security Market
17.3.1 Airport Security Market Size – 2011-2020
17.3.2 Airport Security Market Dynamics – 2012-2020
17.3.3 Airport Security Market Breakdown – 2011-2020
EUROPEAN MARKET
18 Europe Airport Security Market – 2011-2020
19 UK Airport Security Market – 2011-2020
19.1 UK Aviation Passengers & Cargo
19.2 UK Aviation Security
19.3 UK Passenger Screening Statistics by 38 Airports
19.4 UK Airport Security Market
19.4.1 Airport Security Market Size – 2011-2020
19.4.2 Airport Security Market Dynamics – 2012-2020
19.4.3 Airport Security Market Breakdown – 2011-2020
20 Sweden Airport Security Market – 2011-2020
20.1 Sweden Aviation Security Market Background
20.2 Sweden Passenger Screening Statistics by 24 Airports
20.3 Sweden Airport Security Market
20.3.1 Airport Security Market Size – 2011-2020
20.3.2 Airport Security Market Dynamics – 2012-2020
20.3.3 Airport Security Market Breakdown – 2011-2020
21 Denmark Airport Security Market – 2011-2020
21.1 Denmark Aviation Security Market Background
21.2 Denmark Passenger Screening Statistics by 7 Airports
21.3 Denmark Airport Security Market
21.3.1 Airport Security Market Size – 2011-2020
21.3.2 Airport Security Market Dynamics – 2012-2020
21.3.3 Airport Security Market Breakdown – 2011-2020
22 Netherlands Airport Security Market – 2011-2020
22.1 Netherlands Aviation Security Market Background
22.2 Netherlands Passenger Screening Statistics by 5 Airports
22.3 Netherlands Airport Security Market
22.3.1 Airport Security Market Size – 2011-2020
22.3.2 Airport Security Market Dynamics – 2012-2020
22.3.3 Airport Security Market Breakdown – 2011-2020
23 Belgium Airport Security Market – 2011-2020
23.1 Belgium Aviation Security Market Background
23.2 Belgium Passenger Screening Data
23.3 Belgium Airport Security Market
23.3.1 Airport Security Market Size – 2011-2020
23.3.2 Airport Security Market Dynamics – 2012-2020
23.3.3 Airport Security Market Breakdown – 2011-2020
24 Germany Airport Security Market – 2011-2020
24.1 Germany Aviation Security Market Background
24.2 Germany Passenger Screening Statistics by 26 Airports
24.3 Germany Airport Security Market
24.3.1 Airport Security Market Size – 2011-2020
24.3.2 Airport Security Market Dynamics – 2012-2020
24.3.3 Airport Security Market Breakdown – 2011-2020
25 France Airport Security Market – 2011-2020
25.1 France Aviation Security Market Background
25.2 France Passenger Screening Statistics by 57 Airports
25.3 France Airport Security Market
25.3.1 Airport Security Market Size – 2011-2020
25.3.2 Airport Security Market Dynamics – 2012-2020
25.3.3 Airport Security Market Breakdown – 2011-2020
26 Spain Airport Security Market – 2011-2020
26.1 Spain Aviation Security Market Background
26.2 Spain Passenger Screening Statistics by 30 Airports
26.3 Spain Airport Security Market
26.3.1 Airport Security Market Size – 2011-2020
26.3.2 Airport Security Market Dynamics – 2012-2020
26.3.3 Airport Security Market Breakdown – 2011-2020
27 Italy Airport Security Market – 2011-2020
27.1 Italy Aviation Market Background
27.2 Italy Aviation Security Market Background
27.3 Italy Passenger Screening Statistics by 31 Airports
27.4 Italy Airport Security Market
27.4.1 Airport Security Market Size – 2011-2020
27.4.2 Airport Security Market Dynamics – 2012-2020
27.4.3 Airport Security Market Breakdown – 2011-2020
28 Austria Airport Security Market – 2011-2020
28.1 Austria Aviation Security Market Background
28.2 Austria Aviation Security Market Background
28.3 Austria Passenger Screening Statistics by 40 Airports
28.4 Austria Airport Security Market
28.4.1 Airport Security Market Size – 2011-2020
28.4.2 Airport Security Market Dynamics – 2012-2020
28.4.3 Airport Security Market Breakdown – 2011-2020
29 Czech Republic Airport Security Market – 2011-2020
29.1 Czech Republic Aviation Security Market Background
29.2 Czech Republic Passenger Screening Data
29.3 Czech Republic Airport Security Market
29.3.1 Airport Security Market Size – 2011-2020
29.3.2 Airport Security Market Dynamics – 2012-2020
29.3.3 Airport Security Market Breakdown – 2011-2020
30 Poland Airport Security Market – 2011-2020
30.1 Poland Aviation Security Market Background
30.2 Poland Passenger Screening Statistics by 11 Airports
30.3 Poland Airport Security Market
30.3.1 Airport Security Market Size – 2011-2020
30.3.2 Airport Security Market Dynamics – 2012-2020
30.3.3 Airport Security Market Breakdown – 2011-2020
31 Russia Airport Security Market – 2011-2020
31.1 Russia Aviation Security Market Background
31.2 Russia Passenger Screening Statistics by 58 Airports
31.3 Russia Airport Security Market
31.3.1 Airport Security Market Size – 2011-2020
31.3.2 Airport Security Market Dynamics – 2012-2020
31.3.3 Airport Security Market Breakdown – 2011-2020
MIDDLE EAST & AFRICA MARKET
32 Middle East and Africa Airport Security Market – 2011-2020
33 Turkey Airport Security Market – 2011-2020
33.1 Turkey Aviation Security Market Background
33.2 Turkey Passenger Screening Statistics by 36 Airports
33.3 Turkey Airport Security Market
33.3.1 Airport Security Market Size – 2011-2020
33.3.2 Airport Security Market Dynamics – 2012-2020
33.3.3 Airport Security Market Breakdown – 2011-2020
34 Israel Airport Security Market – 2011-2020
34.1 Israel Aviation Market Background
34.2 Israel Aviation Security Market Background
34.3 Israel Airport Passenger Screening Data
34.4 Israel Airport Security Market
34.4.1 Airport Security Market Size – 2011-2020
34.4.2 Airport Security Market Dynamics – 2012-2020
34.4.3 Airport Security Market Breakdown – 2011-2020
35 Saudi Arabia Airport Security Market – 2011-2020
35.1 Saudi Arabia Aviation Security Market Background
35.2 Saudi Arabia Passenger Screening Statistics by Airport
35.3 Saudi Arabia Airport Security Market
35.3.1 Airport Security Market Size – 2011-2020
35.3.2 Airport Security Market Dynamics – 2012-2020
35.3.3 Airport Security Market Breakdown – 2011-2020
36 UAE Airport Security Market – 2011-2020
36.1 UAE Aviation Security Market Background
36.1.1 Dubai Airports Expansion Plan 2020
36.1.2 Augmented Baggage Scanning Machines
36.2 U.A.E. Passenger Screening Statistics by 3 Airports
36.3 UAE Airport Security Market
36.3.1 Airport Security Market Size – 2011-2020
36.3.2 Airport Security Market Dynamics – 2012-2020
36.3.3 Airport Security Market Breakdown – 2011-2020
37 Qatar Airport Security Market – 2011-2020
37.1 Qatar Aviation Security Market Background
37.2 Doha Airport Passenger Screening Statistics by Airport
37.3 Qatar Airport Security Market
37.3.1 Airport Security Market Size – 2011-2020
37.3.2 Airport Security Market Dynamics – 2012-2020
37.3.3 Airport Security Market Breakdown – 2011-2020
38 Kuwait Airport Security Market – 2011-2020
38.1 Kuwait Aviation Security Market Background
38.2 Kuwait Airport Passenger Screening Statistics by Airport
38.3 Kuwait Airport Security Market
38.3.1 Airport Security Market Size – 2011-2020
38.3.2 Airport Security Market Dynamics – 2012-2020
38.3.3 Airport Security Market Breakdown – 2011-2020
39 Iraq Airport Security Market – 2011-2020
39.1 Iraq Aviation Security Market Background
39.2 Iraq Passenger Screening Statistics by Airport
39.3 Iraq Airport Security Market
39.3.1 Airport Security Market Size – 2011-2020
39.3.2 Airport Security Market Dynamics – 2012-2020
39.3.3 Airport Security Market Breakdown – 2011-2020
40 Nigeria Airport Security Market – 2011-2020
40.1 Nigeria Aviation Security Market Background
40.2 Nigeria Passenger Screening Statistics by 12 Airports
40.3 Nigeria Airport Security Market
40.3.1 Airport Security Market Size – 2011-2020
40.3.2 Airport Security Market Dynamics – 2012-2020
40.3.3 Airport Security Market Breakdown – 2011-2020
41 South Africa Airport Security Market – 2011-2020
41.1 South Africa Aviation Security Market Background
41.2 South Africa Passenger Screening Statistics by 9 Airports
41.3 South Africa Airport Security Market
41.3.1 Airport Security Market Size – 2011-2020
41.3.2 Airport Security Market Dynamics – 2012-2020
41.3.3 Airport Security Market Breakdown – 2011-2020
ASIA-PACIFIC MARKET
42 Asia-Pacific Airport Security Market – 2011-2020
43 Azerbaijan Airport Security Market – 2011-2020
43.1 Azerbaijan Aviation Security Market Background
43.2 Passenger Screening Data in Baku Airport
43.3 Azerbaijan Airport Security Market
43.3.1 Aviation Security Market Size – 2011-2020
43.3.2 Aviation Security Market Dynamics – 2012-2020
43.3.3 Aviation Security Market Breakdown – 2011-2020
44 Kazakhstan Airport Security Market – 2011-2020
44.1 Kazakhstan Aviation Security Market Background
44.2 Kazakhstan Passengers Screening Statistics by Airport
44.3 Kazakhstan Airport Security Market
44.3.1 Aviation Security Market Size – 2011-2020
44.3.2 Aviation Security Market Dynamics – 2012-2020
44.3.3 Aviation Security Market Breakdown – 2011-2020
45 Pakistan Airport Security Market – 2011-2020
45.1 Pakistan Aviation Security Market Background
45.2 Pakistan Passenger Screening Statistics by 8 Airports
45.3 Pakistan Airport Security Market
45.3.1 Aviation Security Market Size – 2011-2020
45.3.2 Aviation Security Market Dynamics – 2012-2020
45.3.3 Aviation Security Market Breakdown – 2011-2020
45.3.4 India Airport Security Market – 2011-2020
45.3.4.1 India Aviation Security Market Background
45.4 India Passenger Screening Statistics by 46 Airports
45.5 India Airport Security Market
45.5.1 Aviation Security Market Size – 2011-2020
45.5.2 Aviation Security Market Dynamics – 2012-2020
45.5.3 Aviation Security Market Breakdown – 2011-2020
46 China Airport Security Market – 2011-2020
46.1 China Aviation Security Market Background
46.2 China Passenger Screening Statistics by 100 Airports
46.3 China Airport Security Market
46.3.1 Aviation Security Market Size – 2011-2020
46.3.2 Aviation Security Market Dynamics – 2012-2020
46.3.3 Aviation Security Market Breakdown – 2011-2020
47 Taiwan Airport Security Market – 2011-2020
47.1 Taiwan Aviation Security Market Background
47.2 Taiwan Passenger Screening Statistics by 6 Airports
47.3 Taiwan Airport Security Market
47.3.1 Aviation Security Market Size – 2011-2020
47.3.2 Aviation Security Market Dynamics – 2012-2020
47.3.3 Aviation Security Market Breakdown – 2011-2020
48 South Korea Airport Security Market – 2011-2020
48.1 South Korea Aviation Security Market Background
48.2 South Korea Passenger Screening Statistics by 13 Airports
48.3 South Korea Airport Security Market
48.3.1 Aviation Security Market Size – 2011-2020
48.3.2 Aviation Security Market Dynamics – 2012-2020
48.3.3 Aviation Security Market Breakdown – 2011-2020
49 Japan Airport Security Market – 2011-2020
49.1 Japan Aviation Security Market Background
49.2 Japan Passenger Screening Statistics by 50 Airports
49.3 Japan Airport Security Market
49.3.1 Aviation Security Market Size – 2011-2020
49.3.2 Aviation Security Market Dynamics – 2012-2020
49.3.3 Aviation Security Market Breakdown – 2011-2020
50 Singapore Airport Security Market – 2011-2020
50.1 Singapore Aviation Security Market Background
50.2 Changi Airport Passenger Screening Statistics by Airport
50.3 Singapore Airport Security Market
50.3.1 Aviation Security Market Size – 2011-2020
50.3.2 Aviation Security Market Dynamics – 2012-2020
50.3.3 Aviation Security Market Breakdown – 2011-2020
51 Malaysia Airport Security Market – 2011-2020
51.1 Malaysia Aviation Security Market Background
51.2 Malaysia Passenger Screening Statistics by 18 Airports
51.3 Malaysia Airport Security Market
51.3.1 Aviation Security Market Size – 2011-2020
51.3.2 Aviation Security Market Dynamics – 2012-2020
51.3.3 Aviation Security Market Breakdown – 2011-2020
52 Indonesia Airport Security Market – 2011-2020
52.1 Indonesia Aviation Security Market Background
52.2 Indonesia Passenger Screening Statistics by 33 Airports
52.3 Indonesia Airport Security Market
52.3.1 Aviation Security Market Size – 2011-2020
52.3.2 Aviation Security Market Dynamics – 2012-2020
52.3.3 Aviation Security Market Breakdown – 2011-2020
53 Australia Airport Security Market – 2011-2020
53.1 Australia Aviation Market Background
53.2 Australia Aviation Security Market Background
53.3 Australia Passenger Screening Statistics by 20 Airports
53.4 Australia Airport Security Market
53.4.1 Aviation Security Market Size – 2011-2020
53.4.2 Aviation Security Market Dynamics – 2012-2020
53.4.3 Aviation Security Market Breakdown – 2011-2020
54 Disclaimer & Copyright


[Back to top]

Global Airport Security: Technologies, Industry & Markets – Volume 2

TECHNOLOGY MARKETS
1 Global Airport Security: Baggage & Cargo X-ray Scanners Market – 2011-2020
1.1 Airport Security: Baggage & Cargo X-ray Scanners Market Background
1.2 Global Airport Security: Baggage & Cargo X-ray Scanners Market by Region – 2011-2020
1.2.1 Baggage & Cargo X-ray Scanners Market by Region – 2011-2020
1.2.2 Baggage & Cargo X-ray Scanners Market Dynamics by Region – 2012-2020
1.2.3 Baggage & Cargo X-ray Scanners Market Share by Region – 2011-2020
1.3 North America Baggage & Cargo X-ray Scanners: Airport Security Market – 2011-2020
1.4 Latin America Baggage & Cargo X-ray Scanners: Airport Security Market – 2011-2020
1.5 Europe Baggage & Cargo X-ray Scanners: Airport Security Market – 2011-2020
1.6 Middle East and Africa Baggage & Cargo X-ray Scanners: Airport Security Market – 2011-2020
1.7 Asia-Pacific Baggage & Cargo X-ray Scanners: Airport Security Market – 2011-2020
2 Global Airport Security Related ICT & Cybersecurity Market – 2011-2020
2.1 Security Related ICT & Cybersecurity: Market Background
2.2 Global Airport Security Related ICT & Cybersecurity: Market by Region – 2011-2020
2.2.1 ICT & Cybersecurity Market by Region – 2011-2020
2.2.2 Security Related ICT & Cybersecurity: Market Dynamics by Region – 2012-2020
2.2.3 ICT & Cybersecurity Market Share by Region – 2011-2020
2.3 North America Airport Security Related ICT & Cybersecurity Market – 2011-2020
2.4 Latin America Airport Security Related ICT & Cybersecurity Market – 2011-2020
2.5 Europe Airport Security Related ICT & Cybersecurity Market – 2011-2020
2.6 Middle East and Africa Airport Security Related ICT & Cybersecurity Market – 2011-2020
2.7 Asia-Pacific Airport Security Related ICT & Cybersecurity Market – 2011-2020
3 Global Airport Security: Whole Body Scanners (AIT) Market – 2011-2020
3.1 Airport Security: Whole Body Scanners (AIT) Market Background
3.2 Global Airport Security: Whole Body Scanners (AIT) Market by Region – 2011-2020
3.2.1 Whole Body Scanners (AIT) Market by Region – 2011-2020
3.2.2 Whole Body Scanners (AIT) Market Dynamics by Region – 2012-2020
3.2.3 Whole Body Scanners (AIT) Market Share by Region – 2011-2020
3.3 North America Airport Security: Whole Body Scanners (AIT) Market – 2011-2020
3.4 Latin America Whole Body Scanners (AIT) Market – 2011-2020
3.5 Europe Airport Security: Whole Body Scanners (AIT) Market – 2011-2020
3.6 Middle East and Africa Airport Security: Whole Body Scanners (AIT) Market – 2011-2020
3.7 Asia-Pacific Airport Security: Whole Body Scanners (AIT) Market – 2011-2020
4 Global Airport Security: Explosive Detection Systems Market – 2011-2020
4.1 Airport Security: Explosive Detection Systems (EDS): Market Background
4.2 Global Airport Explosive Detection Systems: Market by Region – 2011-2020
4.2.1 Airport Explosive Detection Systems Market by Region – 2011-2020
4.2.2 Airport Explosive Detection Systems Market Dynamics by Region – 2012-2020
4.2.3 Airport Explosive Detection Systems Market Share by Region – 2011-2020
4.3 North America Airport Explosive Detection Systems Market – 2011-2020
4.4 Latin America Airport Explosive Detection Systems Market – 2011-2020
4.5 Europe Airport Explosive Detection Systems Market – 2011-2020
4.6 Middle East and Africa Airport Explosive Detection Systems Market – 2011-2020
4.7 Asia-Pacific Airport Explosive Detection Systems Market – 2011-2020
5 Global Related Baggage Handling Systems (BHS) Market – 2011-2020
5.1 Airport Security Related Baggage Handling (BHS): Market Background
5.2 Global Aviation Security Related Baggage Handling Systems (BHS): Market by Region – 2011-2020
5.2.1 Baggage Handling (BHS) Market by Region – 2011-2020
5.2.2 Baggage Handling (BHS) Market Dynamics by Region – 2012-2020
5.2.3 Baggage Handling (BHS) Market Share by Region – 2011-2020
5.3 North America Aviation Security Related Baggage Handling Systems (BHS) Market – 2011-2020
5.4 Latin America Aviation Security Related Baggage Handling Systems (BHS) Market – 2011-2020
5.5 Europe Aviation Security Related Baggage Handling Systems (BHS) Market – 2011-2020
5.6 Middle East and Africa Aviation Security Related Baggage Handling Systems (BHS) Market – 2011-2020
5.7 Asia-Pacific Aviation Security Related Baggage Handling Systems (BHS) Market – 2011-2020
6 Global Aviation Security: Explosives Trace Detectors Market – 2011-2020
6.1 Aviation Security: Explosives Trace Detectors Market Background
6.2 Global Aviation Security Explosives Trace Detectors: Market by Region – 2011-2020
6.2.1 Explosives Trace Detectors Market by Region – 2011-2020
6.2.2 Explosives Trace Detectors Market Dynamics by Region – 2012-2020
6.2.3 Explosives Trace Detectors Market Share by Region – 2011-2020
6.3 North America Aviation Security Explosives Trace Detectors Market – 2011-2020
6.4 Latin America Explosives Trace Detectors Market – 2011-2020
6.5 Europe Aviation Security Explosives Trace Detectors Market – 2011-2020
6.6 Middle East and Africa Aviation Security Explosives Trace Detectors Market – 2011-2020
6.7 Asia-Pacific Aviation Security Explosives Trace Detectors Market – 2011-2020
7 Global Airport Security: Metal Detectors Market – 2011-2020
7.1 Metal Detectors Market Background
7.2 Global Metal Detectors Market by Region – 2011-2020
7.2.1 Metal Detectors Market by Region – 2011-2020
7.2.2 Metal Detectors Market Dynamics by Region – 2012-2020
7.2.3 Metal Detectors Market Share by Region – 2011-2020
7.3 North America Metal Detectors Market – 2011-2020
7.4 Latin America Metal Detectors Market – 2011-2020
7.5 Europe Metal Detectors Market – 2011-2020
7.6 Middle East and Africa Metal Detectors Market – 2011-2020
7.7 Asia-Pacific Metal Detectors Market – 2011-2020
8 Global Airport Security: Liquid Explosives Detectors Market – 2011-2020
8.1 Liquid Explosives Detectors Market Background
8.2 Global Liquid Explosives Detectors Market by Region – 2011-2020
8.2.1 Liquid Explosives Detectors Market by Region – 2011-2020
8.2.2 Liquid Explosives Detectors Market Dynamics by Region – 2012-2020
8.2.3 Liquid Explosives Detectors Market Share by Region – 2011-2020
8.3 North America Liquid Explosives Detectors Market – 2011-2020
8.4 Latin America Liquid Explosives Detectors Market – 2011-2020
8.5 Europe Liquid Explosives Detectors Market – 2011-2020
8.6 Middle East and Africa Liquid Explosives Detectors Market – 2011-2020
8.7 Asia-Pacific Liquid Explosives Detectors Market – 2011-2020
9 Global Aviation Security Shoe Scanners Market – 2011-2020
9.1 Shoe Scanners Market Background
9.2 Global Shoe Scanners Market by Region – 2011-2020
9.2.1 Shoe Scanners Market by Region – 2011-2020
9.2.2 Shoe Scanners Market Dynamics by Region – 2012-2020
9.2.3 Shoe Scanners Market Share by Region – 2011-2020
9.3 North America Shoe Scanners Market – 2011-2020
9.4 Latin America Shoe Scanners Market – 2011-2020
9.5 Europe Shoe Scanners Market – 2011-2020
9.6 Middle East and Africa Shoe Scanners Market – 2011-2020
9.7 Asia-Pacific Shoe Scanners Market – 2011-2020
10 Global Aviation Security Workforce ID Documents Screening Market – 2011-2020
10.1 Workforce ID Documents Screening Background
10.2 Global Workforce ID Documents Screening Systems Market by Region – 2011-2020
10.2.1 Workforce ID Documents Screening by Region – 2011-2020
10.2.2 Workforce ID Documents Screening Dynamics by Region – 2012-2020
10.2.3 Workforce ID Documents Screening Share by Region – 2011-2020
10.3 North America Workforce ID Documents Screening Market – 2011-2020
10.4 Latin America Workforce ID Documents Screening Market – 2011-2020
10.5 Europe Workforce ID Documents Screening Market – 2011-2020
10.6 Middle East and Africa Workforce ID Documents Screening Market – 2011-2020
10.7 Asia-Pacific Workforce ID Documents Screening Market – 2011-2020
11 Global Airports Automated Border Control Market – 2011-2020
11.1 Automated Border Control Market Background
11.2 Global Airports Automated Border Control Market by Region – 2011-2020
11.2.1 Airports Automated Border Control Market by Region – 2011-2020
11.2.2 Automated Border Control Market Automated Border Control market Dynamics by Region – 2012-2020
11.2.3 Automated Border Control Market Share by Region – 2011-2020
11.3 North America Airports Automated Border Control Market – 2011-2020
11.4 Latin America Airports Automated Border Control Market – 2011-2020
11.5 Europe Airports Automated Border Control Market – 2011-2020
11.6 Middle East and Africa Airports Automated Border Control Market – 2011-2020
11.7 Asia-Pacific Airports Automated Border Control Market – 2011-2020
12 Global Airport Security: CCTV & Radar Surveillance Market – 2011-2020
12.1 CCTV & Radar Surveillance Market Background
12.2 Global CCTV & Radar Surveillance Market by Region – 2011-2020
12.2.1 CCTV & Radar Surveillance Market by Region – 2011-2020
12.2.2 CCTV & Radar Surveillance Market Dynamics by Region – 2012-2020
12.2.3 CCTV & Radar Surveillance Market Share by Region – 2011-2020
12.3 North America CCTV & Radar Surveillance Aviation Security Market – 2011-2020
12.4 Latin America CCTV & Radar Surveillance Aviation Security Market – 2011-2020
12.5 Europe CCTV & Radar Surveillance Aviation Security Market – 2011-2020
12.6 Middle East and Africa CCTV & Radar Surveillance Aviation Security Market – 2011-2020
12.7 Asia-Pacific CCTV & Radar Surveillance Aviation Security Market – 2011-2020
13 Global Aviation Security C2/C4ISR Market – 2011-2020
13.1 C2/C4ISR Market Background
13.2 Global C2/C4ISR Market by Region – 2011-2020
13.2.1 C2/C4ISR Market by Region – 2011-2020
13.2.2 C2/C4ISR Market Dynamics by Region – 2012-2020
13.2.3 C2/C4ISR Market Share by Region – 2011-2020
13.3 North America C2/C4ISR Market – 2011-2020
13.4 Latin America C2/C4ISR Market – 2011-2020
13.5 Europe C2/C4ISR Market – 2011-2020
13.6 Middle East and Africa C2/C4ISR Market – 2011-2020
13.7 Asia-Pacific C2/C4ISR Market – 2011-2020
14 Global Airport Perimeter Fencing Market – 2011-2020
14.1 Airport Perimeter Fencing Market Background
14.2 Global Airport Perimeter Fencing Market by Region – 2011-2020
14.2.1 Airport Perimeter Fencing Market by Region – 2011-2020
14.2.2 Airport Perimeter Fencing Market Dynamics by Region – 2012-2020
14.2.3 Airport Perimeter Fencing Market Share by Region – 2011-2020
14.3 North America Airport Perimeter Fencing Market – 2011-2020
14.4 Latin America Airport Perimeter Fencing Market – 2011-2020
14.5 Europe Airport Perimeter Fencing Market – 2011-2020
14.6 Middle East and Africa Airport Perimeter Fencing Market – 2011-2020
14.7 Asia-Pacific Airport Perimeter Fencing Market – 2011-2020
15 Global Aviation Security Multi-modal Security Systems and Other Modalities Market – 2011-2020
15.1 Multi-modal Security Systems and Other Modalities Market Background
15.2 Global Multi-modal Security Systems and Other Modalities Aviation Security Market by Region – 2011-2020
15.2.1 Multi-modal Security Systems and Other Modalities Market by Region – 2011-2020
15.2.2 Multi-modal Security Systems and Other Modalities Market Dynamics by Region – 2012-2020
15.2.3 Multi-modal Security Systems and Other Modalities Market Share by Region – 2011-2020
15.3 North America Multi-modal Security Systems and Other Modalities Aviation Security Market – 2011-2020
15.4 Latin America Multi-modal Security Systems and Other Modalities Aviation Security Market – 2011-2020
15.5 Europe Multi-modal Security Systems and Other Modalities Aviation Security Market – 2011-2020
15.6 Middle East and Africa Multi-modal Security Systems and Other Modalities Aviation Security Market – 2011-2020
15.7 Asia-Pacific Multi-modal Security Systems and Other Modalities Aviation Security Market – 2011-2020
16 Disclaimer & Copyright


[Back to top]

Global Airport Security: Technologies, Industry & Markets – Volume 3

INDUSTRY
1 Aviation Security Industry: Overview
1.1 Economic Turmoil Effects on the Aviation Security Market
1.2 Globalization of the Aviation Security Industry
1.3 Classification of the Aviation Security Market Business & Industrial Activities
1.4 Forces that Shape the Aviation Security Industry & Market
1.5 Aviation Security Vendor – Government Relationship
1.6 Barriers to the Aviation Security Market Entry
1.7 Aviation Security Industry: Supply-Side & Demand-Side Analysis
2 Airport Security Market: Business Models & Strategies
2.1 Variable Economic Conditions
2.2 Airport Security Market Tiers
2.3 Defense Primes & Mega Corporations’ Inroads into the Airport Security Market
2.4 Entry Strategies toward the Airport Security Arena
2.5 Price Elasticity
2.6 Mergers and Acquisitions (M&A)
3 Aviation Security Standards and Regulations
3.1 Aviation Security Standards
3.2 ICAO Airport Security & Safety Regulations
4 Leading Vendors: Profile, Market Products & Contact Info
4.1 Vendors and Product Lines Summary
4.2 American Science and Engineering, Inc.(Now OSI Systems)
4.3 Auto Clear
4.4 ADANI
4.5 Red X Defense
4.6 Syagen Technology
4.7 Thermo Electron Corporation
4.8 Biosensor Applications
4.9 Hitachi
4.1 Scent Detection Technologies
4.11 Ketech Defence
4.12 Mistral Security Inc
4.13 Appealing Market Products , Inc. (API) / ChemSee
4.14 DetectaChem LLC
4.15 Scintrex Trace
4.16 Flir Systems
4.17 Ion Applications Inc
4.18 BAHIA Corp (Sibel Ltd.)
4.19 CEIA
4.2 Fisher Labs
4.21 Brijot Imaging Systems
4.22 TeraView
4.23 ThruVision Systems
4.24 Gilardoni SpA
4.25 L-3 Communications Security & Detection Systems
4.26 QinetiQ Ltd.
4.27 Westminster International Ltd.
4.28 LIXI, Inc
4.29 MilliVision
4.3 MINXRAY, Inc.
4.31 Morpho Detection Inc.
4.32 Nuctech Co. Ltd.
4.33 Rapiscan Security Market Products , Inc.
4.34 Scanna MSC Ltd.
4.35 Smiths Detection
4.36 Vidisco Ltd.
TECHNOLOGIES
5 Aviation Security X-ray Baggage & Cargo Screening: Present & Pipeline Technologies
5.1 Aviation Security X-ray Baggage & Cargo Screening Background
5.2 Aviation Security Explosives Screening Technologies
5.2.1 X-ray Systems – Characteristics
5.2.2 X-ray Systems – Principles of Operation
5.2.3 2D X-ray, EDS and ETD Explosives Detection Technologies – Pros and Cons
5.3 X-ray Baggage & Cargo Screening Present & Pipeline Technologies
5.3.1 Overview
5.3.2 Threat Image Projection (TIP)
5.3.3 Conventional 2D X-ray
5.3.4 Dual Energy X-ray
5.3.5 Variable View X-ray
5.3.6 Quasi 3-D Dual View Dual-Energy X-ray Imaging
5.3.7 TSA “Advanced Technology” (AT) X-ray Systems
5.3.8 Backscatter Screening X-ray
5.3.9 Coherent Scatter X-ray
5.3.10 Cast & Artificial Limbs Screening: X-ray Backscatter Technologies
5.3.11 Fused X-ray and ETD Screening
5.3.12 Fused Baggage X-ray and RFID Screening
5.3.13 Multi-Threat Multi-Modal X-ray Screening
5.3.14 Advanced 2D Coherent X-ray Baggage Screening
5.3.15 Stereoscopic “3D X-ray” Imaging
5.4 Operational Considerations
5.5 X-ray Screening Technologies: Performance Comparison
6 Air Cargo Screening & Technologies
6.1.1 Air Cargo Industry Outlook
6.1.2 Air-Cargo Traffic and Capacity
6.1.3 Trend in Global Air-Freight Traffic by Region
6.1.4 Air Cargo Related Security Risks
6.1.5 Air-Cargo Supply Chain Security
7 Aviation Security Whole Body Scanners (AIT) – Present & Pipeline Technologies
7.1 Passenger Screening Process Using Advanced Imaging Technology
7.2 Whole Body Scanning Present & Pipeline Technologies
7.2.1 X-ray Backscatter AIT Portals
7.2.1.1 Backscatter Imaging Technology – Principles of Operation
7.2.2 Risks/Benefits of X-ray AIT Systems
7.2.3 Active MMWave Whole Body AIT Scanners
7.2.3.1 Principles of Operation
7.2.3.2 MMWave AIT: Techno-Tactical & Economic Considerations
7.2.4 Passive MMWave Whole Body Scanners
7.2.4.1 Principle of Operation
7.2.4.2 System Example: Millivision 350 Portal
7.2.5 Terahertz Whole Body Scanners
7.2.5.1 Terahertz Weapon Detection Portals Technology
7.2.5.2 Terahertz Time Domain Spectroscopy (TTDS) Technology
7.2.6 Comparison of MMWave/Terahertz vs. Backscatter X-ray Portals
7.3 Next Generation AIT
7.3.1 AIT-2 Systems Deployment
7.3.2 Next Generation AIT R&D Program
7.3.3 The DHS S&T Covert “Screen while Walk” Program
7.4 Whole Body Scanning Vendors and Market Products
8 Aviation Security Explosive Detection Systems (EDS) – Present & Pipeline Technologies
8.1 Explosive Detection Systems (EDS): Market Background
8.2 Explosive Detection Systems (EDS): Technologies
8.2.1 EDS Principle of Operation
8.2.2 Hybrid Tomographic EDS & 2D X-ray Screening
8.2.3 Explosive Detection Systems: Throughput
8.2.4 EDS Throughput vs. Price
8.3 EDT & ETD Checked Luggage Screening
8.3.1 EDS-based Screening Systems Deployment Strategy
8.3.2 Coherent X-ray Scatter Based Multi-level Screening
8.3.3 Checked Luggage Covert Testing Procedures
8.4 EDS Technology Outlook – 2015-2020
8.4.1 Advanced Coherent X-ray Scattering EDS
8.4.2 Stationary EDS
8.4.3 EDS Liquid and Homemade Explosives Detection
8.4.4 MagViz Distinguishes Potential-Threat Liquids
8.4.5 Superconducting Quantum Interference Device (SQUID)
8.4.6 Quasi Tomographic EDS – 3D X-ray
9 Aviation Security Explosives Trace Detectors – Present & Pipeline Technologies
9.1 Explosives Trace Detectors: Market background
9.2 ETD Technologies
9.2.1 Explosive Materials
9.2.2 ETD Principles of Operation
9.2.3 ETD Core Technologies
9.2.4 Ion Mobility Spectroscopy (IMS)
9.2.5 ChemiLuminescence (CL)
9.2.6 Electron Capture Detectors (ECD)
9.2.7 Surface Acoustic Wave (SAW)
9.3 ETD Devices
9.3.1 Explosives Trace Detectors Configuration
9.3.2 Hand-held & Desktop ETD Devices
9.3.2.1 Sample Collection Methods
9.3.3 Desktop and Portable ETD Devices – Technology Challenges
9.3.4 Hand-held, Desktop ETD – Cost Performance Analysis
9.3.5 ETD Vendors, Market Products & Prices
9.3.6 TD Alarm Resolution
9.4 ETD Technology Outlook – 2015-2020
9.4.1 ETD of the Future: Techno-Tactical Challenges
9.4.2 ETD of the Future: Performance & Operational Goals
9.4.3 Advanced Sample Collection
9.4.4 Dual Technology ETD
9.4.5 Nano Technology Systems
9.4.6 ETD MicroChemLab on a Chip
9.4.7 Coated Micro-Cantilever ETD Detector
9.4.8 Nanotechnology Platform Based ETD Detector
9.4.9 TSA, Next Generation ETD Technologies R&D
9.4.10 Integrated Explosives, Chemical Warfare and Narcotics Trace Detectors
10 Aviation Security Metal Detectors – Present & Pipeline Technologies
10.1 Metal Detectors Market Background
10.2 Metal Detectors Technologies
10.3 Hand-held Metal Detectors
10.3.1 Hand-held Metal Detectors – Vendors
10.4 Walk-through Metal Detection Portals
10.4.1 Introduction
10.4.2 Walk-through Electromagnetic Portals: Glossary
10.4.3 Overview
10.4.4 Walk-through Metal-Detection Portals: Principles of Operation
10.4.5 Walk-through Metal Detection Portals Throughput
10.4.6 Walk-through Metal Detection Portals – Vendors, Market Products & Prices
11 Aviation Security Liquid Explosives Detectors – Present & Pipeline Technologies
11.1 Liquid Explosives Screening Background
11.2 Liquid Explosives Scanners
11.3 Liquid Explosives Screening
11.4 DHS’s SENSIT Program
11.5 Liquid Detection: Techno-Tactical Considerations
11.6 Liquid Explosives Scanners – Vendors, Market Products and Prices
12 Aviation Security Shoe Scanners – Present & Pipeline Technologies
12.1 Shoe Scanners Market Background
12.2 Shoe Scanners Technologies
12.3 Shoe Scanners: Vendors, Market Products and Prices
13 Airport Workforce & Visitors ID Documents Screening Systems – Present & Pipeline Technologies
13.1 Airport Workforce and Visitors Identification Market
13.1.1 Airport Workforce and Visitors Identification Market Drivers
13.1.2 Airport Workforce and Visitors Identification Market Inhibitors
13.2 Fused Biometric, Document Authentication and Interrogation Portals
14 Airport Automated Border Control – Present & Pipeline Technologies
14.1 Airport Automated Border Control Market Background
14.2 The Concept of Airport Automated Border Control
14.3 Function of Airport Automated Border Control
15 Airport CCTV & RADAR Surveillance – Present & Pipeline Technologies
15.1 Airport CCTV Surveillance
15.2 Airport Surface Movement Radar
15.2.1 Airport Surface Movement Radar Technology
15.2.2 Digital Airport Surveillance Radar (DASR) Technology
16 Aviation Security C2/C4ISR Systems – Present & Pipeline Technologies
16.1 Aviation Security C2/C4ISR Market Background
16.2 Aviation Security C2/C4ISR Technologies
17 Aviation Security ICT & Cybersecurity – Present & Pipeline Technologies
17.1 Security-related Aviation ICT Market & Technology
17.2 Civil Aviation Related Cybersecurity
17.2.1 Cyber Terror & Crime
17.2.2 Denial of Aviation Service
17.2.3 Deliberate Manipulation of Aviation Sector Information
17.2.4 Detection of Unauthorized Aviation Cyber Activity
17.2.5 Key Cyber Security Vendors
18 Airport Perimeter Fencing – Present & Pipeline Technologies
18.1 Airport Perimeter Security Market Background
18.1.1 Airport Perimeter Security Technology Market Background
18.1.2 Airport Perimeter Security Challenges
18.1.3 Airport Perimeter Security: Risk Management
18.2 Perimeter Security Technologies
18.2.1 Intrusion Detection Sensors
18.2.2 Multi-layered Airport Perimeter Security
18.2.3 Multi-Sensor Airport Perimeter Security Fusion
18.2.4 Airport Perimeter: CCTV Surveillance
18.2.5 Automatic Perimeter: Intrusion Assessment
18.2.6 Airport Perimeter Security: Command and Control
18.2.7 Airport Perimeter Security: Communications
18.2.8 Airport Perimeter Security: Command and Control Systems
18.2.9 Pipeline Technologies
19 Aviation Security Workforce & Visitors ID Documents Screening – Present & Pipeline Technologies
19.1 Biometric ID Systems
19.2 Biometric ID Challenges
20 Airport Security-related Baggage Handling Systems (BHS) – Present & Pipeline Technologies
20.1 Security-related Airport Baggage Handling Systems (BHS)
20.2 Checked Luggage Configurations
20.2.1 High-Volume In-Line Checked Luggage BHS Systems
20.2.2 Checked Luggage Configuration 2: Medium-Volume In-Line BHS
20.2.3 Checked Luggage BHS Configuration 3: Mini In-Line Checked Luggage Screening System
20.2.4 Checked Luggage BHS Configuration 4: Stand-Alone EDS
21 Multi-modal Aviation Security Systems and Other Modalities – Present & Pipeline Technologies
21.1 Multi-Modal & Multi-Threat Screening Portals
21.1.1 Multi-modal Aviation Security Systems: Overview
21.1.2 Multi-modal Aviation Security Systems: Technology Status
21.1.3 Multi-modal Aviation Security: Core Technologies
21.1.4 Example: Detection Systems Fusion Protocol (DSFP)
21.1.5 Market Needs
21.1.6 HSRC High Throughput Multi-Threat People Screening Portal Vision
21.2 Qylatron Multi-Modal Multi Threat Automated Screening Checkpoint
21.2.1 Future People Screening Portals – Technology Essentials
21.3 Future Multi-Threat Detection Technologies
21.3.1 Molecularly Imprinted Polymer (MIP) Sensors
21.3.2 MOS-Based Electro-Chemical Sensor Networks
21.3.3 Future Shoe Scanners
21.3.4 Hand-held Weapons and CBRNE Detectors
21.3.5 Evolving Hand-held MMWave Wand – Sample
22 Counter – MANPAD Technology
22.1 MANPAD Threats
22.2 Counter – MANPAD Strategies
22.3 Counter – MANPAD Technologies
22.3.1 Flare-based Countermeasures
22.3.2 Directed Infrared Countermeasures (DIRCM) systems
22.4 Civilian Aviation Security Counter MANPAD RDT&E Programs
22.5 MANPAD Market Forecast
APPENDICES
23 Appendix A: IATA & ICAO “Checkpoint of the Future”
23.1 Present People Screening Checkpoint Performance
23.2 IATA-ICAO Checkpoint of the Future
24 Appendix B: Airport Passenger Screening Checkpoints
25 Appendix C: IATA Passenger Growth Forecast
25.1 Forecast Summary
25.2 Future Growth Trend Highlights
25.3 Analysis of the 10 Largest Air Passenger Markets
25.4 Growth by Regions
25.5 Domestic Air Passengers Market Trends
25.6 Global Passenger Demand Drivers
26 Appendix D: Abbreviations
27 The Report Research Methodology
27.1 Report Structure
27.2 Assumptions
27.3 Research Methodology
27.4 For Whom is this Report Intended?
27.5 Research Methods
27.6 Terms of Reference
28 Disclaimer & Copyright

Tables

[Click here for Figures]

3 Volumes:

Global Airport Security: Technologies, Industry & Markets – Volume 1

Global Airport Security: Technologies, Industry & Markets – Volume 2

Global Airport Security: Technologies, Industry & Markets – Volume 3


Global Airport Security: Technologies, Industry & Markets – Volume 1

Table 1 Global Airport Security Market Size [$M] by Region – 2011-2020
Table 2 Global Airport Security Market Size [$M] by Technology – 2011-2020
Table 3 Aviation Security Market – Competitive Analysis
Table 4 Global Airport Security Market Size [$M] by Region – 2011-2020
Table 5 Global Airport Security Market AGR [%] by Region – 2011-2020
Table 6 Global Airport Security Market Share [%] by Region – 2011-2020
Table 7 Global Airport Security Market Size [$M] by Technology – 2011-2020
Table 8 Global Airport Security Market AGR [%] by Technology – 2011-2020
Table 9 Global Airport Security Market Share [%] by Technology – 2011-2020
Table 10 TSA Passengers and Baggage Installed Base [Units] and Procurement Plans Statistics by Modality.
Table 11 U.S. Passenger Screening Statistics [M] by 501 Airports
Table 12 U.S. Airport Security Market Size [$M] by Revenue Segment – 2011-2020
Table 13 U.S. Airport Security Market AGR [%] by Revenue Segment – 2011-2020
Table 14 U.S. Airport Security Market Share [%] by Revenue Segment – 2011-2020
Table 15 Canada Passenger Screening Statistics [M] by 20 Airports
Table 16 Canada Airport Security Market Size [$M] by Revenue Segment – 2011-2020
Table 17 Canada Airport Security Market AGR [%] by Revenue Segment – 2011-2020
Table 18 Canada Airport Security Market Share [%] by Revenue Segment – 2011-2020
Table 19 Mexico Passenger Screening Statistics [M] by 50 Airports
Table 20 Mexico Airport Security Market Size [$M] by Revenue Segment – 2011-2020
Table 21 Mexico Airport Security Market AGR [%] by Revenue Segment – 2011-2020
Table 22 Mexico Airport Security Market Share [%] by Revenue Segment – 2011-2020
Table 23 Colombia Passenger Screening Statistics [M] by 15 Airports
Table 24 Colombia Airport Security Market Size [$M] by Revenue Segment – 2011-2020
Table 25 Colombia Airport Security Market AGR [%] by Revenue Segment – 2011-2020
Table 26 Colombia Airport Security Market Share [%] by Revenue Segment – 2011-2020
Table 27 Brazil Passenger Screening Statistics [M] by 41 Airports
Table 28 Brazil Airport Security Market Size [$M] by Revenue Segment – 2011-2020
Table 29 Brazil Airport Security Market AGR [%] by Revenue Segment – 2011-2020
Table 30 Brazil Airport Security Market Share [%] by Revenue Segment – 2011-2020
Table 31 Argentina Passenger Screening Statistics [M] by Airports
Table 32 Argentina Airport Security Market Size [$M] by Revenue Segment – 2011-2020
Table 33 Argentina Airport Security Market AGR [%] by Revenue Segment – 2011-2020
Table 34 Argentina Airport Security Market Share [%] by Revenue Segment – 2011-2020
Table 35 UK Passenger Screening Statistics [M] by 38 Airports
Table 36 UK Airport Security Market Size [$M] by Revenue Segment – 2011-2020
Table 37 UK Airport Security Market AGR [%] by Revenue Segment – 2011-2020
Table 38 UK Airport Security Market Share [%] by Revenue Segment – 2011-2020
Table 39 Sweden Passenger Screening Statistics [M] by 24 Airports
Table 40 Sweden Airport Security Market Size [$M] by Revenue Segment – 2011-2020
Table 41 Sweden Airport Security Market AGR [%] by Revenue Segment – 2011-2020
Table 42 Sweden Airport Security Market Share [%] by Revenue Segment – 2011-2020
Table 43 Denmark Passenger Screening Statistics [M] by 7 Airports
Table 44 Denmark Airport Security Market Size [$M] by Revenue Segment – 2011-2020
Table 45 Denmark Airport Security Market AGR [%] by Revenue Segment – 2011-2020
Table 46 Denmark Airport Security Market Share [%] by Revenue Segment – 2011-2020
Table 47 Netherlands Passenger Screening Statistics [M] by 5 Airports
Table 48 Netherlands Airport Security Market Size [$M] by Revenue Segment – 2011-2020
Table 49 Netherlands Airport Security Market AGR [%] by Revenue Segment – 2011-2020
Table 50 Netherlands Airport Security Market Share [%] by Revenue Segment – 2011-2020
Table 51 Belgium Passenger Screening Statistics [M] by 5 Airports
Table 52 Belgium Airport Security Market Size [$M] by Revenue Segment – 2011-2020
Table 53 Belgium Airport Security Market AGR [%] by Revenue Segment – 2011-2020
Table 54 Belgium Airport Security Market Share [%] by Revenue Segment – 2011-2020
Table 55 Germany Passenger Screening Statistics [M] by 26 Airports
Table 56 Germany Airport Security Market Size [$M] by Revenue Segment – 2011-2020
Table 57 Germany Airport Security Market AGR [%] by Revenue Segment – 2011-2020
Table 58 Germany Airport Security Market Share [%] by Revenue Segment – 2011-2020
Table 59 France Passenger Screening Statistics [M] by 57 Airports
Table 60 France Airport Security Market Size [$M] by Revenue Segment – 2011-2020
Table 61 France Airport Security Market AGR [%] by Revenue Segment – 2011-2020
Table 62 France Airport Security Market Share [%] by Revenue Segment – 2011-2020
Table 63 Spain Passenger Screening Statistics [M] by 30 Airports
Table 64 Spain Airport Security Market Size [$M] by Revenue Segment – 2011-2020
Table 65 Spain Airport Security Market AGR [%] by Revenue Segment – 2011-2020
Table 66 Spain Airport Security Market Share [%] by Revenue Segment – 2011-2020
Table 67 Italy Passenger Screening Statistics [M] by 31 Airports
Table 68 Italy Airport Security Market Size [$M] by Revenue Segment – 2011-2020
Table 69 Italy Airport Security Market AGR [%] by Revenue Segment – 2011-2020
Table 70 Italy Airport Security Market Share [%] by Revenue Segment – 2011-2020
Table 71 Austria Passenger Screening Statistics [M] by 40 Airports
Table 72 Austria Airport Security Market Size [$M] by Revenue Segment – 2011-2020
Table 73 Austria Airport Security Market AGR [%] by Revenue Segment – 2011-2020
Table 74 Austria Airport Security Market Share [%] by Revenue Segment – 2011-2020
Table 75 Prague Airport Passenger Screening Statistics [M] – 2011-2014
Table 76 Czech Republic Airport Security Market Size [$M] by Revenue Segment – 2011-2020
Table 77 Czech Republic Airport Security Market AGR [%] by Revenue Segment – 2011-2020
Table 78 Czech Republic Airport Security Market Share [%] by Revenue Segment – 2011-2020
Table 79 Poland Passenger Screening Statistics [M] by 11 Airports
Table 80 Poland Airport Security Market Size [$M] by Revenue Segment – 2011-2020
Table 81 Poland Airport Security Market AGR [%] by Revenue Segment – 2011-2020
Table 82 Poland Airport Security Market Share [%] by Revenue Segment – 2011-2020
Table 83 Russia Passenger Screening Statistics [M] by 58 Airports
Table 84 Russia Airport Security Market Size [$M] by Revenue Segment – 2011-2020
Table 85 Russia Airport Security Market AGR [%] by Revenue Segment – 2011-2020
Table 86 Russia Airport Security Market Share [%] by Revenue Segment – 2011-2020
Table 87 Turkey Passenger Screening Statistics [M] by 36 Airports
Table 88 Turkey Airport Security Market Size [$M] by Revenue Segment – 2011-2020
Table 89 Turkey Airport Security Market AGR [%] by Revenue Segment – 2011-2020
Table 90 Turkey Airport Security Market Share [%] by Revenue Segment – 2011-2020
Table 91 Israel Airport Passenger Screening Data [M]
Table 92 Israel Airport Security Market Size [$M] by Revenue Segment – 2011-2020
Table 93 Israel Airport Security Market AGR [%] by Revenue Segment – 2011-2020
Table 94 Israel Airport Security Market Share [%] by Revenue Segment – 2011-2020
Table 95 Saudi Arabia Passenger Screening Statistics [M] by 4 Airports
Table 96 Saudi Arabia Airport Security Market Size [$M] by Revenue Segment – 2011-2020
Table 97 Saudi Arabia Airport Security Market AGR [%] by Revenue Segment – 2011-2020
Table 98 Saudi Arabia Airport Security Market Share [%] by Revenue Segment – 2011-2020
Table 99 UAE Passenger Screening Statistics [M] by 3 Airports
Table 100 UAE Airport Security Market Size [$M] by Revenue Segment – 2011-2020
Table 101 UAE Airport Security Market AGR [%] by Revenue Segment – 2011-2020
Table 102 UAE Airport Security Market Share [%] by Revenue Segment – 2011-2020
Table 103 Doha Airport Passenger Screening Statistics [M]
Table 104 Qatar Airport Security Market Size [$M] by Revenue Segment – 2011-2020
Table 105 Qatar Airport Security Market AGR [%] by Revenue Segment – 2011-2020
Table 106 Qatar Airport Security Market Share [%] by Revenue Segment – 2011-2020
Table 107 Kuwait Airport Passenger Screening Statistics [M]
Table 108 Kuwait Airport Security Market Size [$M] by Revenue Segment – 2011-2020
Table 109 Kuwait Airport Security Market AGR [%] by Revenue Segment – 2011-2020
Table 110 Kuwait Airport Security Market Share [%] by Revenue Segment – 2011-2020
Table 111 Iraq Passenger Screening Statistics [M] by Airports
Table 112 Iraq Airport Security Market Size [$M] by Revenue Segment – 2011-2020
Table 113 Iraq Airport Security Market AGR [%] by Revenue Segment – 2011-2020
Table 114 Iraq Airport Security Market Share [%] by Revenue Segment – 2011-2020
Table 115 Nigeria Passenger Screening Statistics [M] by 12 Airports
Table 116 Nigeria Airport Security Market Size [$M] by Revenue Segment – 2011-2020
Table 117 Nigeria Airport Security Market AGR [%] by Revenue Segment – 2011-2020
Table 118 Nigeria Airport Security Market Share [%] by Revenue Segment – 2011-2020
Table 119 South Africa Passenger Screening Statistics [M] by 9 Airports
Table 120 South Africa Airport Security Market Size [$M] by Revenue Segment – 2011-2020
Table 121 South Africa Airport Security Market AGR [%] by Revenue Segment – 2011-2020
Table 122 South Africa Airport Security Market Share [%] by Revenue Segment – 2011-2020
Table 123 Passenger Screening Statistics [M] in Baku Airport
Table 124 Azerbaijan Airport Security Market Size [$M] by Revenue Segment – 2011-2020
Table 125 Azerbaijan Airport Security Market AGR [%] by Revenue Segment – 2011-2020
Table 126 Azerbaijan Airport Security Market Share [%] by Revenue Segment – 2011-2020
Table 127 Kazakhstan Airport Passengers Screening Statistics [M]
Table 128 Kazakhstan Airport Security Market Size [$M] by Revenue Segment – 2011-2020
Table 129 Kazakhstan Airport Security Market AGR [%] by Revenue Segment – 2011-2020
Table 130 Kazakhstan Airport Security Market Share [%] by Revenue Segment – 2011-2020
Table 131 Pakistan Passenger Screening Statistics [M] by 8 Airports
Table 132 Pakistan Airport Security Market Size [$M] by Revenue Segment – 2011-2020
Table 133 Pakistan Airport Security Market AGR [%] by Revenue Segment – 2011-2020
Table 134 Pakistan Airport Security Market Share [%] by Revenue Segment – 2011-2020
Table 135 India Passenger Screening Statistics [M] by 46 Airports – 2013-2014
Table 136 India Airport Security Market Size [$M] by Revenue Segment – 2011-2020
Table 137 India Airport Security Market AGR [%] by Revenue Segment – 2011-2020
Table 138 India Airport Security Market Share [%] by Revenue Segment – 2011-2020
Table 139 China Passenger Screening Statistics [M] by 100 Airports
Table 140 China Airport Security Market Size [$M] by Revenue Segment – 2011-2020
Table 141 China Airport Security Market AGR [%] by Revenue Segment – 2011-2020
Table 142 China Airport Security Market Share [%] by Revenue Segment – 2011-2020
Table 143 Taiwan Passenger Screening Statistics [M] by 6 Airports
Table 144 Taiwan Airport Security Market Size [$M] by Revenue Segment – 2011-2020
Table 145 Taiwan Airport Security Market AGR [%] by Revenue Segment – 2011-2020
Table 146 Taiwan Airport Security Market Share [%] by Revenue Segment – 2011-2020
Table 147 South Korea Passenger Screening Statistics [M] by 13 Airports
Table 148 South Korea Airport Security Market Size [$M] by Revenue Segment – 2011-2020
Table 149 South Korea Airport Security Market AGR [%] by Revenue Segment – 2011-2020
Table 150 South Korea Airport Security Market Share [%] by Revenue Segment – 2011-2020
Table 151 Japan Passenger Screening Statistics [M] by 50 Airports
Table 152 Japan Airport Security Market Size [$M] by Revenue Segment – 2011-2020
Table 153 Japan Airport Security Market AGR [%] by Revenue Segment – 2011-2020
Table 154 Japan Airport Security Market Share [%] by Revenue Segment – 2011-2020
Table 155 Changi Airport Passenger Screening [M]
Table 156 Singapore Airport Security Market Size [$M] by Revenue Segment – 2011-2020
Table 157 Singapore Airport Security Market AGR [%] by Revenue Segment – 2011-2020
Table 158 Singapore Airport Security Market Share [%] by Revenue Segment – 2011-2020
Table 159 Malaysia Passenger Screening Statistics [M] by 18 Airports
Table 160 Malaysia Airport Security Market Size [$M] by Revenue Segment – 2011-2020
Table 161 Malaysia Airport Security Market AGR [%] by Revenue Segment – 2011-2020
Table 162 Malaysia Airport Security Market Share [%] by Revenue Segment – 2011-2020
Table 163 Indonesia Passenger Screening Statistics [M] by 33 Airports
Table 164 Indonesia Airport Security Market Size [$M] by Revenue Segment – 2011-2020
Table 165 Indonesia Airport Security Market AGR [%] by Revenue Segment – 2011-2020
Table 166 Indonesia Airport Security Market Share [%] by Revenue Segment – 2011-2020
Table 167 Australia Passenger Screening Statistics [M] by 20 Airports
Table 168 Australia Airport Security Market Size [$M] by Revenue Segment – 2011-2020
Table 169 Australia Airport Security Market AGR [%] by Revenue Segment – 2011-2020
Table 170 Australia Airport Security Market Share [%] by Revenue Segment – 2011-2020


[Back to top]

Global Airport Security: Technologies, Industry & Markets – Volume 2

Table 1 Global Baggage & Cargo X-ray Scanners Aviation Security Market Size [$M] by Region – 2011-2020
Table 2 Global Baggage & Cargo X-ray Scanners Aviation Security Market AGR [%] by Region – 2011-2020
Table 3 Global Baggage & Cargo X-ray Scanners Aviation Security Market Share [%] by Region – 2011-2020
Table 4 North America Baggage & Cargo X-ray Scanners Aviation Security Market Size [$M], AGR [%] and Market Share [%] – 2011-2020
Table 5 Latin America Baggage & Cargo X-ray Scanners Market Size [$M], AGR [%] and Market Share [%] – 2011-2020
Table 6 Europe Baggage & Cargo X-ray Scanners Market Size [$M], AGR [%] and Market Share [%] – 2011-2020
Table 7 Middle East and Africa Baggage & Cargo X-ray Scanners Market Size [$M], AGR [%] and Market Share [%] – 2011-2020
Table 8 Asia-Pacific Baggage & Cargo X-ray Scanners Market Size [$M], AGR [%] and Market Share [%] – 2011-2020
Table 9 Global Aviation Security Related ICT & Cybersecurity Market Size [$M] by Region – 2011-2020
Table 10 Global Aviation Security Related ICT & Cybersecurity Market AGR [%] by Region – 2011-2020
Table 11 Global Aviation Security Related ICT & Cybersecurity Market Share [%] by Region – 2011-2020
Table 12 North America Security Related ICT & Cybersecurity Market Size [$M], AGR [%] and Market Share [%] – 2011-2020
Table 13 Latin America Security Related ICT & Cybersecurity Market Size [$M], AGR [%] and Market Share [%] – 2011-2020
Table 14 Europe Security Related ICT & Cybersecurity Market Size [$M], AGR [%] and Market Share [%] – 2011-2020
Table 15 Middle East and Africa Security Related ICT & Cybersecurity Market Size [$M], AGR [%] and Market Share [%] – 2011-2020
Table 16 Asia-Pacific Security Related ICT & Cybersecurity Market Size [$M], AGR [%] and Market Share [%] – 2011-2020
Table 17 Global Whole Body Scanners (AIT) Market Size [$M] by Region – 2011-2020
Table 18 Global Whole Body Scanners (AIT) Market AGR [%] by Region – 2011-2020
Table 19 Global Whole Body Scanners (AIT) Market Share [%] by Region – 2011-2020
Table 20 North America Whole Body Scanners (AIT) Market Size [$M], AGR [%] and Market Share [%] – 2011-2020
Table 21 Latin America Whole Body Scanners (AIT) Market Size [$M], AGR [%] and Market Share [%] – 2011-2020
Table 22 Europe Whole Body Scanners (AIT) Market Size [$M], AGR [%] and Market Share [%] – 2011-2020
Table 23 Middle East and Africa Whole Body Scanners (AIT) Market Size [$M], AGR [%] and Market Share [%] – 2011-2020
Table 24 Asia-Pacific Whole Body Scanners (AIT) Market Size [$M], AGR [%] and Market Share [%] – 2011-2020
Table 25 Global Airport Explosive Detection Systems Market Size [$M] by Region – 2011-2020
Table 26 Global Airport Explosive Detection Systems Market AGR [%] by Region – 2011-2020
Table 27 Global Airport Explosive Detection Systems Market Share [%] by Region – 2011-2020
Table 28 North America Airport Explosive Detection Systems Market Size [$M], AGR [%] and Market Share [%] – 2011-2020
Table 29 Latin America Airport Explosive Detection Systems Market Size [$M], AGR [%] and Market Share [%] – 2011-2020
Table 30 Europe Airport Explosive Detection Systems Market Size [$M], AGR [%] and Market Share [%] – 2011-2020
Table 31 Middle East and Africa Airport Explosive Detection Systems Market Size [$M], AGR [%] and Market Share [%] – 2011-2020
Table 32 Asia-Pacific Airport Explosive Detection Systems Market Size [$M], AGR [%] and Market Share [%] – 2011-2020
Table 33 Global Aviation Security Related Baggage Handling Systems (BHS) Market Size [$M] by Region – 2011-2020
Table 34 Global Aviation Security Related Baggage Handling Systems (BHS) Market AGR [%] by Region – 2011-2020
Table 35 Global Aviation Security Related Baggage Handling Systems (BHS) Market Share [%] by Region – 2011-2020
Table 36 North America Security Related Baggage Handling Systems (BHS) Market Size [$M], AGR [%] and Market Share [%] – 2011-2020
Table 37 Latin America Security Related Baggage Handling Systems (BHS) Market Size [$M], AGR [%] and Market Share [%] – 2011-2020
Table 38 Europe Security Related Baggage Handling Systems (BHS) Market Size [$M], AGR [%] and Market Share [%] – 2011-2020
Table 39 Middle East and Africa Security Related Baggage Handling Systems (BHS) Market Size [$M], AGR [%] and Market Share [%] – 2011-2020
Table 40 Asia-Pacific Security Related Baggage Handling Systems (BHS) Market Size [$M], AGR [%] and Market Share [%] – 2011-2020
Table 41 Global Explosives Trace Detectors Market Size [$M] by Region – 2011-2020
Table 42 Global Explosives Trace Detectors Market AGR [%] by Region – 2011-2020
Table 43 Global Explosives Trace Detectors Market Share [%] by Region – 2011-2020
Table 44 North America Explosives Trace Detectors Market Size [$M], AGR [%] and Market Share [%] – 2011-2020
Table 45 Latin America Explosives Trace Detectors Market Size [$M], AGR [%] and Market Share [%] – 2011-2020
Table 46 Europe Explosives Trace Detectors Market Size [$M], AGR [%] and Market Share [%] – 2011-2020
Table 47 Middle East and Africa Explosives Trace Detectors Market Size [$M], AGR [%] and Market Share [%] – 2011-2020
Table 48 Asia-Pacific Explosives Trace Detectors Market Size [$M], AGR [%] and Market Share [%] – 2011-2020
Table 49 Global Metal Detectors Market Size [$M] by Region – 2011-2020
Table 50 Global Metal Detectors Market AGR [%] by Region – 2011-2020
Table 51 Global Metal Detectors Market Share [%] by Region – 2011-2020
Table 52 North America Metal Detectors Market Size [$M], AGR [%] and Market Share [%] – 2011-2020
Table 53 Latin America Metal Detectors Market Size [$M], AGR [%] and Market Share [%] – 2011-2020
Table 54 Europe Metal Detectors Market Size [$M], AGR [%] and Market Share [%] – 2011-2020
Table 55 Middle East and Africa Metal Detectors Market Size [$M], AGR [%] and Market Share [%] – 2011-2020
Table 56 Asia-Pacific Metal Detectors Market Size [$M], AGR [%] and Market Share [%] – 2011-2020
Table 57 Global Liquid Explosives Detectors Market Size [$M] by Region – 2011-2020
Table 58 Global Liquid Explosives Detectors Market AGR [%] by Region – 2011-2020
Table 59 Global Liquid Explosives Detectors Market Share [%] by Region – 2011-2020
Table 60 North America Liquid Explosives Detectors Market Size [$M], AGR [%] and Market Share [%] – 2011-2020
Table 61 Latin America Liquid Explosives Detectors Market Size [$M], AGR [%] and Market Share [%] – 2011-2020
Table 62 Europe Liquid Explosives Detectors Market Size [$M], AGR [%] and Market Share [%] – 2011-2020
Table 63 Middle East and Africa Liquid Explosives Detectors Market Size [$M], AGR [%] and Market Share [%] – 2011-2020
Table 64 Asia-Pacific Liquid Explosives Detectors Market Size [$M], AGR [%] and Market Share [%] – 2011-2020
Table 65 Global Shoe Scanners Market Size [$M] by Region – 2011-2020
Table 66 Global Shoe Scanners Market AGR [%] by Region – 2011-2020
Table 67 Global Shoe Scanners Market Share [%] by Region – 2011-2020
Table 68 North America Shoe Scanners Market Size [$M], AGR [%] and Market Share [%] – 2011-2020
Table 69 Latin America Shoe Scanners Market Size [$M], AGR [%] and Market Share [%] – 2011-2020
Table 70 Europe Shoe Scanners Market Size [$M], AGR [%] and Market Share [%] – 2011-2020
Table 71 Middle East and Africa Shoe Scanners Market Size [$M], AGR [%] and Market Share [%] – 2011-2020
Table 72 Asia-Pacific Shoe Scanners Market Size [$M], AGR [%] and Market Share [%] – 2011-2020
Table 73 Global Workforce ID Documents Screening Systems Market Size [$M] by Region – 2011-2020
Table 74 Global Workforce ID Documents Screening Systems Market AGR [%] by Region – 2011-2020
Table 75 Global Workforce ID Documents Screening Systems Market Share [%] by Region – 2011-2020
Table 76 North America Workforce ID Documents Screening Systems Market Size [$M], AGR [%] and Market Share [%] – 2011-2020
Table 77 Latin America Workforce ID Documents Screening Systems Market Size [$M], AGR [%] and Market Share [%] – 2011-2020
Table 78 Europe Workforce ID Documents Screening Systems Market Size [$M], AGR [%] and Market Share [%] – 2011-2020
Table 79 Middle East and Africa Workforce ID Documents Screening Systems Market Size [$M], AGR [%] and Market Share [%] – 2011-2020
Table 80 Asia-Pacific Workforce ID Documents Screening Systems Market Size [$M], AGR [%] and Market Share [%] – 2011-2020
Table 81 Global Airports Automated Border Control Market Size [$M] by Region – 2011-2020
Table 82 Global Airports Automated Border Control Market AGR [%] by Region – 2011-2020
Table 83 Global Airports Automated Border Control Market Share [%] by Region – 2011-2020
Table 84 North America Airports Automated Border Control Market Size [$M], AGR [%] and Market Share [%] – 2011-2020
Table 85 Latin America Airports Automated Border Control Market Size [$M], AGR [%] and Market Share [%] – 2011-2020
Table 86 Europe Airports Automated Border Control Market Size [$M], AGR [%] and Market Share [%] – 2011-2020
Table 87 Middle East and Africa Airports Automated Border Control Market Size [$M], AGR [%] and Market Share [%] – 2011-2020
Table 88 Asia-Pacific Airports Automated Border Control Market Size [$M], AGR [%] and Market Share [%] – 2011-2020
Table 89 Global CCTV & Radar Surveillance Market Size [$M] by Region – 2011-2020
Table 90 Global CCTV & Radar Surveillance Market AGR [%] by Region – 2011-2020
Table 91 Global CCTV & Radar Surveillance Market Share [%] by Region – 2011-2020
Table 92 North America CCTV & Radar Surveillance Market Size [$M], AGR [%] and Market Share [%] – 2011-2020
Table 93 Latin America CCTV & Radar Surveillance Market Size [$M], AGR [%] and Market Share [%] – 2011-2020
Table 94 Europe CCTV & Radar Surveillance Market Size [$M], AGR [%] and Market Share [%] – 2011-2020
Table 95 Middle East and Africa CCTV & Radar Surveillance Market Size [$M], AGR [%] and Market Share [%] – 2011-2020
Table 96 Asia-Pacific CCTV & Radar Surveillance Market Size [$M], AGR [%] and Market Share [%] – 2011-2020
Table 97 Global C2/C4ISR Systems Market Size [$M] by Region – 2011-2020
Table 98 Global C2/C4ISR Systems Market AGR [%] by Region – 2011-2020
Table 99 Global C2/C4ISR Systems Market Share [%] by Region – 2011-2020
Table 100 North America C2/C4ISR Systems Market Size [$M], AGR [%] and Market Share [%] – 2011-2020
Table 101 Latin America C2/C4ISR Systems Market Size [$M], AGR [%] and Market Share [%] – 2011-2020
Table 102 Europe C2/C4ISR Systems Market Size [$M], AGR [%] and Market Share [%] – 2011-2020
Table 103 Middle East and Africa C2/C4ISR Systems Market Size [$M], AGR [%] and Market Share [%] – 2011-2020
Table 104 Asia-Pacific C2/C4ISR Systems Market Size [$M], AGR [%] and Market Share [%] – 2011-2020
Table 105 Global Airport Perimeter Fencing Market Size [$M] by Region – 2011-2020
Table 106 Global Airport Perimeter Fencing Market AGR [%] by Region – 2011-2020
Table 107 Global Airport Perimeter Fencing Market Share [%] by Region – 2011-2020
Table 108 North America Airport Perimeter Fencing Market Size [$M], AGR [%] and Market Share [%] – 2011-2020
Table 109 Latin America Airport Perimeter Fencing Market Size [$M], AGR [%] and Market Share [%] – 2011-2020
Table 110 Europe Airport Perimeter Fencing Market Size [$M], AGR [%] and Market Share [%] – 2011-2020
Table 111 Middle East and Africa Airport Perimeter Fencing Market Size [$M], AGR [%] and Market Share [%] – 2011-2020
Table 112 Asia-Pacific Airport Perimeter Fencing Market Size [$M], AGR [%] and Market Share [%] – 2011-2020
Table 113 Global Multi-modal Security Systems and Other Modalities Market Size [$M] by Region – 2011-2020
Table 114 Global Multi-modal Security Systems and Other Modalities Market AGR [%] by Region – 2011-2020
Table 115 Global Multi-modal Security Systems and Other Modalities Market Share [%] by Region – 2011-2020
Table 116 North America Multi-modal Security Systems and Other Modalities Market Size [$M], AGR [%] and Market Share [%] – 2011-2020
Table 117 Latin America Multi-modal Security Systems and Other Modalities Market Size [$M], AGR [%] and Market Share [%] – 2011-2020
Table 118 Europe Multi-modal Security Systems and Other Modalities Market Size [$M], AGR [%] and Market Share [%] – 2011-2020
Table 119 Middle East and Africa Multi-modal Security Systems and Other Modalities Market Size [$M], AGR [%] and Market Share [%] – 2011-2020 [%] – 2011-2020
Table 120 Asia-Pacific Multi-modal Security Systems and Other Modalities Market Size [$M], AGR [%] and Market Share [%] – 2011-2020


[Back to top]

Global Airport Security: Technologies, Industry & Markets – Volume 3

Table 1 People Screening Vendors and Product Lines
Table 2 EDS, ETD and 2D X-ray Technologies – Pros and Cons
Table 3 Pros and Cons of Multi-Modal X-ray Technology
Table 4 Comparison of X-ray Detection Technologies
Table 5 Backscatter People Screening AIT Portals – Advantages & Disadvantages
Table 6 Backscatter Body X-ray Dose vs. Other Common Radiation Exposure Sources
Table 7 MMWave Reflectivity of Basic Explosives and Human Tissue
Table 8 Examples of Object Emissivity
Table 9 Active MMWave Screening: Advantages & Disadvantages
Table 10 Whole Body Scanners: Market Products, Vendors and Technologies
Table 11 Product Comparison of High-Volume EDS Machines
Table 12 Trace vs. Bulk Explosives Detection Technologies
Table 13 Trace Explosive Detection Technologies
Table 14 Trace Detection – Pros and Cons
Table 15 Hand-held Trace Explosives Detectors – IMS & GC/IMS Price & Performance Comparison
Table 16 TSA Approved Tabletop ETD Systems Performance: by Market Products
Table 17 Eight Desktop ETD Systems: Vendors, Market Products, Technology & Prices
Table 18 Portable – Swab ETD: Vendors, Market Products, Technology and Prices
Table 19 Hand-held ETD Systems: Vendors, Market Products, Technology and Prices
Table 20 Trace Detection Document Scanners
Table 21 Potential ETD Machines-Equipment Assumptions
Table 22 Magnetism and Detection Capabilities
Table 23 Conductivity and Detection Capabilities
Table 24 50 Metal Detection Portals: Market Products, Vendors, and Prices
Table 25 Liquid Explosives Scanners – Vendors/Market Products /Prices
Table 26 Shoe Scanners: Vendors, Market Products & Prices
Table 27 Perimeter Security Technologies Performance, Device Cost, Installation & Aftersales Costs Comparison

Figures

3 Volumes:

Global Airport Security: Technologies, Industry & Markets – Volume 1

Global Airport Security: Technologies, Industry & Markets – Volume 2

Global Airport Security: Technologies, Industry & Markets – Volume 3


[Back to top]

Global Airport Security: Technologies, Industry & Markets – Volume 1

Figure 1 Airport Perimeter Security Infrastructure
Figure 2 Airport Perimeter & Terminal Security Areas
Figure 3 A Multi-lane People Screening Site
Figure 4 Airport Security Layers
Figure 5 IATA Outlook of an Airport Passengers Security Screening Infrastructure
Figure 6 Future of Aviation Security
Figure 7 Aviation Security Layers of Security
Figure 8 Airport Passengers Screening – Segments
Figure 9 Airport Terminal Screening Infrastructure
Figure 10 Global Airport Security Market Size [$M] by Region – 2011-2020
Figure 11 Global Airport Security Market Share [%] by Region – 2011-2020
Figure 12 Global Airport Security Market Size [$M] by Technology – 2011-2020
Figure 13 Global Airport Security Market Share [%] by Technology – 2011-2020
Figure 14 TSA – Organizational Structure
Figure 15 U.S. Airport Security Market Size [$M] by Revenue Segment – 2011-2020
Figure 16 U.S. Airport Security Market AGR [%] by Revenue Segment – 2011-2020
Figure 17 U.S. Airport Security Market Share [%] by Revenue Segment – 2011-2020
Figure 18 Canada Aviation Security Organogram
Figure 19 Canada Aviation Security: Key Data
Figure 20 Layers of Canadian Aviation Security
Figure 21 Canada Airports Screened Passengers
Figure 22 Canada Aviation Security Mandated Activities
Figure 23 Canada Airport Security Market Size [$M] by Revenue Segment – 2011-2020
Figure 24 Canada Airport Security Market AGR [%] by Revenue Segment – 2011-2020
Figure 25 Canada Airport Security Market Share [%] by Revenue Segment – 2011-2020
Figure 26 Mexico Airport Security Market Size [$M] by Revenue Segment – 2011-2020
Figure 27 Mexico Airport Security Market AGR [%] by Revenue Segment – 2011-2020
Figure 28 Mexico Airport Security Market Share [%] by Revenue Segment – 2011-2020
Figure 29 Colombia Annual Passenger Traffic
Figure 30 Colombia Airport Security Market Size [$M] by Revenue Segment – 2011-2020
Figure 31 Colombia Airport Security Market AGR [%] by Revenue Segment – 2011-2020
Figure 32 Colombia Airport Security Market Share [%] by Revenue Segment – 2011-2020
Figure 33 Passengers [M] to & from Brazil Airports
Figure 34 Brazil Airport Security Market Size [$M] by Revenue Segment – 2011-2020
Figure 35 Brazil Airport Security Market AGR [%] by Revenue Segment – 2011-2020
Figure 36 Brazil Airport Security Market Share [%] by Revenue Segment – 2011-2020
Figure 37 Passengers Statistics [M] to & from Argentina Airports
Figure 38 Argentina Airport Security Market Size [$M] by Revenue Segment – 2011-2020
Figure 39 Argentina Airport Security Market AGR [%] by Revenue Segment – 2011-2020
Figure 40 Argentina Airport Security Market Share [%] by Revenue Segment – 2011-2020
Figure 41 UK Air Passenger Demand 2010 & 2040
Figure 42 UK Air Passengers by Contribution Sources
Figure 43 UK Passengers Share [%] by Airport
Figure 44 UK Airport Security Market Size [$M] by Revenue Segment – 2011-2020
Figure 45 UK Airport Security Market AGR [%] by Revenue Segment – 2011-2020
Figure 46 UK Airport Security Market Share [%] by Revenue Segment – 2011-2020
Figure 47 Sweden Airport Security Market Size [$M] by Revenue Segment – 2011-2020
Figure 48 Sweden Airport Security Market AGR [%] by Revenue Segment – 2011-2020
Figure 49 Sweden Airport Security Market Share [%] by Revenue Segment – 2011-2020
Figure 50 Denmark Airport Security Market Size [$M] by Revenue Segment – 2011-2020
Figure 51 Denmark Airport Security Market AGR [%] by Revenue Segment – 2011-2020
Figure 52 Denmark Airport Security Market Share [%] by Revenue Segment – 2011-2020
Figure 53 Amsterdam Annual Passengers Statistics [M]
Figure 54 Netherlands (w/o AMS) Annual Passengers Statistics [M]
Figure 55 Netherlands Airport Security Market Size [$M] by Revenue Segment – 2011-2020
Figure 56 Netherlands Airport Security Market AGR [%] by Revenue Segment – 2011-2020
Figure 57 Netherlands Airport Security Market Share [%] by Revenue Segment – 2011-2020
Figure 58 Belgium Airport Security Market Size [$M] by Revenue Segment – 2011-2020
Figure 59 Belgium Airport Security Market AGR [%] by Revenue Segment – 2011-2020
Figure 60 Belgium Airport Security Market Share [%] by Revenue Segment – 2011-2020
Figure 61 Germany Airport Security Market Size [$M] by Revenue Segment – 2011-2020
Figure 62 Germany Airport Security Market AGR [%] by Revenue Segment – 2011-2020
Figure 63 Germany Airport Security Market Share [%] by Revenue Segment – 2011-2020
Figure 64 France Airport Security Market Size [$M] by Revenue Segment – 2011-2020
Figure 65 France Airport Security Market AGR [%] by Revenue Segment – 2011-2020
Figure 66 France Airport Security Market Share [%] by Revenue Segment – 2011-2020
Figure 67 Spain Airport Security Market Size [$M] by Revenue Segment – 2011-2020
Figure 68 Spain Airport Security Market AGR [%] by Revenue Segment – 2011-2020
Figure 69 Spain Airport Security Market Share [%] by Revenue Segment – 2011-2020
Figure 70 Italy Airport Security Market Size [$M] by Revenue Segment – 2011-2020
Figure 71 Italy Airport Security Market AGR [%] by Revenue Segment – 2011-2020
Figure 72 Italy Airport Security Market Share [%] by Revenue Segment – 2011-2020
Figure 73 Passengers Statistics [M] to & from Austria Airports 1996-2013
Figure 74 Austria Airport Security Market Size [$M] by Revenue Segment – 2011-2020
Figure 75 Austria Airport Security Market AGR [%] by Revenue Segment – 2011-2020
Figure 76 Austria Airport Security Market Share [%] by Revenue Segment – 2011-2020
Figure 77 Air Passengers [M] per Month
Figure 78 Czech Republic Airport Security Market Size [$M] by Revenue Segment – 2011-2020
Figure 79 Czech Republic Airport Security Market AGR [%] by Revenue Segment – 2011-2020
Figure 80 Czech Republic Airport Security Market Share [%] by Revenue Segment – 2011-2020
Figure 81 Airport Passenger Growth [%] in Poland
Figure 82 Airport Passenger Traffic in Poland 2011-2013
Figure 83 Poland Airport Security Market Size [$M] by Revenue Segment – 2011-2020
Figure 84 Poland Airport Security Market AGR [%] by Revenue Segment – 2011-2020
Figure 85 Poland Airport Security Market Share [%] by Revenue Segment – 2011-2020
Figure 86 Russia Airport Security Market Size [$M] by Revenue Segment – 2011-2020
Figure 87 Russia Airport Security Market AGR [%] by Revenue Segment – 2011-2020
Figure 88 Russia Airport Security Market Share [%] by Revenue Segment – 2011-2020
Figure 89 Turkey Airport Security Market Size [$M] by Revenue Segment – 2011-2020
Figure 90 Turkey Airport Security Market AGR [%] by Revenue Segment – 2011-2020
Figure 91 Turkey Airport Security Market Share [%] by Revenue Segment – 2011-2020
Figure 92 Israel Airport Security Market Size [$M] by Revenue Segment – 2011-2020
Figure 93 Israel Airport Security Market AGR [%] by Revenue Segment – 2011-2020
Figure 94 Israel Airport Security Market Share [%] by Revenue Segment – 2011-2020
Figure 95 Saudi Arabia Passengers Traffic per Annum [M]
Figure 96 Saudi Arabia Airport Security Market Size [$M] by Revenue Segment – 2011-2020
Figure 97 Saudi Arabia Airport Security Market AGR [%] by Revenue Segment – 2011-2020
Figure 98 Saudi Arabia Airport Security Market Share [%] by Revenue Segment – 2011-2020
Figure 99 UAE Airport Security Market Size [$M] by Revenue Segment – 2011-2020
Figure 100 UAE Airport Security Market AGR [%] by Revenue Segment – 2011-2020
Figure 101 UAE Airport Security Market Share [%] by Revenue Segment – 2011-2020
Figure 102 Doha Airport – Monthly Passengers Statistics [M]
Figure 103 Qatar Airport Security Market Size [$M] by Revenue Segment – 2011-2020
Figure 104 Qatar Airport Security Market AGR [%] by Revenue Segment – 2011-2020
Figure 105 Qatar Airport Security Market Share [%] by Revenue Segment – 2011-2020
Figure 106 Kuwait Airport Security Market Size [$M] by Revenue Segment – 2011-2020
Figure 107 Kuwait Airport Security Market AGR [%] by Revenue Segment – 2011-2020
Figure 108 Kuwait Airport Security Market Share [%] by Revenue Segment – 2011-2020
Figure 109 Iraq Airport Security Market Size [$M] by Revenue Segment – 2011-2020
Figure 110 Iraq Airport Security Market AGR [%] by Revenue Segment – 2011-2020
Figure 111 Iraq Airport Security Market Share [%] by Revenue Segment – 2011-2020
Figure 112 Nigeria Airport Security Market Size [$M] by Revenue Segment – 2011-2020
Figure 113 Nigeria Airport Security Market AGR [%] by Revenue Segment – 2011-2020
Figure 114 Nigeria Airport Security Market Share [%] by Revenue Segment – 2011-2020
Figure 115 South Africa Airport Security Market Size [$M] by Revenue Segment – 2011-2020
Figure 116 South Africa Airport Security Market AGR [%] by Revenue Segment – 2011-2020
Figure 117 South Africa Airport Security Market Share [%] by Revenue Segment – 2011-2020
Figure 118 Passengers [M] to & from Azerbaijan Baku Airport
Figure 119 Azerbaijan Airport Security Market Size [$M] by Revenue Segment – 2011-2020
Figure 120 Azerbaijan Airport Security Market AGR [%] by Revenue Segment – 2011-2020
Figure 121 Azerbaijan Airport Security Market Share [%] by Revenue Segment – 2011-2020
Figure 122 Kazakhstan Airport Security Market Size [$M] by Revenue Segment – 2011-2020
Figure 123 Kazakhstan Airport Security Market AGR [%] by Revenue Segment – 2011-2020
Figure 124 Kazakhstan Airport Security Market Share [%] by Revenue Segment – 2011-2020
Figure 125 Pakistan Airport Security Market Size [$M] by Revenue Segment – 2011-2020
Figure 126 Pakistan Airport Security Market AGR [%] by Revenue Segment – 2011-2020
Figure 127 Pakistan Airport Security Market Share [%] by Revenue Segment – 2011-2020
Figure 128 India Airports Passengers Statistics
Figure 129 India Airport Security Market Size [$M] by Revenue Segment – 2011-2020
Figure 130 India Airport Security Market AGR [%] by Revenue Segment – 2011-2020
Figure 131 India Airport Security Market Share [%] by Revenue Segment – 2011-2020
Figure 132 China Airport Security Market Size [$M] by Revenue Segment – 2011-2020
Figure 133 China Airport Security Market AGR [%] by Revenue Segment – 2011-2020
Figure 134 China Airport Security Market Share [%] by Revenue Segment – 2011-2020
Figure 135 Taiwan Airport Security Market Size [$M] by Revenue Segment – 2011-2020
Figure 136 Taiwan Airport Security Market AGR [%] by Revenue Segment – 2011-2020
Figure 137 Taiwan Airport Security Market Share [%] by Revenue Segment – 2011-2020
Figure 138 South Korea Passenger Statistics [M]
Figure 139 South Korea Airport Security Market Size [$M] by Revenue Segment – 2011-2020
Figure 140 South Korea Airport Security Market AGR [%] by Revenue Segment – 2011-2020
Figure 141 South Korea Airport Security Market Share [%] by Revenue Segment – 2011-2020
Figure 142 Japan Airport Security Market Size [$M] by Revenue Segment – 2011-2020
Figure 143 Japan Airport Security Market AGR [%] by Revenue Segment – 2011-2020
Figure 144 Japan Airport Security Market Share [%] by Revenue Segment – 2011-2020
Figure 145 Passengers [M] to & from Changi Airport
Figure 146 Singapore Airport Security Market Size [$M] by Revenue Segment – 2011-2020
Figure 147 Singapore Airport Security Market AGR [%] by Revenue Segment – 2011-2020
Figure 148 Singapore Airport Security Market Share [%] by Revenue Segment – 2011-2020
Figure 149 Malaysia Airport Security Market Size [$M] by Revenue Segment – 2011-2020
Figure 150 Malaysia Airport Security Market AGR [%] by Revenue Segment – 2011-2020
Figure 151 Malaysia Airport Security Market Share [%] by Revenue Segment – 2011-2020
Figure 152 Indonesia Airport Security Market Size [$M] by Revenue Segment – 2011-2020
Figure 153 Indonesia Airport Security Market AGR [%] by Revenue Segment – 2011-2020
Figure 154 Indonesia Airport Security Market Share [%] by Revenue Segment – 2011-2020
Figure 155 Australia Airport Security Market Size [$M] by Revenue Segment – 2011-2020
Figure 156 Australia Airport Security Market AGR [%] by Revenue Segment – 2011-2020
Figure 157 Australia Airport Security Market Share [%] by Revenue Segment – 2011-2020


[Back to top]

Global Airport Security: Technologies, Industry & Markets – Volume 2

Figure 1 Global Baggage & Cargo X-ray Scanners Market Size [$M] by Region – 2011-2020
Figure 2 Global Baggage & Cargo X-ray Scanners Market AGR [%] by Region – 2011-2020
Figure 3 Global Baggage & Cargo X-ray Scanners Market Share [%] by Region – 2011-2020
Figure 4 North America Baggage & Cargo X-ray Scanners Market Size [$M] – 2011-2020
Figure 5 North America Baggage & Cargo X-ray Scanners Market AGR [%] – 2011-2020
Figure 6 Latin America Baggage & Cargo X-ray Scanners Market Size [$M] – 2011-2020
Figure 7 Latin America Baggage & Cargo X-ray Scanners Market AGR [%] – 2011-2020
Figure 8 Europe Baggage & Cargo X-ray Scanners Market Size [$M] – 2011-2020
Figure 9 Europe Baggage & Cargo X-ray Scanners Market AGR [%] – 2011-2020
Figure 10 Middle East and Africa Baggage & Cargo X-ray Scanners Market Size [$M] – 2011-2020
Figure 11 Middle East and Africa Baggage & Cargo X-ray Scanners Market AGR [%] – 2011-2020
Figure 12 Asia-Pacific Baggage & Cargo X-ray Scanners Market Size [$M] – 2011-2020
Figure 13 Asia-Pacific Baggage & Cargo X-ray Scanners Market AGR [%] – 2011-2020
Figure 14 Global Aviation Security Related ICT & Cybersecurity Market Size [$M] by Region – 2011-2020
Figure 15 Global Aviation Security Related ICT & Cybersecurity Market AGR [%] by Region – 2011-2020
Figure 16 Global Aviation Security Related ICT & Cybersecurity Market Share [%] by Region – 2011-2020
Figure 17 North America Security Related ICT & Cybersecurity Market Size [$M] – 2011-2020
Figure 18 North America Security Related ICT & Cybersecurity Market AGR [%] – 2011-2020
Figure 19 Latin America Security Related ICT & Cybersecurity Market Size [$M] – 2011-2020
Figure 20 Latin America Security Related ICT & Cybersecurity Market AGR [%] – 2011-2020
Figure 21 Europe Security Related ICT & Cybersecurity Market Size [$M] – 2011-2020
Figure 22 Europe Security Related ICT & Cybersecurity Market AGR [%] – 2011-2020
Figure 23 Middle East and Africa Security Related ICT & Cybersecurity Market Size [$M] – 2011-2020
Figure 24 Middle East and Africa Security Related ICT & Cybersecurity Market AGR [%] – 2011-2020
Figure 25 Asia-Pacific Security Related ICT & Cybersecurity Market Size [$M] – 2011-2020
Figure 26 Asia-Pacific Security Related ICT & Cybersecurity Market AGR [%] – 2011-2020
Figure 27 Global Whole Body Scanners (AIT) Market Size [$M] by Region – 2011-2020
Figure 28 Global Whole Body Scanners (AIT) Market AGR [%] by Region – 2011-2020
Figure 29 Global Whole Body Scanners (AIT) Market Share [%] by Region – 2011-2020
Figure 30 North America Whole Body Scanners (AIT) Market Size [$M] – 2011-2020
Figure 31 North America Whole Body Scanners (AIT) Market AGR [%] – 2011-2020
Figure 32 Latin America Whole Body Scanners (AIT) Market Size [$M] – 2011-2020
Figure 33 Latin America Whole Body Scanners (AIT) Market AGR [%] – 2011-2020
Figure 34 Europe Whole Body Scanners (AIT) Market Size [$M] – 2011-2020
Figure 35 Europe Whole Body Scanners (AIT) Market AGR [%] – 2011-2020
Figure 36 Middle East and Africa Whole Body Scanners (AIT) Market Size [$M] – 2011-2020
Figure 37 Middle East and Africa Whole Body Scanners (AIT) Market AGR [%] – 2011-2020
Figure 38 Asia-Pacific Whole Body Scanners (AIT) Market Size [$M] – 2011-2020
Figure 39 Asia-Pacific Whole Body Scanners (AIT) Market AGR [%] – 2011-2020
Figure 40 Global Airport Explosive Detection Systems Market Size [$M] by Region – 2011-2020
Figure 41 Global Airport Explosive Detection Systems Market AGR [%] by Region – 2011-2020
Figure 42 Global Airport Explosive Detection Systems Market Share [%] by Region – 2011-2020
Figure 43 North America Airport Explosive Detection Systems Market Size [$M] – 2011-2020
Figure 44 North America Airport Explosive Detection Systems Market AGR [%] – 2011-2020
Figure 45 Latin America Airport Explosive Detection Systems Market Size [$M] – 2011-2020
Figure 46 Latin America Airport Explosive Detection Systems Market AGR [%] – 2011-2020
Figure 47 Europe Airport Explosive Detection Systems Market Size [$M] – 2011-2020
Figure 48 Europe Airport Explosive Detection Systems Market AGR [%] – 2011-2020
Figure 49 Middle East and Africa Airport Explosive Detection Systems Market Size [$M] – 2011-2020
Figure 50 Middle East and Africa Airport Explosive Detection Systems Market AGR [%] – 2011-2020
Figure 51 Asia-Pacific Airport Explosive Detection Systems Market Size [$M] – 2011-2020
Figure 52 Asia-Pacific Airport Explosive Detection Systems Market AGR [%] – 2011-2020
Figure 53 Global Aviation Security Related Baggage Handling Systems (BHS) Market Size [$M] by Region – 2011-2020
Figure 54 Global Aviation Security Related Baggage Handling Systems (BHS) Market AGR [%] by Region – 2011-2020
Figure 55 Global Aviation Security Related Baggage Handling Systems (BHS) Market Share [%] by Region – 2011-2020
Figure 56 North America Security Related Baggage Handling Systems (BHS) Market Size [$M] – 2011-2020
Figure 57 North America Security Related Baggage Handling Systems (BHS) Market AGR [%] – 2011-2020
Figure 58 Latin America Security Related Baggage Handling Systems (BHS) Market Size [$M] – 2011-2020
Figure 59 Latin America Security Related Baggage Handling Systems (BHS) Market AGR [%] – 2011-2020
Figure 60 Europe Security Related Baggage Handling Systems (BHS) Market Size [$M] – 2011-2020
Figure 61 Europe Security Related Baggage Handling Systems (BHS) Market AGR [%] – 2011-2020
Figure 62 Middle East and Africa Security Related Baggage Handling Systems (BHS) Market Size [$M] – 2011-2020
Figure 63 Middle East and Africa Security Related Baggage Handling Systems (BHS) Market AGR [%] – 2011-2020
Figure 64 Asia-Pacific Security Related Baggage Handling Systems (BHS) Market Size [$M] – 2011-2020
Figure 65 Asia-Pacific Security Related Baggage Handling Systems (BHS) Market AGR [%] – 2011-2020
Figure 66 Global Explosives Trace Detectors Market Size [$M] by Region – 2011-2020
Figure 67 Global Explosives Trace Detectors Market AGR [%] by Region – 2011-2020
Figure 68 Global Explosives Trace Detectors Market Share [%] by Region – 2011-2020
Figure 69 North America Explosives Trace Detectors Market Size [$M] – 2011-2020
Figure 70 North America Explosives Trace Detectors Market AGR [%] – 2011-2020
Figure 71 Latin America Explosives Trace Detectors Market Size [$M] – 2011-2020
Figure 72 Latin America Explosives Trace Detectors Market AGR [%] – 2011-2020
Figure 73 Europe Explosives Trace Detectors Market Size [$M] – 2011-2020
Figure 74 Europe Explosives Trace Detectors Market AGR [%] – 2011-2020
Figure 75 Middle East and Africa Explosives Trace Detectors Market Size [$M] – 2011-2020
Figure 76 Middle East and Africa Explosives Trace Detectors Market AGR [%] – 2011-2020
Figure 77 Asia-Pacific Explosives Trace Detectors Market Size [$M] – 2011-2020
Figure 78 Asia-Pacific Explosives Trace Detectors Market AGR [%] – 2011-2020
Figure 79 Global Metal Detectors Market Size [$M] by Region – 2011-2020
Figure 80 Global Metal Detectors Market AGR [%] by Region – 2011-2020
Figure 81 Global Metal Detectors Market Share [%] by Region – 2011-2020
Figure 82 North America Metal Detectors Market Size [$M] – 2011-2020
Figure 83 North America Metal Detectors Market AGR [%] – 2011-2020
Figure 84 Latin America Metal Detectors Market Size [$M] – 2011-2020
Figure 85 Latin America Metal Detectors Market AGR [%] – 2011-2020
Figure 86 Europe Metal Detectors Market Size [$M] – 2011-2020
Figure 87 Europe Metal Detectors Market AGR [%] – 2011-2020
Figure 88 Middle East and Africa Metal Detectors Market Size [$M] – 2011-2020
Figure 89 Middle East and Africa Metal Detectors Market AGR [%] – 2011-2020
Figure 90 Asia-Pacific Metal Detectors Market Size [$M] – 2011-2020
Figure 91 Asia-Pacific Metal Detectors Market AGR [%] – 2011-2020
Figure 92 Global Liquid Explosives Detectors Market Size [$M] by Region – 2011-2020
Figure 93 Global Liquid Explosives Detectors Market AGR [%] by Region – 2011-2020
Figure 94 Global Liquid Explosives Detectors Market Share [%] by Region – 2011-2020
Figure 95 North America Liquid Explosives Detectors Market Size [$M] – 2011-2020
Figure 96 North America Liquid Explosives Detectors Market AGR [%] – 2011-2020
Figure 97 Latin America Liquid Explosives Detectors Market Size [$M] – 2011-2020
Figure 98 Latin America Liquid Explosives Detectors Market AGR [%] – 2011-2020
Figure 99 Europe Liquid Explosives Detectors Market Size [$M] – 2011-2020
Figure 100 Europe Liquid Explosives Detectors Market AGR [%] – 2011-2020
Figure 101 Middle East and Africa Liquid Explosives Detectors Market Size [$M] – 2011-2020
Figure 102 Middle East and Africa Liquid Explosives Detectors Market AGR [%] – 2011-2020
Figure 103 Asia-Pacific Liquid Explosives Detectors Market Size [$M] – 2011-2020
Figure 104 Asia-Pacific Liquid Explosives Detectors Market AGR [%] – 2011-2020
Figure 105 Global Shoe Scanners Market Size [$M] by Region – 2011-2020
Figure 106 Global Shoe Scanners Market AGR [%] by Region – 2011-2020
Figure 107 Global Shoe Scanners Market Share [%] by Region – 2011-2020
Figure 108 North America Shoe Scanners Market Size [$M] – 2011-2020
Figure 109 North America Shoe Scanners Market AGR [%] – 2011-2020
Figure 110 Latin America Shoe Scanners Market Size [$M] – 2011-2020
Figure 111 Latin America Shoe Scanners Market AGR [%] – 2011-2020
Figure 112 Europe Shoe Scanners Market Size [$M] – 2011-2020
Figure 113 Europe Shoe Scanners Market AGR [%] – 2011-2020
Figure 114 Middle East and Africa Shoe Scanners Market Size [$M] – 2011-2020
Figure 115 Middle East and Africa Shoe Scanners Market AGR [%] – 2011-2020
Figure 116 Asia-Pacific Shoe Scanners Market Size [$M] – 2011-2020
Figure 117 Asia-Pacific Shoe Scanners Market AGR [%] – 2011-2020
Figure 118 Global Workforce ID Documents Screening Systems Market Size [$M] by Region – 2011-2020
Figure 119 Global Workforce ID Documents Screening Systems Market AGR [%] by Region – 2011-2020
Figure 120 Global Workforce ID Documents Screening Systems Market Share [%] by Region – 2011-2020
Figure 121 North America Workforce ID Documents Screening Systems Market Size [$M] – 2011-2020
Figure 122 North America Workforce ID Documents Screening Systems Market AGR [%] – 2011-2020
Figure 123 Latin America Workforce ID Documents Screening Systems Market Size [$M] – 2011-2020
Figure 124 Latin America Workforce ID Documents Screening Systems Market AGR [%] – 2011-2020
Figure 125 Europe Workforce ID Documents Screening Systems Market Size [$M] – 2011-2020
Figure 126 Europe Workforce ID Documents Screening Systems Market AGR [%] – 2011-2020
Figure 127 Middle East and Africa Workforce ID Documents Screening Systems Market Size [$M] – 2011-2020
Figure 128 Middle East and Africa Workforce ID Documents Screening Systems Market AGR [%] – 2011-2020
Figure 129 Asia-Pacific Workforce ID Documents Screening Systems Market Size [$M] – 2011-2020
Figure 130 Asia-Pacific Workforce ID Documents Screening Systems Market AGR [%] – 2011-2020
Figure 131 Global Airports Automated Border Control Market Size [$M] by Region – 2011-2020
Figure 132 Global Airports Automated Border Control Market AGR [%] by Region – 2011-2020
Figure 133 Global Airports Automated Border Control Market Share [%] by Region – 2011-2020
Figure 134 North America Airports Automated Border Control Market Size [$M] – 2011-2020
Figure 135 North America Airports Automated Border Control Market AGR [%] – 2011-2020
Figure 136 Latin America Airports Automated Border Control Market Size [$M] – 2011-2020
Figure 137 Latin America Airports Automated Border Control Market AGR [%] – 2011-2020
Figure 138 Europe Airports Automated Border Control Market Size [$M] – 2011-2020
Figure 139 Europe Airports Automated Border Control Market AGR [%] – 2011-2020
Figure 140 Middle East and Africa Airports Automated Border Control Market Size [$M] – 2011-2020
Figure 141 Middle East and Africa Airports Automated Border Control Market AGR [%] – 2011-2020
Figure 142 Asia-Pacific Airports Automated Border Control Market Size [$M] – 2011-2020
Figure 143 Asia-Pacific Airports Automated Border Control Market AGR [%] – 2011-2020
Figure 144 Global CCTV & Radar Surveillance Market Size [$M] by Region – 2011-2020
Figure 145 Global CCTV & Radar Surveillance Market AGR [%] by Region – 2011-2020
Figure 146 Global CCTV & Radar Surveillance Market Share [%] by Region – 2011-2020
Figure 147 North America CCTV & Radar Surveillance Market Size [$M] – 2011-2020
Figure 148 North America CCTV & Radar Surveillance Market AGR [%] – 2011-2020
Figure 149 Latin America CCTV & Radar Surveillance Market Size [$M] – 2011-2020
Figure 150 Latin America CCTV & Radar Surveillance Market AGR [%] – 2011-2020
Figure 151 Europe CCTV & Radar Surveillance Market Size [$M] – 2011-2020
Figure 152 Europe CCTV & Radar Surveillance Market AGR [%] – 2011-2020
Figure 153 Middle East and Africa CCTV & Radar Surveillance Market Size [$M] – 2011-2020
Figure 154 Middle East and Africa CCTV & Radar Surveillance Market AGR [%] – 2011-2020
Figure 155 Asia-Pacific CCTV & Radar Surveillance Market Size [$M] – 2011-2020
Figure 156 Asia-Pacific CCTV & Radar Surveillance Market AGR [%] – 2011-2020
Figure 157 Global C2/C4ISR Systems Market Size [$M] by Region – 2011-2020
Figure 158 Global C2/C4ISR Systems Market AGR [%] by Region – 2011-2020
Figure 159 Global C2/C4ISR Systems Market Share [%] by Region – 2011-2020
Figure 160 North America C2/C4ISR Systems Market Size [$M] – 2011-2020
Figure 161 North America C2/C4ISR Systems Market AGR [%] – 2011-2020
Figure 162 Latin America C2/C4ISR Systems Market Size [$M] – 2011-2020
Figure 163 Latin America C2/C4ISR Systems Market AGR [%] – 2011-2020
Figure 164 Europe C2/C4ISR Systems Market Size [$M] – 2011-2020
Figure 165 Europe C2/C4ISR Systems Market AGR [%] – 2011-2020
Figure 166 Middle East and Africa C2/C4ISR Systems Market Size [$M] – 2011-2020
Figure 167 Middle East and Africa C2/C4ISR Systems Market AGR [%] – 2011-2020
Figure 168 Asia-Pacific C2/C4ISR Systems Market Size [$M] – 2011-2020
Figure 169 Asia-Pacific C2/C4ISR Systems Market AGR [%] – 2011-2020
Figure 170 Global Airport Perimeter Fencing Market Size [$M] by Region – 2011-2020
Figure 171 Global Airport Perimeter Fencing Market AGR [%] by Region – 2011-2020
Figure 172 Global Airport Perimeter Fencing Market Share [%] by Region – 2011-2020
Figure 173 North America Airport Perimeter Fencing Market Size [$M] – 2011-2020
Figure 174 North America Airport Perimeter Fencing Market AGR [%] – 2011-2020
Figure 175 Latin America Airport Perimeter Fencing Market Size [$M] – 2011-2020
Figure 176 Latin America Airport Perimeter Fencing Market AGR [%] – 2011-2020
Figure 177 Europe Airport Perimeter Fencing Market Size [$M] – 2011-2020
Figure 178 Europe Airport Perimeter Fencing Market AGR [%] – 2011-2020
Figure 179 Middle East and Africa Airport Perimeter Fencing Market Size [$M] – 2011-2020
Figure 180 Middle East and Africa Airport Perimeter Fencing Market AGR [%] – 2011-2020
Figure 181 Asia-Pacific Airport Perimeter Fencing Market Size [$M] – 2011-2020
Figure 182 Asia-Pacific Airport Perimeter Fencing Market AGR [%] – 2011-2020
Figure 183 Global Multi-modal Security Systems and Other Modalities Market Size [$M] by Region – 2011-2020
Figure 184 Global Multi-modal Security Systems and Other Modalities Market AGR [%] by Region – 2011-2020
Figure 185 Global Multi-modal Security Systems and Other Modalities Market Share [%] by Region – 2011-2020
Figure 186 North America Multi-modal Security Systems and Other Modalities Market Size [$M] – 2011-2020
Figure 187 North America Multi-modal Security Systems and Other Modalities Market AGR [%] – 2011-2020
Figure 188 Latin America Multi-modal Security Systems and Other Modalities Market Size [$M] – 2011-2020
Figure 189 Latin America Multi-modal Security Systems and Other Modalities Market AGR [%] – 2011-2020
Figure 190 Europe Multi-modal Security Systems and Other Modalities Market Size [$M] – 2011-2020
Figure 191 Europe Multi-modal Security Systems and Other Modalities Market AGR [%] – 2011-2020
Figure 192 Middle East and Africa Multi-modal Security Systems and Other Modalities Market Size [$M] – 2011-2020
Figure 193 Middle East and Africa Multi-modal Security Systems and Other Modalities Market AGR [%] – 2011-2020
Figure 194 Asia-Pacific Multi-modal Security Systems and Other Modalities Market Size [$M] – 2011-2020
Figure 195 Asia-Pacific Multi-modal Security Systems and Other Modalities Market AGR [%] – 2011-2020


[Back to top]

Global Airport Security: Technologies, Industry & Markets – Volume 3

Figure 1 Government Industry Aviation Security Life Cycle
Figure 2 Government – Private Sector Aviation Security Techno-Tactical Technology Assessment Process
Figure 3 Aviation Security Industry – Government Relationship
Figure 4 A New Product Technology Assessment Process
Figure 5 Scheme of Multi-Level Protection of a Civil Airport against Acts of Unlawful Interference
Figure 6 Major Explosives Detection Technologies: Bulk vs. Trace
Figure 7 X-ray Conveyor-Based Screening Systems – Principles of Operation
Figure 8 Conventional X-ray
Figure 9 Dual Energy X-ray
Figure 10 Screened Cabin Bag Dual Energy X-ray Image
Figure 11 Material Differentiation by Dual Energy X-ray
Figure 12 Dual Energy Z Map
Figure 13 Variable View X-ray System
Figure 14 Multi-View Dual Energy Baggage X-ray Screening
Figure 15 Convectional 2D Image (Left) vs. Quasi 3D Image (Right)
Figure 16 A Dual View Advanced Technology X-ray System
Figure 17 Backscatter X-ray Technology
Figure 18 Coherent X-ray Technology
Figure 19 Cast and Artificial Limbs Screening System
Figure 20 A Prosthetic Limbs Backscatter Image Showing a Gun Hidden Underneath a Cast
Figure 21 Fused Dual-Modality Explosives & Nuclear Screening System
Figure 22 3D Stereoscopic X-ray Camera and Images
Figure 23 3D Stereoscopic Baggage X-ray Luggage Inspection Scheme
Figure 24 Global Air Cargo Size [Million Tons]: 2001-2020
Figure 25 Air Cargo Supply Chain
Figure 26 Canadian Air-Cargo Security Screening Process
Figure 27 Flow of Cargo from Shipper to Air Carrier
Figure 28 Global Freight Traffic Forecast until 2029
Figure 29 Air-Cargo Container X-ray Screening System
Figure 30 Advanced Imaging Technology Passenger Screening Process
Figure 31 People Backscatter Imaging Technology
Figure 32 Dose Comparison: Environmental Radiation vs. Backscatter Scan
Figure 33 Spectrum of MMWave Technologies
Figure 34 Active MM-Wave Imaging Technology – Block Diagram
Figure 35 MM-Wave AIT Principal of Operation
Figure 36 A Passive MMWave Whole-Body Scanner Layout
Figure 37 Passive MMWave Scanner: Typical Threat Images
Figure 38 Electromagnetic Spectrum of the THz-Region.
Figure 39 Whole-Object EDS Scheme
Figure 40 Tomographic EDS Principle of Operation
Figure 41 EDS Throughput [BPH] vs. System Price [$K]
Figure 42 Checked Baggage Inspection System & Three Levels of Screening
Figure 43 100% Tomographic EDS & ETD Screening Flow Scheme
Figure 44 “Fractional Tomographic EDS & ETS” Screening Flow Scheme
Figure 45 100% Multi-Level (EDS, X-ray & Coherent X-ray Scatter) Screening
Figure 46 Aviation Security: “100% EDS” Screening Flow Scheme
Figure 47 Conventional Rotary Gantry EDS
Figure 48 Stationary Gantry EDS
Figure 49 The RTT Prototype X-ray Source
Figure 50 The RTT EDS Prototype
Figure 51 MagViz Images
Figure 52 ULF-MRI RDT&E Program Timeline
Figure 53 3D Stereoscopic X-ray Camera and Images
Figure 54 3D Stereoscopic X-ray Luggage Inspection Scheme
Figure 55 Explosive Materials Classification
Figure 56 The Most Commonly Used Explosives Classification
Figure 57 Trace Detection General Principle of Operation
Figure 58 Tabletop ETD: Operational Workflow
Figure 59 Explosives Trace Detection Technologies
Figure 60 Ion Mobility Spectroscopy (IMS)
Figure 61 Electron Capture Detectors (ECD)
Figure 62 Surface Acoustic Wave (SAW) Detectors
Figure 63 Explosives Trace Detection Configuration: Hand-held ETD, Tabletop ETD, & Boarding Card Screening ETD
Figure 64 The Airborne Concentration of Various Explosives
Figure 65 Typical Sensitivity of Various Explosive Trace Detection Technologies
Figure 66 Tabletop ETD Devices
Figure 67 SNL – ETD MicroChemLab on a Chip
Figure 68 Components of SNL MicroHound Trace Explosives Detection System
Figure 69 Ames “Conductive CNT Explosives Detector”
Figure 70 Hand-held Weapon Detector – Proper Scanning Path
Figure 71 Walk-through Metal-Detection Portals Technologies
Figure 72 The EU Airport Automated Border Control Concept
Figure 73 Automated Border Control Process
Figure 74 Face Recognition Based Automated Border Control
Figure 75 Airport Surface Movement Radar
Figure 76 Airport Surface Movement Radar Imaging Field
Figure 77 An Airport Security Command, Control & Communication Meta-System
Figure 78 Airport Perimeter Security C2/C4ISR System Topology
Figure 79 Airport Security C2/C4ISR System Block diagram
Figure 80 Airport Emergency Communication: Technologies
Figure 81 Airport Security Communication: Obstacles to Interoperability
Figure 82 The European “Computer Emergency Response Teams & Command Centre” (CERTs .CERT/CCs)
Figure 83 Airport Perimeter Security Systems
Figure 84 Airport Perimeter Security Layers
Figure 85 Dumb Perimeter Barriers
Figure 86 Airport Perimeter
Figure 87 Airport Perimeter Security Infrastructure
Figure 88 Intersection of Risk Assessment
Figure 89 Checked Luggage ETD, EDS & X-ray Screening Configuration 1
Figure 90 Checked Luggage ETD, EDS & X-ray Screening Configuration 2
Figure 91 Schematic Visualization of a Mini in-Line System
Figure 92 Checked Luggage ETD, EDS & X-ray Screening Configuration 3 – Mini In-Line System with Light Integration
Figure 93 Checked Luggage ETD, EDS & X-ray Screening Configuration 4 – Stand-Alone EDS
Figure 94 Artist View of a Checkpoint of the Future
Figure 95 Future Screening Checkpoint (HSRC 2002 Forecast)
Figure 96 Future Multi-Threat People Screening Checkpoint – (HSRC 2002 Concept)
Figure 97 Airport Pre-Screening Program Process
Figure 98 Airport CBP Pre-Screening Systems and Data Flow
Figure 99 Qylatron Multi-Modal Multi Threat Passenger Screening Portal
Figure 100 Fused Technologies – Concealed Weapons Detection
Figure 101 Molecular Imprinting Technique
Figure 102 Map of MANPADS Attacks on Civil Aircraft – 1975-2012
Figure 103 An IR MANPAD View of a Civilian Aircraft
Figure 104 Overview of MANPADS
Figure 105 Flare-based MANPAD Countermeasures
Figure 106 DIRCAM CONOPS
Figure 107 The “Skyshield” Counter MANPADS
Figure 108 BAE Systems & Northrop Grumman Counter MANPAD Systems
Figure 109 Average X-ray Screening Rate [Passengers per Hour] by Region.
Figure 110 The IATA “Checkpoint of the Future” Lanes
Figure 111 IATA “Checkpoint of the Future” Concept
Figure 112 Single Queue Serving Multiple People Screening Checkpoints
Figure 113 A Single Queue Serving Multiple Screening Positions
Figure 114 Two Single Lanes Serving Multiple Screening Positions
Figure 115 Separated Lines in Single Queue Serving Multiple Screening Positions
Figure 116 Checkpoint Staff Allocation

Questions about this report?

Contact Sales: 1-571-527-1010 or Analysts: 1-202-455-0966

  • Have a question about Global Airport Security Market, Technologies & Industry - 2016-2020
    Please fill out all fields in the form below and click "Submit" to send your question.
    Our representative will review your question and contact you with an answer as soon as possible.
  • 2+2=
  • This field is for validation purposes and should be left unchanged.
1
Interested in this report? Need more information?

You may also like…

X
Powered By