Top
HSRCGlobal Homeland Security & Public Safety by Vertical Markets – 2019-2024

Global Homeland Security & Public Safety by Vertical Markets - 2019-2024

2019-2024 Homeland Security Market Analyzed by 16 Vertical Markets 

  • March 2019
  • 312
  • 175
    • 4950 $
    • 5950 $
    • 8950 $
    • 12000 $

    Small Businesses, Startups & Academia - Up to 50% Off

Quantity
IBM
Amazon
Sandia National Lab
HITACHI
Thales
Smiths Detection
Nuctech
Korea Internet & Security Agency
L3Harris
Huawei
Leidos
NEC
Toshiba
Deloitte
MAG

Want to customize this report?

If you purchase this report, you are entitled to a 30% discount towards customizing it, to better fit your market research and strategic needs. Our Custom Research and Industry Insights Department will work with you to better understand your information gaps and strategic needs and will provide you with a tailor-made market research report within a short period of time.

Why Choose Us?

30+ Years of Experience
We are a multidisciplinary team of Transformational Technologies industry experts with over 30 years of experience.
Gold Standard
With over 950 private sector clients (73% repeat customers), including major defense and security vendors, and Forbes Global 2000 companies, HSRC earned the reputation as the industry’s Gold Standard for Transformational Technologies Market Reports.
Tailored Research Services
Provide you with clear, actionable recommendations designed to empower decision making and to help you exploit emerging opportunities in the Transformational Technologies industries.
Information Security
Your personal information is safe and secure.

From: $4,950

SKU: 7608 Category:

Description

Homeland Security Verticals Markets 2019-2024
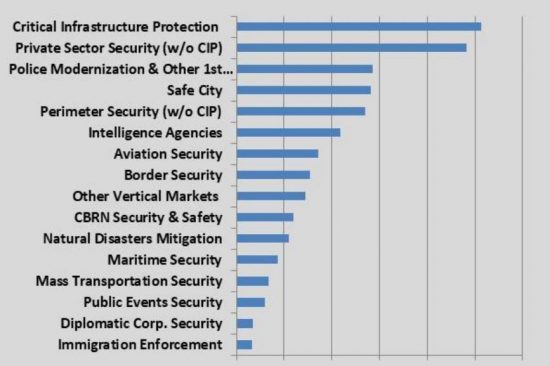
Global HLS & Public Safety 2024 Market Size [$B] by Vertical Market

See also the global version of this report

17 years have passed since 9/11, and the global Public Safety & Homeland Security market, technologies and industry are forecast to go through major shifts. New and maturing technologies, such as artificial intelligence, big data & data analysis, smart sensors, AI-based cybersecurity, 5G, TETRA & LTE emergency communication and AI based video analytics, will create new market segments and fresh business opportunities.

With 312 pages and 70 tables and 105 figures, the new “Global Homeland Security & Public Safety by Vertical Markets – 2019-2024″ report offers for each of its sub-markets 2016-2018 market data and analyses, as well as 2019-2024 forecasts and analyses.

Report Key Findings Include:

  • Aviation Security: This market which was dominated by the U.S. in the past, will be overtaken by China, Europe and the Gulf states during the 2019-2024 period. These regions will combine to a market share of more than 60% of the global revenues of the new aviation security systems and devices.
  • Border Security: illegal immigration, organized crime, smuggling of goods & narcotics, and terror are the main drivers of the land border and maritime security markets growth.
  • Critical Infrastructure: critical infrastructure protection will be 17% of the total market share by 2024; the largest vertical in terms of $ value
  • Public Events Security: is forecast to grow at a 2018-2024 CAGR of 11.4%

Why Buy this Report?

  1. This is the only report that addresses the Homeland Security & Public Safety dual-use markets. 87% of the Homeland Security & Public Safety industry revenues emanate from vertical sectors. For example, Maritime security is used to address both crime, illegal immigration and terror.
  2. Market data analyzed via several key perspectives.
    With a highly fragmented Homeland Security & Public Safety market we address the “Money trail” – each dollar spent via several viewpoints by Vertical Markets including:
  • Aviation security,
  • CBRN & HAZMAT security,
  • Border security,
  • Counter-terror & crime intelligence,
  • Critical infrastructure security,
  • Law enforcement ,
  • 1st responders,
  • Maritime security,
  • Land transportation security,
  • Energy & petro-chemical industry security,
  • Public events security,
  • Commercial & industrial security systems,
  • Safe cities,
  • Diplomatic facilities & personal security,
  • Natural disasters preparation & response and
  • Other vertical HLS & Public Safety markets.
  1. Detailed market analysis frameworks for each of the vertical market sectors, including:
  • Market drivers & inhibitors
  • Business opportunities
  • SWOT analysis
  • Competitive analysis
  • Business environment
  • The 2019-2024 market segmented
  • Technology outlook

Table of Contents

Download TOC as PDF

VERTICAL MARKETS.. 18

1         Global Homeland Security & Public Safety: Vertical Markets. 18

1.1        Global Market – 2017-2024. 18

1.2        Global Market Breakdown – 2017-2024. 20

2         Aviation Security Market 26

2.1        Scope. 26

2.2        Major Findings. 26

2.3        Major Conclusions. 33

2.4        Market Background. 34

2.4.1             Aviation Security Terror Threats. 34

2.4.2             Aviation Security Tactics. 36

2.4.3             IATA Aviation’s Security Policy. 38

2.5        Aviation Security Technologies. 41

2.5.1             Airport Perimeter Security. 41

2.5.2             X-ray Screening. 42

2.5.3             Explosive Detection Systems (EDS) 43

2.5.4             Explosives Trace Detection (ETD) 44

2.5.5             Biological, Radioactive and Nuclear Detection.. 44

2.5.6             Millimeter Wave Imaging. 44

2.5.7             Canine Screening. 44

2.6        Aviation Security Market Demand Side. 45

2.6.1             Airports. 45

2.6.2             Airlines. 45

2.6.3             Freight Forwarders. 45

2.6.4             Customs. 45

2.6.5             Security Service Providers. 46

2.7        Aviation Passenger Screening Technologies Outlook: 2019-2024. 46

2.8        Checked Baggage Screening Market 48

2.9        Counter-MANPAD Market 48

2.10     Air Cargo Screening Technologies & Markets. 49

2.10.1          Air Cargo Security Process. 49

2.10.2          Air Cargo Related Security Risks. 53

2.10.3          Air-Cargo Supply Chain Security. 53

2.11     Airport Perimeter Security Technologies & Markets. 54

2.12     Aviation Security Market Drivers. 55

2.13     Aviation Security Market Inhibitors. 57

2.14     Aviation Security Market Business Opportunities & Challenges. 57

2.15     Aviation Security Market: SWOT Analysis. 59

2.16     Aviation Security Market Competitive Analysis. 60

2.17     Global Aviation Security Market – 2017-2024. 61

2.17.1          Aviation Security Market – 2017-2024. 61

2.17.2          Market Dynamics – 2017-2024. 62

2.17.3          Market Breakdown – 2017-2024. 63

3         Border Security Market 64

3.1        Scope. 64

3.2        Major Findings. 65

3.3        Major Conclusions. 65

3.4        Market Background. 66

3.5        U.S. Border Security: Investments & Trump. 68

3.6        Border Security Market Drivers. 70

3.7        Border Security Market Inhibitors. 71

3.8        Border Security Market Business Opportunities & Challenges. 73

3.8.1             Border Security Market: SWOT Analysis. 75

3.8.2             Border Security Market Barriers to New Entry, Supplier Power, Buyer Power, Barriers to Substitution and Competitive Rivalry. 76

3.9        Global Border Security Market – 2017-2024. 77

3.9.1             Border Security Market – 2017-2024. 77

3.9.2             Market Dynamics – 2017-2024. 78

3.9.3             Market Breakdown – 2017-2024. 79

4         CBRN Security & Safety Market 80

4.1        Scope. 80

4.2        Major Findings & Conclusions. 80

4.3        Market Background. 82

4.3.1             CBRN Incidents: Characteristics and Countermeasures. 82

4.3.2             Biological Weapons. 83

4.3.3             Chemical Weapons. 83

4.3.4             Public Events CBRNE Security. 85

4.3.5             Examples of Use of CBRN Agents. 87

4.3.6             CBRN Control 89

4.3.7             CBRN Security Challenges. 89

4.4        Market Drivers. 90

4.5        Market Inhibitors. 91

4.6        Global CBRN Security & Safety Market – 2017-2024. 92

4.6.1             CBRN Security & Safety Market – 2017-2024. 92

4.6.2             Market Dynamics – 2017-2024. 93

4.6.3             Market Breakdown – 2017-2024. 94

5         Critical Infrastructure Protection Market 95

5.1        Scope. 95

5.2        Major Findings. 97

5.3        Market Background. 97

5.3.1             Critical Infrastructure Security: Threats. 97

5.3.2             Critical Infrastructure Protection Tactics. 98

5.3.3             Critical Infrastructure Vulnerabilities. 99

5.3.4             Planning of Infrastructure Security. 100

5.3.5             Critical Infrastructure Strategy Outlook. 101

5.3.6             Government Role. 101

5.3.7             Information Sharing with the Private Sector 103

5.3.8             Food and Agro-Terror Market Outlook. 104

5.3.9             Global Oil-Gas Industry Security Market 106

5.3.10          Threats to the Oil-Gas Industry. 107

5.4        Critical Infrastructure Protection Market Drivers. 108

5.5        Critical Infrastructure Protection Market Inhibitors. 110

5.6        Business Opportunities. 112

5.7        Critical Infrastructure Protection Market: SWOT Analysis. 114

5.8        Critical Infrastructure Protection Market Barriers to New Entry, Supplier Power, Buyer Power, Barriers to Substitution and Competitive Rivalry. 115

5.9        Global Critical Infrastructure Protection Market – 2017-2024. 116

5.9.1             Critical Infrastructure Protection Market – 2017-2024. 116

5.9.2             Market Dynamics – 2017-2024. 118

5.9.3             Market Breakdown – 2017-2024. 119

6         Diplomatic Corps Security Market 120

6.1        Scope. 120

6.2        Market Background. 120

6.2.1             Personal Protection.. 121

6.2.2             Protection of Facilities. 121

6.3        Diplomatic Corps Security Market: Business Opportunities. 124

6.4        Diplomatic Facilities Security Industry: SWOT Analysis. 125

6.4.1             Strengths. 125

6.4.2             Weaknesses. 125

6.4.3             Opportunities. 126

6.4.4             Threats. 126

6.5        Diplomatic Corps Security Market: Barriers to New Entry, Supplier Power, Buyer Power, Barriers to Substitution and Competitive Rivalry. 127

6.6        Market Drivers. 128

6.7        Market Inhibitors. 128

6.8        Global Diplomatic Corps Security Market – 2017-2024. 129

6.8.1             Diplomatic Corps Security Market – 2017-2024. 129

6.8.2             Market Dynamics – 2017-2024. 130

6.8.3             Market Breakdown – 2017-2024. 131

7         Immigration Enforcement Market 132

7.1        Scope. 132

7.2        Key Findings & Conclusions. 132

7.3        Market Background. 135

7.4        Market Drivers. 136

7.5        Market Inhibitors. 137

7.6        Global Immigration Enforcement Market – 2017-2024. 138

7.6.1             Immigration Enforcement Market – 2017-2024. 138

7.6.2             Market Dynamics – 2017-2024. 139

7.6.3             Market Breakdown – 2017-2024. 140

8         Intelligence Agencies Market 141

8.1        Scope. 141

8.2        Major Findings. 142

8.3        Major Conclusions. 142

8.4        Market Background. 143

8.5        Counter-Terror & Crime Intelligence Market Drivers. 144

8.6        Counter-Terror & Crime Intelligence Market Inhibitors. 145

8.7        Terror & Crime Intelligence Business Opportunities & Challenges. 145

8.8        Counter Terror & Crime Intelligence Market: SWOT Analysis. 149

8.9        Counter Terror & Crime Intelligence Market Barriers to New Entry, Supplier Power, Buyer Power, Barriers to Substitution and Competitive Rivalry. 150

8.10     Intelligence Agencies Market – 2017-2024. 151

8.10.1          Intelligence Agencies Market – 2017-2024. 151

8.10.2          Market Dynamics – 2017-2024. 152

8.10.3          Market Breakdown – 2017-2024. 153

9         Maritime Security Market 154

9.1        Scope. 154

9.2        Major Findings. 154

9.3        Major Conclusions. 156

9.4        Maritime Security Infrastructure. 157

9.5        Port Critical Infrastructure Operations. 160

9.6        Maritime Security Market Drivers. 162

9.7        Maritime Security Market Inhibitors. 164

9.8        Maritime Security Market: Business Opportunities & Challenges. 165

9.9        Maritime Security Market: SWOT Analysis. 167

9.10     Global Maritime Security Market – 2017-2024. 167

9.10.1          Maritime Security Market – 2017-2024. 167

9.10.2          Market Dynamics – 2017-2024. 169

9.10.3          Market Breakdown – 2017-2024. 170

10      Mass Transportation Security Market 171

10.1     Scope. 171

10.2     Mass Transportation Security: Market Background. 171

10.3     The EU SECUR-ED Project 175

10.4     Mass Transportation Security Market: Business Opportunities & Challenges  177

10.5     Global Mass Transportation Security Industry: SWOT Analysis. 178

10.5.1          Strengths. 178

10.5.2          Weaknesses. 179

10.5.3          Opportunities. 179

10.5.4          Threats. 180

10.6     Mass Transportation Security Market: Barriers to New Entry, Supplier Power, Buyer Power, Barriers to Substitution and Competitive Rivalry. 181

10.7     Mass Transportation Security Market Drivers. 182

10.8     Mass Transportation Security Market Inhibitors. 183

10.9     Global Mass Transportation Security Market – 2017-2024. 184

10.9.1          Mass Transportation Security Market – 2017-2024. 184

10.9.2          Market Dynamics – 2017-2024. 185

10.9.3          Market Breakdown – 2017-2024. 186

11      Natural Disasters Mitigation Market 187

11.1     Scope. 187

11.2     Natural Disasters Mitigation & Relief Equipment & Systems: Market Background. 187

11.2.1          Overview.. 187

11.2.2          Natural Disasters 2018. 190

11.2.3          2017 Natural Disasters. 191

11.2.4          How to Protect Against Natural Disasters. 194

11.2.5          Natural Disasters Forecasting. 195

11.2.6          Natural Disasters Rescue & Recovery Equipment: Background. 196

11.2.7          Cities Threatened by Major Damaging Natural Disasters. 198

11.2.8          Private Sector Business Involvement in Natural Disaster Mitigation   199

11.2.9          Natural Disasters Mitigation & Relief Equipment & Systems: Business Opportunities. 201

11.3     Natural Disasters Mitigation & Relief Equipment & Systems Market: SWOT Analysis. 202

11.3.1          Strengths. 202

11.3.2          Weaknesses. 202

11.3.3          Opportunities. 203

11.3.4          Threats. 203

11.4     Natural Disasters Mitigation & Relief Equipment & Systems Market: Barriers to New Entry, Supplier Power, Buyer Power, Barriers to Substitution and Competitive Rivalry. 204

11.5     Market Drivers. 205

11.6     Market Inhibitors. 205

11.7     Global Natural Disasters Mitigation Market – 2017-2024. 206

11.7.1          Natural Disasters Mitigation Market – 2017-2024. 206

11.7.2          Market Dynamics – 2017-2024. 207

11.7.3          Market Breakdown – 2017-2024. 208

12      Perimeter Security Market 209

12.1     Scope. 209

12.2     Major Findings & Conclusions. 209

12.3     Market Background. 211

12.4     Market Drivers. 213

12.5     Market Inhibitors. 214

12.6     Perimeter Security Business Opportunities & Challenges. 215

12.7     Perimeter Security Industry Value Chain. 216

12.7.1          The Perimeter Security Value Chain.. 216

12.7.2          Perimeter Security Industry Primary Activities. 217

12.8     Perimeter Security industry Support Activities. 217

12.9     Perimeter Security Market: Barriers to New Entry, Supplier Power, Buyer Power, Barriers to Substitution and Competitive Rivalry. 218

12.10  2018-2024 Perimeter Security Technology Evolution. 219

12.11  Global Perimeter Security (w/o CIP) Market – 2017-2024. 225

12.11.1       Perimeter Security (w/o CIP) Market – 2017-2024. 225

12.11.2       Market Dynamics – 2017-2024. 226

12.11.3       Market Breakdown – 2017-2024. 227

13      Police Modernization & Other 1st Responders Market 228

13.1     Scope. 228

13.2     Police Modernization & Other 1st Responders: Market Background. 229

13.2.1          Police Modernization Vectors. 233

13.2.2          Law Enforcement Agencies and Police Modernization Funding. 234

13.2.3          Police Modernization & Other 1st Responders Business Opportunities  234

13.3     SWOT Analysis. 238

13.3.1          Strengths. 238

13.3.2          Weaknesses. 239

13.3.3          Opportunities. 240

13.3.4          Threats. 241

13.4     Police Modernization Market: Barriers to New Entry, Supplier Power, Buyer Power, Barriers to Substitution and Competitive Rivalry. 242

13.5     Market Analysis. 243

13.5.1          Market Drivers. 243

13.5.2          Market Inhibitors. 244

13.6     Global Police Modernization & Other 1st Responders Market – 2017-2024  244

13.6.1          Police Modernization & Other 1st Responders Market – 2017-2024  244

13.6.2          Market Dynamics – 2017-2024. 245

13.6.3          Market Breakdown – 2017-2024. 246

14      Private Sector Security (w/o CIP) Market 247

14.1     Scope. 247

14.2     Major Findings. 248

14.3     Major Conclusions. 249

14.4     Market Background. 250

14.5     Commercial & Industrial Security Business Opportunities & Challenges  252

14.6     Private Sector Security Market: SWOT Analysis. 253

14.6.1          Strengths. 253

14.6.2          Weaknesses. 254

14.6.3          Opportunities. 254

14.6.4          Threats. 255

14.7     Private Sector Security Market: Barriers to New Entry, Supplier Power, Buyer Power, Barriers to Substitution and Competitive Rivalry. 256

14.8     Market Drivers. 257

14.9     Market Inhibitors. 257

14.10  Global Private Sector Security (w/o CIP) Market – 2015-2022. 258

14.10.1       Private Sector Security (w/o CIP) Market – 2017-2024. 258

14.10.2       Market Dynamics – 2017-2024. 259

14.10.3       Market Breakdown – 2017-2024. 260

15      Public Events Security Market 261

15.1     Scope. 261

15.2     Public Event Security. 262

15.2.1          Pre-Event Planning. 262

15.2.2          During the Event 262

15.2.3          After the Event 262

15.3     Public Events Security Market Background. 263

15.3.1          Public Events Security: Responsible Bodies. 263

15.3.2          Public Events Security: Intelligence Market Background. 263

15.3.3          Public Events Security: Private Sector Market Background. 264

15.3.4          Communication Interoperability Market Background. 264

15.3.5          Perimeter Security Market Background. 264

15.3.6          Public Events Infrastructure Security Market 265

15.3.7          Public Events Emergency Services Market 265

15.3.8          Public Events WMD and Hazmat Detection and Response Market Background. 265

15.3.9          Public Events Transportation Security Market Background. 268

15.4     Public Events Security Market: Business Opportunities & Challenges. 269

15.5     Public Events Security Market: SWOT Analysis. 270

15.5.1          Strengths. 270

15.5.2          Weaknesses. 271

15.5.3          Opportunities. 271

15.5.4          Threats. 272

15.6     Public Events Security Market: Barriers to New Entry, Supplier Power, Buyer Power, Barriers to Substitution and Competitive Rivalry. 273

15.7     Market Drivers. 274

15.8     Market Inhibitors. 275

15.9     Global Public Events Security Market – 2017-2024. 276

15.9.1          Public Events Security Market – 2017-2024. 276

15.9.2          Market Dynamics – 2017-2024. 277

15.9.3          Market Breakdown – 2017-2024. 278

16      Safe City Market 279

16.1     Scope. 279

16.2     Safe City vs. Smart City. 280

16.2.1          Smart Cities. 280

16.2.2          Safe Cities. 283

16.2.3          Key Technology Markets. 285

16.2.4          Safe City Surveillance Systems Market 286

16.2.5          Safe City Disaster Mitigation Process. 287

16.2.6          Safe City Architecture. 289

16.2.7          Safe City Event Awareness Process. 290

16.2.8          Safe City Planning. 291

16.2.9          Safe City Cost Allocation.. 292

16.2.10       Safe City Communication Networks. 293

16.3     Major Findings. 294

16.4     Safe Cities Business Opportunities. 298

16.5     Safe Cities Market: SWOT Analysis. 299

16.5.1          Strengths. 299

16.5.2          Weaknesses. 300

16.5.3          Opportunities. 300

16.5.4          Threats. 301

16.6     Safe Cities Market: Barriers to New Entry, Supplier Power, Buyer Power, Barriers to Substitution and Competitive Rivalry. 302

16.7     Market Analysis. 303

16.7.1          Market Drivers. 303

16.7.2          Regional Market Drivers for Safe Cities. 304

16.7.3          Market Inhibitors. 306

16.8     Global Safe City Market – 2017-2024. 307

16.8.1          Safe City Market – 2017-2024. 307

16.8.2          Market Dynamics – 2017-2024. 308

16.8.3          Market Breakdown – 2017-2024. 309

17      Other HLS & PS Global Vertical Markets. 310

17.1     Other Vertical Markets – 2017-2024. 310

17.2     Market Dynamics – 2017-2024. 311

17.3     Market Breakdown – 2017-2024. 312
Tables

Table 1 – Global Homeland Security & Public Safety Market Size [$M] by Vertical Market – 2017-2024. 18

Table 2 – Global Homeland Security & Public Safety Market Share [%] by Vertical Market – 2017-2024. 20

Table 3 – Aviation Security Market: Business Opportunities. 58

Table 4 – Aviation Security Market SWOT Analysis. 59

Table 5 – Aviation Security Market: Barriers to New Entry, Supplier Power, Buyer Power, Barriers to Substitution and Competitive Rivalry. 60

Table 6 – Global Aviation Security Market Size [$M] by Revenue Source – 2017-2024  61

Table 7 – Global Aviation Security Market AGRs [%] by Revenue Source – 2017-2024  62

Table 8 – Border Security Market: Business Opportunities Sectors. 73

Table 9 – Border Security Market: SWOT Analysis. 75

Table 10 – Border Security Market – Barriers to New Entry, Supplier Power, Buyer Power, Barriers to Substitution and Competitive Rivalry. 76

Table 11 – Global Border Security Market Size [$M] by Revenue Source – 2017-2024  77

Table 12 – Global Border Security Market AGRs [%] by Revenue Source – 2017-2024  78

Table 13 – Global CBRN Security & Safety Market Size [$M] by Revenue Source – 2017-2024  92

Table 14 – Global CBRN Security & Safety Market AGRs [%] by Revenue Source – 2017-2024. 93

Table 15 – Critical Infrastructure Protection Market: Business Opportunities Sectors  112

Table 16 – 15 Critical Infrastructure Protection Sub-Market Growth Sectors. 113

Table 17 – Critical Infrastructure Protection Market: SWOT Analysis. 114

Table 18 – Critical Infrastructure Protection Market – Barriers to New Entry, Supplier Power, Buyer Power, Barriers to Substitution and Competitive Rivalry. 115

Table 19 – Global Critical Infrastructure Protection Market Size [$M] by Revenue Source – 2017-2024. 116

Table 20 – Global Critical Infrastructure Protection Market AGRs [%] by Revenue Source – 2017-2024. 118

Table 21 – Diplomatic Corps Security Market: Business Opportunities Sectors. 124

Table 22 – Diplomatic Corps Security Market: Barriers to New Entry, Supplier Power, Buyer Power, Barriers to Substitution and Competitive Rivalry. 127

Table 23 – Global Diplomatic Corps Security Market Size [$M] by Revenue Source – 2017-2024. 129

Table 24 – Global Diplomatic Corps Security Market AGRs [%] by Revenue Source – 2017-2024. 130

Table 25 – Global Immigration Enforcement Market Size [$M] by Revenue Source – 2017-2024. 138

Table 26 – Global Immigration Enforcement Market AGRs [%] by Revenue Source – 2017-2024. 139

Table 27 – Counter Terror & Crime Intelligence Market: Business Opportunities. 147

Table 28 – Counter Terror & Crime Intelligence Market: SWOT Analysis. 149

Table 29 – Counter Terror & Crime Intelligence Market – Barriers to New Entry, Supplier Power, Buyer Power, Barriers to Substitution and Competitive Rivalry  150

Table 30 – Intelligence Agencies Market Size [$M] by Revenue Source – 2017-2024  151

Table 31 – Intelligence Agencies Market AGRs [%] by Revenue Source – 2017-2024  152

Table 32 – Maritime Security Market: Business Opportunities. 165

Table 33 – Maritime Security Market SWOT Analysis. 167

Table 34 – Global Maritime Security Market Size [$M] by Revenue Source – 2017-2024  168

Table 35 – Global Maritime Security Market AGRs [%] by Revenue Source – 2017-2024  169

Table 36 – Mass Transportation Security Market: Business Opportunities Sectors. 177

Table 37 – Mass Transportation Security Market: Barriers to New Entry, Supplier Power, Buyer Power, Barriers to Substitution and Competitive Rivalry. 181

Table 38 – Global Mass Transportation Security Market Size [$M] by Revenue Source – 2017-2024. 184

Table 39 – Global Mass Transportation Security Market AGRs [%] by Revenue Source – 2017-2024. 185

Table 40 – Natural Disasters; Search, Rescue and Recovery Equipment & Systems Market: Business Opportunities. 201

Table 41 – Natural Disasters Mitigation & Relief Equipment & Systems Market: Barriers to New Entry, Supplier Power, Buyer Power, Barriers to Substitution and Competitive Rivalry. 204

Table 42 – Global Natural Disasters Mitigation Market Size [$M] by Revenue Source – 2017-2024. 206

Table 43 – Global Natural Disasters Mitigation Market AGRs [%] by Revenue Source – 2017-2024. 207

Table 44 – Perimeter Security Market: Business Opportunities. 215

Table 45 – Global Perimeter Security (w/o CIP) Market Size [$M] by Revenue Source – 2017-2024. 225

Table 46 – Global Perimeter Security (w/o CIP) Market AGRs [%] by Revenue Source – 2017-2024. 226

Table 47 – Ranking of Manmade & Natural Disasters, Crime and Terror Threats  as a Market Driver 233

Table 48 – North America Number of Police Officers & Other 1st Responders by Country  234

Table 49 – Europe Number of Police Officers & Other 1st Responders by Country. 235

Table 50 – Latin America Number of Police Officers & Other 1st Responders  by Country  235

Table 51 – Middle East & Africa Number of Police Officers & Other 1st Responders by Country  236

Table 52 – Asia Pacific Number of Police Officers & Other 1st Responders by Country  236

Table 53 – Police Modernization & Other 1st Responders Market: Business Opportunities  237

Table 54 – Police Modernization & Other 1st Responders Market: Barriers to New Entry, Supplier Power, Buyer Power, Barriers to Substitution and Competitive Rivalry  242

Table 55 – Global Police Modernization & Other 1st Responders Market Size [$M] by Revenue Source – 2017-2024. 244

Table 56 – Global Police Modernization & Other 1st Responders Market AGRs [%] by Revenue Source – 2017-2024. 245

Table 57 – Commercial & Industrial Security Systems Market: Business Opportunities Sectors  252

Table 58 – Private Sector (w/o CIP) Security Market: Barriers to New Entry, Supplier Power, Buyer Power, Barriers to Substitution and Competitive Rivalry. 256

Table 59 – Global Private Sector Security (w/o CIP) Market Size [$M] by Revenue Source – 2017-2024. 258

Table 60 – Global Private Sector Security (w/o CIP) Market AGRs [%] by Revenue Source – 2017-2024. 259

Table 61 – Public Events Security Market: Business Opportunities Sectors. 269

Table 62 – Public Events Security Market: Barriers to New Entry, Supplier Power, Buyer Power, Barriers to Substitution and Competitive Rivalry. 273

Table 63 – Global Public Events Security Market Size [$M] by Revenue Source – 2017-2024  276

Table 64 – Global Public Events Security Market AGRs [%] by Revenue Source – 2017-2024  277

Table 65 – Safe Cities Market: Business Opportunities Sectors. 298

Table 66 – Safe Cities Market: Barriers to New Entry, Supplier Power, Buyer Power, Barriers to Substitution and Competitive Rivalry. 302

Table 67 – Global Safe City Market Size [$M] by Revenue Source – 2017-2024. 307

Table 68 – Global Safe City Market AGRs [%] by Revenue Source – 2017-2024. 308

Table 69 – Other Vertical Markets [$M] by Revenue Source – 2017-2024. 310

Table 70 – Other Vertical Markets AGRs [%] by Revenue Source – 2017-2024. 311

Figures

Figure 1 – Global Homeland Security & Public Safety Market Size [$M] by Vertical Market – 2017-2024. 19

Figure 2 – Global Homeland Security & Public Safety Market Share [%] by Vertical Market – 2017-2024. 21

Figure 3 – Vertical Homeland Security & Public Safety Markets Ranked by 2017 Market Size [$B] 22

Figure 4 – Vertical Homeland Security & Public Safety Markets Ranked by 2024 Market Size [$B] 23

Figure 5 – Vertical Homeland Security & Public Safety Markets Ranked by 2018-2024 CAGR [%] 24

Figure 6 – Vertical Homeland Security & Public Safety Markets Ranked by 2019-2024 cumulative Market [$B] 24

Figure 7 – Homeland Security & Public Safety Vertical Markets – 2017, 2024 [$B] 25

Figure 8 – Airport Screening Infrastructure. 27

Figure 9 – Chinese Airlines Passengers [M] per Annum -1990-2017. 29

Figure 10 – Boeing Global Air Traffic Forecast – 1991-2031. 30

Figure 11 – Checked Luggage in-Line Screening Configuration. 33

Figure 12 – Aviation Security Elements. 34

Figure 13 – Aviation Security Layers. 37

Figure 14 – Aircraft Security – Points of Potential Vulnerability. 38

Figure 15 – IATA Outlook of an Airport Passengers Security Screening Infrastructure  40

Figure 16 – Airport Perimeter Security Infrastructure. 41

Figure 17 – Airport Perimeter & Terminal Security Areas. 42

Figure 18 – An Airport Multi-Lane People Screening Site. 43

Figure 19 – Airport Passengers Screening – Segments. 46

Figure 20 – Multi-Modal People Screening Systems. 47

Figure 21 – Flow of Air Cargo Transported to the United States from Foreign Airports  50

Figure 22 – Global Average Air Cargo Growth [Million Tons]: 2001-2020. 52

Figure 23 – Air Cargo Supply Chain.. 54

Figure 24 – Airport Perimeter Security System.. 55

Figure 25 – Global Aviation Security Market Size [$M] by Revenue Source – 2017-2024  62

Figure 26 – Global Aviation Security Market Shares [%] – 2017-2024. 63

Figure 27 – Land Border Security, Layers of Security. 67

Figure 28 – Border Security Threat Detection Scheme. 68

Figure 29 – Global Border Security Market Size [$M] by Revenue Source – 2017-2024  78

Figure 30 – Global Border Security Market Shares [%] – 2017-2024. 79

Figure 31 – SENTRY CBRN Warning and Decision Support System Concept 81

Figure 32 – EnviScreen Operix 2016 CBRN Monitoring System Software Solution.. 91

Figure 33 – Global CBRN Security & Safety Market Size [$M] by Revenue Source – 2017-2024. 93

Figure 34 – Global CBRN Security & Safety Market Shares [%] – 2017-2024. 94

Figure 35 – Critical Infrastructure Security, Layers of Security. 99

Figure 36 – Critical Infrastructure Investment Priorities Scheme. 102

Figure 37 – A National Critical Infrastructure Protection Infrastructure: The U.S. Example  103

Figure 38 – Global Critical Infrastructure Protection Market Size [$M] by Revenue Source – 2017-2024. 117

Figure 39 – Global Critical Infrastructure Protection Market Shares [%] – 2017-2024  119

Figure 40 – An Embassy Compound Perimeter Security. 121

Figure 41 – Organization of the U.S. Diplomatic Security Agency. 122

Figure 42 – Global Diplomatic Corps Security Market Size [$M] by Revenue Source – 2017-2024. 130

Figure 43 – Global Diplomatic Corps Security Market Shares [%] – 2017-2024. 131

Figure 44 – Video Analytics Modes Used for Border Crossing Surveillance. 133

Figure 45 – Land Border Migration.. 135

Figure 46 – Global Immigration Enforcement Market Size [$M] by Revenue Source – 2017-2024. 139

Figure 47 – Global Immigration Enforcement Market Shares [%] – 2017-2024. 140

Figure 48 – The Intelligence Cycle. 144

Figure 49 – Intelligence Agencies Market Size [$M] by Revenue Source – 2017-2024  152

Figure 50 – Intelligence Agencies Market Shares [%] – 2017-2024. 153

Figure 51 – Maritime Security – Mixed Mode Approach.. 155

Figure 52 – Maritime Security Infrastructure. 158

Figure 53 – Map and List of 154 Countries Committed to Implement the WCO Customs Security Practices. 160

Figure 54 – Partners Involved in Port Operations. 162

Figure 55 – Global Maritime Security Market Size [$M] by Revenue Source – 2017-2024  168

Figure 56 – Global Maritime Security Market Shares [%] – 2017-2024. 170

Figure 57 – Mass Transportation Incident Cycle. 174

Figure 58 – Global Mass Transportation Security Market Size [$M] by Revenue Source – 2017-2024. 185

Figure 59 – Global Mass Transportation Security Market Shares [%] – 2017-2024. 186

Figure 60 – Natural Disasters Declaration Process, the FEMA Example. 188

Figure 61 – A Natural Disaster Activities Cycle. 189

Figure 62 – Disaster Risk Reduction vs. Post-Disaster Spending – 1991-2010. 190

Figure 63 – 2017 Global Natural Disasters Figures. 191

Figure 64 – Number of Natural Disasters in Top 10 Countries. 192

Figure 65 – Global Occurrence by Disaster Type: 2017 Compared to 2007-2016. 193

Figure 66 – Share of Economic Losses by Continent- 2017. 194

Figure 67 – Advanced FEMA Contract Obligations to Respond to the 2017 Disasters  196

Figure 68 – Private & Public Sectors Natural Disasters Awareness Flowchart 197

Figure 69 – 10 Largest Megacities and Their Exposure to Natural Disasters. 198

Figure 70 – Private Sector Activities During 4 Stages of Disaster Mitigation.. 199

Figure 71 – Private Sector (w/o CIP) Business Involvement in Natural Disasters. 200

Figure 72 – Global Natural Disasters Mitigation Market Size [$M] by Revenue Source – 2017-2024. 207

Figure 73 – Global Natural Disasters Mitigation Market Shares [%] – 2017-2024. 208

Figure 74 – Perimeter Protection Scheme Example. 210

Figure 75 – The Tiger Trap Concept 213

Figure 76 – Perimeter Security Industry Value Chain. 216

Figure 77 – Perimeter Security Market: Barriers to New Entry, Supplier Power, Buyer Power, Barriers to Substitution and Competitive Rivalry. 218

Figure 78 – Global Perimeter Security (w/o CIP) Market Size [$M] by Revenue Source – 2017-2024. 226

Figure 79 – Global Perimeter Security (w/o CIP) Market Shares [%] – 2017-2024. 227

Figure 80 – 1st Responders Communications Services. 231

Figure 81 – First Responders’ Mobile Devices Network. 232

Figure 82 – Global Police Modernization & Other 1st Responders Market Size [$M] by Revenue Source – 2017-2024. 245

Figure 83 – Global Police Modernization & Other 1st Responders Market Shares [%] – 2017-2024. 246

Figure 84 – Commercial & Industrial Security Systems, Layers of Security. 251

Figure 85 – Global Private Sector Security (w/o CIP) Market Size [$M] by Revenue Source – 2017-2024. 259

Figure 86 – Global Private Sector Security (w/o CIP) Market Shares [%] – 2017-2024  260

Figure 87 – Global Public Events Security Market Size [$M] by Revenue Source – 2017-2024  277

Figure 88 – Global Public Events Security Market Shares [%] – 2017-2024. 278

Figure 89 – Six Steps of Smart and Safe City. 281

Figure 90 – Smart City Ecosystem.. 282

Figure 91 – Smart City Platform Services. 283

Figure 92 – Safe City vs. Smart City. 284

Figure 93 – Smart City vs. Safe City Overlapping Missions. 285

Figure 94 – Key Public Safety Technology Markets – 2017-2019. 285

Figure 95 – Safe City Architecture & Functions. 287

Figure 96 – Safe City Natural and Man-Made Disaster Mitigation Process. 288

Figure 97 – Safe City Architecture. 289

Figure 98 – Safe City: Process Flowchart 290

Figure 99 – Elements and Stakeholders of a Safe City. 291

Figure 100 – Safe City Planning Matrix. 292

Figure 101 – Safe City Communication Topology. 293

Figure 102 – Global Safe City Market Size [$M] by Revenue Source – 2017-2024. 308

Figure 103 – Global Safe City Market Shares [%] – 2017-2024. 309

Figure 104 – Other Vertical Markets [$M] by Revenue Source – 2017-2024. 311

Figure 105 – Other Vertical Markets Shares [%] – 2017-2024. 312

Questions about this report?

Contact Sales: 1-571-527-1010 or Analysts: 1-202-455-0966

  • Have a question about Global Homeland Security & Public Safety by Vertical Markets - 2019-2024
    Please fill out all fields in the form below and click "Submit" to send your question.
    Our representative will review your question and contact you with an answer as soon as possible.
  • 2+2=
  • This field is for validation purposes and should be left unchanged.
1
Interested in this report? Need more information?
X
Powered By