Download TOC as PDF
7 Volumes:
Global Homeland Security & Public Safety (with COVID-19 & Vaccines Impact) Market – 2022-2026: Volume 1
Global Homeland Security & Public Safety (with COVID-19 & Vaccines Impact) Market – 2022-2026: Volume 2
Global Homeland Security & Public Safety (with COVID-19 & Vaccines Impact) Market – 2022-2026: Volume 3
Global Homeland Security & Public Safety (with COVID-19 & Vaccines Impact) Market – 2022-2026: Volume 4
Global Homeland Security & Public Safety (with COVID-19 & Vaccines Impact) Market – 2022-2026: Volume 5
Global Homeland Security & Public Safety (with COVID-19 & Vaccines Impact) Market – 2022-2026: Volume 6
Global Homeland Security & Public Safety (with COVID-19 & Vaccines Impact) Market – 2022-2026: Volume 7
Global Homeland Security & Public Safety (with COVID-19 & Vaccines Impact) Market – 2021-2026: Volume 1
Download the PDF
1 Executive Summary………………………………………………. 12
1.1 Key Findings & Conclusions……………………………….. 12
1.2 Global HLS & PS, 630 Sub-Markets: Research Vectors 19
1.3 COVID-19 Pandemic and Vaccines Impact……………. 20
1.4 Major Dynamics & Opportunities………………………….. 21
1.5 Global Homeland Security & Public Safety Market – 2019-2026………………………………………………………. 22
1.5.1 Global Homeland Security & Public Safety Vertical Markets…………………………………………………….. 23
1.5.2 Global Homeland Security & Public Safety Market by Technology……………………………………………….. 25
1.5.3 Global Homeland Security & Public Safety Market by Region……………………………………………………… 27
1.5.4 Global Homeland Security & Public Safety Market by Country…………………………………………………….. 28
1.5.5 Global Homeland Security & Public Safety Market by Revenue Source…………………………………………. 29
2 Global Homeland Security Market Background…………. 31
2.1 Global Security Concerns…………………………………… 31
2.2 Global Risks: A Regional Perceptive…………………….. 33
2.3 Global Geopolitical Scenario: 2026 Outlook……………. 36
2.4 Global Terror Threats………………………………………… 38
2.5 Public Safety Risks Vs. Terror Risks…………………….. 43
2.6 Homeland Security, Public Safety, National Security and Defense Agencies……………………………………………. 44
3 COVID-19 Pandemic & Vaccines Impact on the HLS & PS Market…………………………………………………………………. 46
3.1 North America COVID-19 Assessment………………….. 47
3.2 Europe COVID-19 Assessment…………………………… 47
3.3 LATAM COVID-19 Assessment…………………………… 47
3.4 APAC COVID-19 Assessment…………………………….. 47
3.5 Middle East & Africa COVID-19 Assessment………….. 48
GLOBAL MARKET……………………………………………………….. 49
4 Market Drivers………………………………………………………. 49
5 Market Inhibitors…………………………………………………… 53
6 Global Homeland Security & Public Safety Market SWOT Analysis………………………………………………………………. 56
6.1 Strengths……………………………………………………….. 56
6.2 Weaknesses…………………………………………………… 57
6.3 Opportunities…………………………………………………… 58
6.4 Threats………………………………………………………….. 60
7 Competitive Analysis: Market Barriers to New Entry, Supplier Power, Buyer Power, Barriers to Substitution and Competitive Rivalry…………………………………………. 62
7.1 The Industry Value Chain…………………………………… 64
7.1.1 Background……………………………………………….. 64
7.1.2 The Industry Primary Activities………………………. 65
7.2 Support Activities……………………………………………… 65
8 Global Homeland Security & Public Safety Market – 2019-2026……………………………………………………………………. 66
8.1 Global Homeland Security & Public Safety Market by Vertical Market………………………………………………… 66
8.1.1 Global Market – 2019-2026…………………………… 66
8.1.2 Global Market Breakdown – 2019-2026…………… 68
8.2 Global Homeland Security & Public Safety Market by Technology…………………………………………………….. 71
8.2.1 Homeland Security & Public Safety: Business Opportunities by Technology…………………………. 71
8.2.2 Global Market – 2019-2026…………………………… 73
8.2.3 Global Market Breakdown – 2019-2026…………… 75
8.3 Global Homeland Security & Public Safety Market by Region…………………………………………………………… 77
8.3.1 Global Market – 2019-2026…………………………… 77
8.3.2 Market Dynamics – 2019-2026………………………. 77
8.3.3 Market Breakdown – 2019-2026…………………….. 78
8.4 Global Homeland Security & Public Safety Market by Country………………………………………………………….. 79
8.4.1 Global Market – 2019-2026…………………………… 79
8.4.2 Market Dynamics – 2019-2026………………………. 81
8.4.3 Market Breakdown – 2019-2026…………………….. 83
8.5 Global Homeland Security & Public Safety Market by Revenue Source………………………………………………. 85
8.5.1 Global Market – 2019-2026…………………………… 85
8.5.2 Market Breakdown – 2019-2026…………………….. 86
REGIONAL MARKETS…………………………………………………… 87
9 North America Homeland Security & Public Safety Market – 2019-2026………………………………………………………….. 87
9.1 North America Homeland Security & Public Safety Market Background…………………………………………… 87
9.1.1 North America Homeland Security & Public Safety Market Drivers……………………………………………. 87
9.1.2 Cyber Attacks…………………………………………….. 88
9.1.3 Terrorism Threat…………………………………………. 88
9.1.4 Natural Disasters………………………………………… 88
9.2 North America Homeland Security & Public Safety Market by Vertical Market…………………………………… 89
9.2.1 North America Market – 2019-2026………………… 89
9.2.2 North America Market Breakdown – 2019-2026…. 92
9.3 North America Homeland Security & Public Safety Market by Technology……………………………………….. 94
9.3.1 North America Market – 2019-2026………………… 94
9.3.2 North America Market Breakdown – 2019-2026…. 96
9.4 North America Homeland Security & Public Safety Market by Revenue Source………………………………… 98
9.4.1 North America Market – 2019-2026………………… 98
9.4.2 Market Breakdown – 2019-2026…………………….. 99
10 Latin America Homeland Security & Public Safety Market – 2019-2026………………………………………………………… 100
10.1 Latin America Homeland Security & Public Safety Market Background…………………………………………. 100
10.1.1 Latin America Homeland Security & Public Safety Market Drivers………………………………………….. 100
10.1.2 Organized Crime………………………………………. 101
10.1.3 Illicit Financial Flows………………………………….. 101
10.1.4 Drug Trafficking………………………………………… 101
10.2 Latin America Homeland Security & Public Safety Market by Vertical Market…………………………………. 102
10.2.1 Latin America Market – 2019-2026……………….. 102
10.2.2 Latin America Market Breakdown – 2019-2026… 105
10.3 Latin America Homeland Security & Public Safety Market by Technology……………………………………… 107
10.3.1 Latin America Market – 2019-2026……………….. 107
10.3.2 Latin America Market Breakdown – 2019-2026… 109
10.4 Latin America Homeland Security & Public Safety Market by Revenue Source………………………………. 111
10.4.1 Latin America Market – 2019-2026……………….. 111
10.4.2 Market Breakdown – 2019-2026…………………… 112
11 Europe Homeland Security & Public Safety Market – 2019-2026…………………………………………………………… 113
11.1 European Homeland Security & Public Safety Market Background…………………………………………………… 113
11.1.1 Europe Homeland Security & Public Safety Market Drivers……………………………………………………. 113
11.1.2 Fight Against Terrorist Financing………………….. 115
11.2 Europe Homeland Security & Public Safety Market by Vertical Market………………………………………………. 115
11.2.1 Europe Market – 2019-2026………………………… 115
11.2.2 Europe Market Breakdown – 2019-2026………… 118
11.3 Europe Homeland Security & Public Safety Market by Technology…………………………………………………… 120
11.3.1 Europe Market – 2019-2026………………………… 120
11.3.2 Europe Market Breakdown – 2019-2026………… 122
11.4 Europe Homeland Security & Public Safety Market by Revenue Source…………………………………………….. 124
11.4.1 Europe Market – 2019-2026………………………… 124
11.4.2 Market Breakdown – 2019-2026…………………… 125
12 Middle East & Africa Homeland Security & Public Safety Market – 2019-2026………………………………………………. 126
12.1 Middle East and Africa Homeland Security & Public Safety Market Background……………………………….. 126
12.1.1 Middle East and Africa Homeland Security & Public Safety Market Drivers………………………………… 126
12.1.2 Terrorism Threat……………………………………….. 127
12.1.3 Political and Social Instability……………………….. 128
12.1.4 Cyber Attacks…………………………………………… 128
12.2 Middle East & Africa Homeland Security & Public Safety Market by Vertical Market…………………………………. 128
12.2.1 Middle East & Africa Market – 2019-2026……….. 128
12.2.2 Middle East & Africa Market Breakdown – 2019-2026………………………………………………………. 131
12.3 Middle East & Africa Homeland Security & Public Safety Market by Technology……………………………………… 133
12.3.1 Middle East & Africa Market – 2019-2026……….. 133
12.3.2 Middle East & Africa Market Breakdown – 2019-2026………………………………………………………. 135
12.4 Middle East & Africa Homeland Security & Public Safety Market by Revenue Source………………………………. 137
12.4.1 Middle East & Africa Market – 2019-2026……….. 137
12.4.2 Market Breakdown – 2019-2026…………………… 138
13 Asia Pacific Homeland Security & Public Safety Market – 2019-2026…………………………………………………………… 139
13.1 APAC Homeland Security & Public Safety Market Background…………………………………………………… 139
13.1.1 APAC Homeland Security & Public Safety Market Drivers……………………………………………………. 139
13.1.1.1 Water Crises………………………………………….. 140
13.1.1.2 Terrorist Attacks……………………………………… 141
13.1.1.3 Manmade Environmental Catastrophes……….. 141
13.1.1.4 Natural Catastrophes……………………………….. 141
13.1.1.5 Cyberattacks………………………………………….. 141
13.1.1.6 Interstate conflict…………………………………….. 142
13.2 Asia Pacific Homeland Security & Public Safety Market by Vertical Market…………………………………………… 142
13.2.1 Asia Pacific Market – 2019-2026………………….. 142
13.2.2 Asia Pacific Market Breakdown – 2019-2026…… 145
13.3 Asia Pacific Homeland Security & Public Safety Market by Technology……………………………………………….. 147
13.3.1 Asia Pacific Market – 2019-2026………………….. 147
13.3.2 Asia Pacific Market Breakdown – 2019-2026…… 149
13.4 Asia Pacific Homeland Security & Public Safety Market by Revenue Source………………………………………… 151
13.4.1 Asia Pacific Market – 2019-2026………………….. 151
13.4.2 Market Breakdown – 2019-2026…………………… 152
[Back to top]
Global Homeland Security & Public Safety (with COVID-19 & Vaccines Impact) Market – 2021-2026: Volume 2
Download the PDF
VERTICAL MARKETS……………………………………………………. 19
1 Aviation Security Market………………………………………… 19
1.1 Scope……………………………………………………………. 19
1.2 The COVID-19 Effects on the Airline Industry………… 20
1.3 Airport Security Market Background……………………… 25
1.4 Major Findings & Conclutions……………………………… 32
1.5 Aviation Security Terror Threats………………………….. 38
1.6 Aviation Security Technologies……………………………. 41
1.6.1 Airport Perimeter Security…………………………….. 41
1.6.2 X-ray Screening………………………………………….. 43
1.6.3 Explosive Detection Systems (EDS)……………….. 44
1.6.4 Explosives Trace Detection (ETD)………………….. 45
1.6.5 Biological, Radioactive and Nuclear Detection…… 45
1.6.6 Millimeter Wave Imaging………………………………. 45
1.6.7 Canine Screening……………………………………….. 46
1.7 Aviation Security Market Demand Side………………….. 46
1.7.1 Airports…………………………………………………….. 46
1.7.2 Airlines…………………………………………………….. 46
1.7.3 Freight Forwarders……………………………………… 46
1.7.4 Customs…………………………………………………… 47
1.7.5 Security Service Providers……………………………. 47
1.8 Aviation Passenger Screening Technologies Outlook: 2021-2026………………………………………………………. 47
1.9 Checked Baggage Screening Market……………………. 49
1.10 Air Cargo Screening Technologies & Markets…………. 51
1.10.1 Air Cargo Security Process…………………………… 51
1.10.2 Air Cargo Related Security Risks……………………. 54
1.10.3 Air-Cargo Supply Chain Security……………………. 55
1.11 Aviation Security Market Drivers………………………….. 56
1.12 Aviation Security Market Inhibitors……………………….. 58
1.13 Aviation Security Market Business Opportunities & Challenges……………………………………………………… 58
1.14 Aviation Security Market: SWOT Analysis……………… 60
1.15 Aviation Security Market Competitive Analysis………… 61
1.16 Global Aviation Security Market – 2019-2026………… 62
1.16.1 Aviation Security Market – 2019-2026……………… 62
1.16.2 Aviation Security Market Dynamics – 2019-2026.. 63
1.16.3 Aviation Security Market Breakdown – 2019-2026 64
2 Border Security Market………………………………………….. 65
2.1 Scope……………………………………………………………. 65
2.2 Major Findings…………………………………………………. 66
2.3 Major Conclusions……………………………………………. 67
2.4 Market Background…………………………………………… 68
2.5 U.S. – Mexico Border Security……………………………… 70
2.6 Border Security Market Drivers……………………………. 70
2.7 Border Security Market Inhibitors…………………………. 71
2.8 Border Security Market Business Opportunities & Challenges……………………………………………………… 72
2.8.1 Border Security Market: SWOT Analysis………….. 75
2.8.2 Border Security Market Barriers to New Entry, Supplier Power, Buyer Power, Barriers to Substitution and Competitive Rivalry……………….. 76
2.9 Global Border Security Market – 2019-2026…………… 77
2.9.1 Border Security Market – 2019-2026……………….. 77
2.9.2 Border Security Market Dynamics – 2019-2026…. 78
2.9.3 Border Security Market Breakdown – 2019-2026.. 79
3 CBRN Security & Safety Market………………………………. 81
3.1 Scope……………………………………………………………. 81
3.2 Major Findings & Conclusions…………………………….. 81
3.3 Market Background…………………………………………… 84
3.3.1 CBRN Incidents: Characteristics and Countermeasures……………………………………….. 84
3.3.2 Biological Weapons & Bioterror……………………… 85
3.3.3 Chemical Weapons…………………………………….. 87
3.3.4 Public Events CBRNE Security………………………. 89
3.3.5 CBRN Security Challenges…………………………… 90
3.4 Market Drivers…………………………………………………. 90
3.5 Market Inhibitors………………………………………………. 91
3.6 Global CBRN Security & Safety Market – 2019-2026.. 91
3.6.1 CBRN Security & Safety Market – 2019-2026……. 91
3.6.2 CBRN Security & Safety Market Dynamics – 2019-2026………………………………………………………… 93
3.6.3 CBRN Security & Safety Market Breakdown – 2019-2026………………………………………………………… 93
4 Critical Infrastructure Protection Market…………………… 95
4.1 Scope……………………………………………………………. 95
4.2 Major Findings…………………………………………………. 96
4.3 Market Background…………………………………………… 98
4.3.1 Critical Infrastructure Security: Threats……………. 98
4.3.2 Critical Infrastructure Protection Tactics…………… 99
4.3.3 Critical Infrastructure Vulnerabilities………………. 100
4.3.4 Planning of Infrastructure Security………………… 101
4.3.5 Critical Infrastructure Strategy Outlook…………… 102
4.3.6 Government Role……………………………………… 102
4.3.7 CIP Information Sharing with the Private Sector.. 104
4.3.8 Food and Agro-Terror Market Outlook……………. 105
4.3.9 Global Oil-Gas Industry Security Market…………. 107
4.3.10 Threats to the Oil-Gas Industry…………………….. 108
4.4 Critical Infrastructure Protection Market Drivers…….. 110
4.5 Critical Infrastructure Protection Market Inhibitors….. 111
4.6 Business Opportunities……………………………………. 112
4.7 Critical Infrastructure Protection Market: SWOT Analysis 114
4.8 Critical Infrastructure Protection Market Barriers to New Entry, Supplier Power, Buyer Power, Barriers to Substitution and Competitive Rivalry…………………… 116
4.9 Global Critical Infrastructure Protection Market – 2019-2026……………………………………………………………. 117
4.9.1 Critical Infrastructure Protection Market – 2019-2026……………………………………………………………… 117
4.9.2 Critical Infrastructure Protection Market Dynamics – 2019-2026……………………………………………….. 118
4.9.3 Critical Infrastructure Protection Market Breakdown – 2019-2026…………………………………………….. 119
5 Immigration Enforcement Market…………………………… 121
5.1 Scope………………………………………………………….. 121
5.2 Key Findings & Conclusions……………………………… 121
5.3 Market Background…………………………………………. 125
5.4 Market Drivers……………………………………………….. 126
5.5 Market Inhibitors…………………………………………….. 127
5.6 Global Immigration Enforcement Market – 2019-2026 127
5.6.1 Immigration Enforcement Market – 2019-2026… 127
5.6.2 Immigration Enforcement Market Dynamics – 2019-2026………………………………………………………. 129
5.6.3 Immigration Enforcement Market Breakdown – 2019-2026……………………………………………….. 129
6 Intelligence Agencies Market………………………………… 131
6.1 Scope………………………………………………………….. 131
6.2 Major Findings……………………………………………….. 132
6.3 Major Conclusions………………………………………….. 133
6.4 Market Background…………………………………………. 133
6.5 Counter-Terror & Crime Intelligence Market Drivers.. 134
6.6 Counter-Terror & Crime Intelligence Market Inhibitors 135
6.7 Terror & Crime Intelligence Business Opportunities & Challenges……………………………………………………. 136
6.8 Counter Terror & Crime Intelligence Market: SWOT Analysis……………………………………………………….. 139
6.9 Counter Terror & Crime Intelligence Market Barriers to New Entry, Supplier Power, Buyer Power, Barriers to Substitution and Competitive Rivalry…………………… 140
6.10 Intelligence Agencies Market – 2019-2026…………… 141
6.10.1 Intelligence Agencies Market – 2019-2026……… 141
6.10.2 Intelligence Agencies Market Dynamics – 2019-2026……………………………………………………………… 142
6.10.3 Intelligence Agencies Market Breakdown – 2019-2026………………………………………………………. 143
7 Maritime Security Market………………………………………. 145
7.1 Scope………………………………………………………….. 145
7.2 Major Findings……………………………………………….. 146
7.3 Major Conclusions………………………………………….. 148
7.4 Maritime Security Infrastructure…………………………. 148
7.5 Port Critical Infrastructure Operations………………….. 151
7.6 Maritime Security Market Drivers……………………….. 153
7.7 Maritime Security Market Inhibitors…………………….. 154
7.8 Maritime Security Market: Business Opportunities & Challenges……………………………………………………. 155
7.9 Maritime Security Market: SWOT Analysis……………. 157
7.10 Global Maritime Security Market – 2019-2026……….. 157
7.10.1 Maritime Security Market – 2019-2026…………… 157
7.10.2 Maritime Security Market Dynamics – 2019-2026 159
7.10.3 Maritime Security Market Breakdown – 2019-2026……………………………………………………………… 159
8 Mass Transportation Security Market…………………….. 161
8.1 Scope………………………………………………………….. 161
8.2 Land Transportation Security Market Background….. 162
8.3 The EU SECUR-ED Project………………………………. 167
8.4 Mass Transportation Security Market: Business Opportunities & Challenges………………………………. 168
8.5 Global Mass Transportation Security Industry: SWOT Analysis……………………………………………………….. 169
8.5.1 Strengths………………………………………………… 169
8.5.2 Weaknesses……………………………………………. 170
8.5.3 Opportunities……………………………………………. 170
8.5.4 Threats…………………………………………………… 171
8.6 Mass Transportation Security Market: Barriers to New Entry, Supplier Power, Buyer Power, Barriers to Substitution and Competitive Rivalry…………………… 172
8.7 Mass Transportation Security Market Drivers………… 173
8.8 Mass Transportation Security Market Inhibitors……… 173
8.9 Global Mass Transportation Security Market – 2019-2026……………………………………………………………. 175
8.9.1 Mass Transportation Security Market – 2019-2026……………………………………………………………… 175
8.9.2 Mass Transportation Security Market Dynamics – 2019-2026……………………………………………….. 176
8.9.3 Mass Transportation Security Market Breakdown – 2019-2026……………………………………………….. 177
9 Natural Disasters Mitigation Market……………………….. 178
9.1 Scope………………………………………………………….. 178
9.2 Natural Disasters Mitigation & Relief Equipment & Systems: Market Background……………………………. 179
9.2.1 Overview…………………………………………………. 179
9.2.2 Natural Disasters Forecasting………………………. 185
9.2.3 Natural Disasters Rescue & Recovery Equipment: Background……………………………………………… 185
9.2.4 Cities Threatened by Major Damaging Natural Disasters…………………………………………………. 188
9.2.5 Private Sector Business Involvement in Natural Disaster Mitigation…………………………………….. 189
9.2.6 Natural Disasters Mitigation & Relief Equipment & Systems: Business Opportunities………………….. 191
9.3 Natural Disasters Mitigation & Relief Equipment & Systems Market: SWOT Analysis……………………….. 192
9.3.1 Strengths………………………………………………… 192
9.3.2 Weaknesses……………………………………………. 192
9.3.3 Opportunities……………………………………………. 193
9.3.4 Threats…………………………………………………… 193
9.4 Natural Disasters Mitigation & Relief Equipment & Systems Market: Barriers to New Entry, Supplier Power, Buyer Power, Barriers to Substitution and Competitive Rivalry………………………………………………………….. 194
9.5 Market Drivers……………………………………………….. 195
9.6 Market Inhibitors…………………………………………….. 195
9.7 Global Natural Disasters Mitigation Market – 2019-2026 196
9.7.1 Natural Disasters Mitigation Market – 2019-2026 196
9.7.2 Natural Disasters Mitigation Market Dynamics – 2019-2026……………………………………………….. 198
9.7.3 Natural Disasters Mitigation Market Breakdown – 2019-2026……………………………………………….. 198
10 Perimeter Security Market…………………………………….. 200
10.1 Scope………………………………………………………….. 200
10.2 Major Findings & Conclusions……………………………. 201
10.3 Market Background…………………………………………. 202
10.4 Market Drivers……………………………………………….. 205
10.5 Market Inhibitors…………………………………………….. 206
10.6 Perimeter Security Business Opportunities & Challenges 207
10.7 Perimeter Security Industry Value Chain……………… 208
10.7.1 The Perimeter Security Value Chain……………… 208
10.7.2 Perimeter Security Industry Primary Activities….. 209
10.8 Perimeter Security industry Support Activities……….. 209
10.9 Perimeter Security Market: Barriers to New Entry, Supplier Power, Buyer Power, Barriers to Substitution and Competitive Rivalry…………………………………… 210
10.10 Perimeter Security Technology Evolution…………….. 211
10.11 Global Perimeter Security (w/o CIP) Market – 2019-2026 217
10.11.1 Perimeter Security (w/o CIP) Market – 2019-2026……………………………………………………………… 217
10.11.2 Perimeter Security (w/o CIP) Market Dynamics – 2019-2026……………………………………………….. 218
10.11.3 Perimeter Security (w/o CIP) Market Breakdown – 2019-2026……………………………………………….. 219
11 Police Modernization & Other 1st Responders Market. 221
11.1 Scope………………………………………………………….. 221
11.2 Police Modernization & Other 1st Responders: Market Background…………………………………………………… 222
11.2.1 Police Modernization Vectors………………………. 227
11.2.2 Law Enforcement Agencies and Police Modernization Funding……………………………….. 228
11.2.3 Police Modernization & Other 1st Responders Business Opportunities………………………………. 229
11.3 SWOT Analysis……………………………………………… 233
11.3.1 Strengths………………………………………………… 233
11.3.2 Weaknesses……………………………………………. 234
11.3.3 Opportunities……………………………………………. 235
11.3.4 Threats…………………………………………………… 236
11.4 Police Modernization Market: Barriers to New Entry, Supplier Power, Buyer Power, Barriers to Substitution and Competitive Rivalry…………………………………… 237
11.5 Market Analysis……………………………………………… 238
11.5.1 Market Drivers………………………………………….. 238
11.5.2 Market Inhibitors……………………………………….. 239
11.6 Global Police Modernization & Other 1st Responders Market – 2019-2026………………………………………… 239
11.6.1 Police Modernization & Other 1st Responders Market – 2019-2026…………………………………… 239
11.6.2 Police Modernization & Other 1st Responders Market Dynamics – 2019-2026…………………….. 240
11.6.3 Police Modernization & Other 1st Responders Market Breakdown – 2019-2026…………………… 241
12 Private Sector Security (w/o CIP) Market…………………. 243
12.1 Scope………………………………………………………….. 243
12.2 Major Findings……………………………………………….. 244
12.3 Major Conclusions………………………………………….. 244
12.4 Market Background…………………………………………. 245
12.5 Commercial & Industrial Security Business Opportunities & Challenges…………………………………………………. 247
12.6 Private Sector Security Market: SWOT Analysis……. 248
12.6.1 Strengths………………………………………………… 248
12.6.2 Weaknesses……………………………………………. 249
12.6.3 Opportunities……………………………………………. 249
12.6.4 Threats…………………………………………………… 250
12.7 Private Sector Security Market: Barriers to New Entry, Supplier Power, Buyer Power, Barriers to Substitution and Competitive Rivalry…………………………………… 251
12.8 Market Drivers……………………………………………….. 252
12.9 Market Inhibitors…………………………………………….. 252
12.10 Global Private Sector Security (w/o CIP) Market – 2019-2026……………………………………………………………. 253
12.10.1 Private Sector Security (w/o CIP) Market – 2019-2026………………………………………………………. 253
12.10.2 Private Sector Security (w/o CIP) Market Dynamics – 2019-2026…………………………………………….. 254
12.10.3 Private Sector Security (w/o CIP) Market Breakdown – 2019-2026…………………………………………….. 255
13 Public Events Security Market………………………………. 257
13.1 Scope………………………………………………………….. 257
13.2 Public Event Security………………………………………. 258
13.2.1 Pre-Event Planning……………………………………. 258
13.2.2 During the Event……………………………………….. 258
13.2.3 After the Event…………………………………………. 258
13.3 Public Events Security Market Background…………… 259
13.3.1 Public Events Security: Responsible Bodies……. 259
13.3.2 Public Events Security: Intelligence Market Background……………………………………………… 259
13.3.3 Public Events Security: Private Sector Market Background……………………………………………… 259
13.3.4 Communication Interoperability Market Background……………………………………………………………… 260
13.3.5 Perimeter Security Market Background………….. 260
13.3.6 Public Events Infrastructure Security Market……. 260
13.3.7 Public Events Emergency Services Market……… 261
13.3.8 Public Events WMD and Hazmat Detection and Response Market Background……………………… 261
13.3.9 Public Events Transportation Security Market Background……………………………………………… 263
13.4 Public Events Security Market: Business Opportunities & Challenges……………………………………………………. 264
13.5 Public Events Security Market: SWOT Analysis…….. 265
13.5.1 Strengths………………………………………………… 265
13.5.2 Weaknesses……………………………………………. 266
13.5.3 Opportunities……………………………………………. 266
13.5.4 Threats…………………………………………………… 267
13.6 Public Events Security Market: Barriers to New Entry, Supplier Power, Buyer Power, Barriers to Substitution and Competitive Rivalry…………………………………… 268
13.7 Market Drivers……………………………………………….. 269
13.8 Market Inhibitors…………………………………………….. 269
13.9 Global Public Events Security Market – 2019-2026… 270
13.9.1 Public Events Security Market – 2019-2026…….. 270
13.9.2 Public Events Security Market Dynamics – 2019-2026………………………………………………………. 272
13.9.3 Public Events Security Market Breakdown – 2019-2026………………………………………………………. 272
14 Safe City Market………………………………………………….. 274
14.1 Scope………………………………………………………….. 274
14.2 Safe City vs. Smart City……………………………………. 275
14.2.1 Smart Cities…………………………………………….. 275
14.2.2 Safe Cities………………………………………………. 278
14.2.3 Safe City Surveillance Systems Market………….. 280
14.2.4 Safe City Disaster Mitigation Process…………….. 282
14.2.5 Safe City Architecture………………………………… 283
14.2.6 Safe City Event Awareness Process……………… 284
14.2.7 Safe City Planning…………………………………….. 285
14.2.8 Safe City Cost Allocation…………………………….. 286
14.2.9 Safe City Communication Networks………………. 287
14.3 Major Findings……………………………………………….. 288
14.4 Safe Cities Business Opportunities…………………….. 292
14.5 Safe Cities Market: SWOT Analysis……………………. 293
14.5.1 Strengths………………………………………………… 293
14.5.2 Weaknesses……………………………………………. 293
14.5.3 Opportunities……………………………………………. 294
14.5.4 Threats…………………………………………………… 294
14.6 Safe Cities Market: Barriers to New Entry, Supplier Power, Buyer Power, Barriers to Substitution and Competitive Rivalry…………………………………………. 295
14.7 Market Analysis……………………………………………… 296
14.7.1 Market Drivers………………………………………….. 296
14.7.2 Regional Market Drivers for Safe Cities………….. 297
14.7.3 Market Inhibitors……………………………………….. 299
14.8 Global Safe City Market – 2019-2026………………….. 300
14.8.1 Safe City Market – 2019-2026……………………… 300
14.8.2 Safe City Market Dynamics – 2019-2026………… 302
14.8.3 Safe City Market Breakdown – 2019-2026………. 302
15 Other Public Safety & Homeland Security Vertical Markets……………………………………………………………… 303
15.1 Other Vertical Markets– 2019-2026…………………….. 303
15.2 Other Vertical Markets Dynamics – 2019-2026……… 304
15.3 Other Vertical Markets Breakdown – 2019-2026……. 305
[Back to top]
Global Homeland Security & Public Safety (with COVID-19 & Vaccines Impact) Market – 2022-2026: Volume 3
Download the PDF
TECHNOLOGY MARKETS……………………………………………… 25
1 Big Data & Artificial Intelligence Market……………………. 25
1.1 Artifical Intelligence Background………………………….. 25
1.1.1 Overview…………………………………………………… 25
1.1.2 Artificial Intelligence Based Machine Learning…… 30
1.1.3 Machine Learning Methods…………………………… 31
1.1.4 Deep Machine Learning……………………………….. 32
1.1.5 Application Types……………………………………….. 32
1.1.6 Predict Significant Future Events……………………. 32
1.1.7 AI in Cybersecurity……………………………………… 32
1.1.8 Handling and Summarizing of Raw Data………….. 33
1.1.9 Artificial Intelligence in Law Enforcement…………. 34
1.2 Big Data Market & Technology Background……………. 34
1.2.1 Data Centric Access Control…………………………. 36
1.2.2 Access Control in Databases…………………………. 37
1.2.3 Encryption Prescribed Access Control…………….. 37
1.2.4 Trusted Bootstrapping………………………………….. 37
1.2.5 Big Data & Data Analytics…………………………….. 38
1.3 Big Data, Artificial Intelligence & Data Analytics: HLS and Internal Security Applications………………………… 39
1.4 Big Data Based Urban Surveillance……………………… 41
1.5 Market Dynamics & Opportunities………………………… 41
1.6 Big Data, Artificial Intelligence& Data Analytics Industry: SWOT Analysis……………………………………………….. 43
1.6.1 Strengths………………………………………………….. 43
1.6.2 Weaknesses……………………………………………… 43
1.6.3 Opportunities……………………………………………… 44
1.6.4 Threats…………………………………………………….. 44
1.7 Big Data, Artificial Intelligence & Data Analytics Market Drivers…………………………………………………………… 45
1.8 Big Data, Artificial Intelligence & Data Analytics Market Inhibitors………………………………………………………… 45
1.9 Global Homeland Security & Public Safety related Big Data & Artificial Intelligence Market – 2019-2026…….. 46
1.9.1 Big Data & AI Market – 2019-2026………………….. 46
1.9.2 Big Data & AI Market Dynamics – 2019-2026……. 48
1.9.3 Big Data & AI Market Breakdown – 2019-2026….. 48
2 Bio Terror Mitigation Market…………………………………… 50
2.1 Market Background…………………………………………… 50
2.2 Bio-Detection Technologies………………………………… 53
2.2.1 Sampling the Environment……………………………. 53
2.2.2 Bio-Detectors in a Multitude of Ambient Settings.. 53
2.2.3 Bio-Detection Triggering………………………………. 53
2.2.4 Sample Collection……………………………………….. 54
2.2.5 Bio-Particle Detectors………………………………….. 54
2.2.6 Bio-Agent Identification………………………………… 55
2.3 Links to Bio-Detection Technologies, Products & Applications…………………………………………………….. 55
2.3.1 Links To Technology……………………………………. 56
2.3.2 Links To Applications…………………………………… 56
2.3.3 National Biosurveillance Systems…………………… 57
2.4 Bio-Agents & Infectious Disease Detection: Homeland Security & Public Safety Applications……………………. 59
2.5 Bio-Agents & Infectious Disease Detection: Business Opportunities & Challenges………………………………… 64
2.6 Bio-Agents & Infectious Disease Detection Industry: SWOT Analysis……………………………………………….. 64
2.6.1 Strengths………………………………………………….. 64
2.6.2 Weaknesses……………………………………………… 65
2.6.3 Opportunities……………………………………………… 66
2.6.4 Threats…………………………………………………….. 67
2.7 Bio-Agents & Infectious Disease Detection Market Drivers…………………………………………………………… 68
2.8 Bio-Agents & Infectious Disease Detection Market Inhibitors………………………………………………………… 69
2.9 Global Bio Terror MitigationMarket – 2019-2026……… 70
2.9.1 Bio Terror Mitigation Market – 2019-2026………… 70
2.9.2 Bio Terror Mitigation Market Dynamics – 2019-2026………………………………………………………………. 72
2.9.3 Bio Terror Mitigation Market Breakdown – 2019-2026………………………………………………………… 72
3 Biometrics Homeland Security & Public Safety Market.. 74
3.1 Global Biometrics Market Background…………………… 74
3.2 Multimodal Biometric Systems…………………………….. 78
3.3 Biometrics: Homeland Security & Public Safety Applications…………………………………………………….. 78
3.3.1 Overview…………………………………………………… 78
3.3.2 Multi-biometrics for Border Control………………….. 80
3.3.3 Biometrics for Banking…………………………………. 81
3.3.4 Biometrics for Digital Security………………………… 82
3.4 Biometrics: Business Opportunities & Challenges……. 83
3.5 Biometrics Industry: SWOT Analysis…………………….. 84
3.5.1 Strengths………………………………………………….. 84
3.5.2 Weaknesses……………………………………………… 85
3.5.3 Opportunities……………………………………………… 85
3.5.4 Threats…………………………………………………….. 86
3.6 Biometrics Market Drivers………………………………….. 87
3.7 Biometrics Market Inhibitors……………………………….. 89
3.8 Global Biometrics Homeland Security & Public Safety Market – 2019-2026………………………………………….. 91
3.8.1 Biometrics Market – 2019-2026……………………… 91
3.8.2 Biometrics Market Dynamics – 2019-2026……….. 92
3.8.3 Biometrics Market Breakdown – 2019-2026……… 93
4 Border & Perimeter Barriers Market…………………………. 95
4.1 Major Findings and Conclusions………………………….. 95
4.2 Global Border & Perimeter Barriers Market Background 95
4.3 The Mexico–United States “Wall”…………………………. 96
4.4 Border & Perimeter Barriers: Market Drivers…………… 97
4.5 Border & Perimeter Barriers Market Inhibitors…………. 98
4.6 Border & Perimeter Barriers Market: SWOT Analysis 100
4.7 Border & Perimeter Barriers Market Barriers to New Entry, Supplier Power, Buyer Power, Barriers to Substitution and Competitive Rivalry…………………… 101
4.8 Global Border & Perimeter Security Barriers Market – 2019-2026…………………………………………………….. 102
4.8.1 Border & Perimeter Barriers Market – 2019-2026 102
4.8.2 Border & Perimeter Barriers Market Dynamics – 2019-2026……………………………………………….. 103
4.8.3 Border & Perimeter Barriers Market Breakdown – 2019-2026……………………………………………….. 104
5 C2/C4ISR Systems Market…………………………………….. 106
5.1 Scope………………………………………………………….. 106
5.2 Market & Technology Background……………………… 107
5.3 HLS & PS C2/C4ISR Systems: Business Opportunities 113
5.4 C2/C4ISR Industry SWOT Analysis…………………….. 113
5.4.1 Strengths………………………………………………… 113
5.4.2 Weaknesses……………………………………………. 114
5.4.3 Opportunities……………………………………………. 115
5.4.4 Threats…………………………………………………… 115
5.5 C2/C4ISR Market Drivers…………………………………. 116
5.6 C2/C4ISR Market Inhibitors………………………………. 117
5.7 Global Homeland Security & Public Safety C2/C4ISR Systems Market – 2019-2026……………………………. 118
5.7.1 C2/C4ISR Systems Market – 2019-2026………… 118
5.7.2 C2/C4ISR Systems Market Dynamics – 2019-2026……………………………………………………………… 120
5.7.3 C2/C4ISR Systems Market Breakdown – 2019-2026……………………………………………………………… 120
6 Chemical, Hazmat & Nuclear Detection Market………… 122
6.1 Scope………………………………………………………….. 122
6.2 Chemical Agent Detection Technologies……………… 122
6.3 Nuclear/Radiological Detection Technologies……….. 123
6.3.1 The Advanced Spectroscopic Portal (ASP)……… 123
6.3.2 Human Portable Radiation Detection Systems (HPRDS) Program…………………………………….. 124
6.3.3 Personal Dosimeters………………………………….. 124
6.3.4 Nuclear- Radiological People Screening Portals. 125
6.4 Market Background…………………………………………. 125
6.4.1 Chemical Plant Security……………………………… 125
6.4.2 Nuclear/Radiological Detection Markets…………. 126
6.5 Chemical, Hazmat & Nuclear Detection: Business Opportunities & Challenges………………………………. 131
6.6 Chemical, Hazmat & Nuclear Detection Industry: SWOT Analysis……………………………………………………….. 132
6.6.1 Strengths………………………………………………… 132
6.6.2 Weaknesses……………………………………………. 133
6.6.3 Opportunities……………………………………………. 133
6.6.4 Threats…………………………………………………… 134
6.7 Chemical, Hazmat & Nuclear Detection Market Drivers 134
6.8 Chemical, Hazmat & Nuclear Detection Market Inhibitors 136
6.9 Global Chemical, Hazmat & Nuclear Detection Market – 2019-2026…………………………………………………….. 138
6.9.1 Chemical, Hazmat & Nuclear Detection Market – 2019-2026……………………………………………….. 138
6.9.2 Chemical, Hazmat & Nuclear Detection Market Dynamics – 2019-2026………………………………. 140
6.9.3 Chemical, Hazmat & Nuclear Detection Market Breakdown – 2019-2026…………………………….. 140
7 Counter-IED Technologies Market…………………………. 142
7.1 Market & Technology Background……………………… 142
7.2 Counter-IED Technologies: Business Opportunities & Challenges……………………………………………………. 146
7.2.1 Maintenance and Upgrades (Particularly of Jammers & Armored Trucks)…………………………………….. 146
7.2.2 Sensors and Other Electronic Systems Upgrade 147
7.2.3 Standoff Suicide Bombers Detection……………… 147
7.2.4 Suicide Bombers Detonation Neutralization…….. 147
7.2.5 Standoff Detection of VBIED……………………….. 147
7.2.6 VBIED Detonation Neutralization………………….. 148
7.2.7 Standoff Explosive Detection in Urban Environment……………………………………………………………… 148
7.2.8 Large Area IED Detection Coverage……………… 148
7.2.9 IED Placement Detection……………………………. 149
7.2.10 Active Armors for Vehicles………………………….. 149
7.3 Counter-IED Technologies Industry: SWOT Analysis 149
7.3.1 Strengths………………………………………………… 149
7.3.2 Weaknesses……………………………………………. 150
7.3.3 Opportunities……………………………………………. 150
7.3.4 Threats…………………………………………………… 151
7.4 Market Drivers……………………………………………….. 151
7.5 Market Inhibitors…………………………………………….. 152
7.6 Global Counter-IED Technologies Market – 2019-2026 153
7.6.1 Counter-IED Technologies Market – 2019-2026. 153
7.6.2 Counter-IED Technologies Market Dynamics – 2019-2026……………………………………………….. 154
7.6.3 Counter-IED Technologies Market Breakdown – 2019-2026……………………………………………….. 155
8 Cybersecurity Market…………………………………………… 157
8.1 Cybersecurity Market & Technology Background…… 157
8.1.1 Cyber Terror & Crime…………………………………. 157
8.1.2 Cyber Warfare………………………………………….. 158
8.1.3 Denial of Service………………………………………. 159
8.1.4 Deliberate Manipulation of Information…………… 160
8.1.5 Detection of Unauthorized Activity………………… 160
8.1.6 Cloud Security………………………………………….. 161
8.1.7 Anti-Malware Cyber-Security……………………….. 161
8.1.8 Privacy Enhanced Technologies (PETs)…………. 162
8.2 Cybersecurity Industry: SWOT Analysis………………. 163
8.2.1 Strengths………………………………………………… 163
8.2.2 Weaknesses……………………………………………. 164
8.2.3 Opportunities……………………………………………. 165
8.2.4 Threats…………………………………………………… 166
8.3 Global Cybersecurity Market – 2019-2026……………. 167
8.3.1 Cybersecurity Market – 2019-2026……………….. 167
8.3.2 Cybersecurity Market Dynamics – 2019-2026….. 168
8.3.3 Cybersecurity Market Breakdown – 2019-2026… 169
9 Decontamination of CBRN & Hazmat Incidents Market 171
9.1 Decontamination Technologies Background…………. 171
9.1.1 Overview…………………………………………………. 171
9.1.2 Decontamination Core Technologies……………… 173
9.1.3 The Decontamination Cycle…………………………. 173
9.2 Decontamination Strategy………………………………… 175
9.3 CBRN & Hazmat Decontamination Market Background 176
9.4 The Decontamination Industry…………………………… 178
9.5 Decontamination of CBRN & Hazmat Incidents Market Drivers…………………………………………………………. 179
9.6 Decontamination of CBRN & Hazmat Incidents Market Inhibitors………………………………………………………. 180
9.7 Global Decontamination of CBRN & Hazmat Incidents Market – 2019-2026………………………………………… 181
9.7.1 Decontamination of CBRN & Hazmat Incidents Market – 2019-2026…………………………………… 181
9.7.2 Decontamination of CBRN & Hazmat Incidents Market Dynamics – 2019-2026…………………….. 182
9.7.3 Decontamination of CBRN & Hazmat Incidents Market Breakdown – 2019-2026…………………… 183
10 Electronic Fencing Homeland Security & Public Safety Market……………………………………………………………….. 185
10.1 Electronic Fences Technologies………………………… 185
10.1.1 Vibration Sensors Mounted on Fence……………. 185
10.1.2 Capacitance Sensors Fence………………………… 186
10.1.3 Strain Sensitive Cables Fence……………………… 187
10.1.4 Fiber Optic Fence……………………………………… 187
10.1.5 Taut Wire Fence……………………………………….. 187
10.1.6 Ported Coax Buried Line Fence……………………. 188
10.1.7 Buried Geophone Fence…………………………….. 189
10.2 Electronic Fencing: Business Opportunities & Challenges……………………………………………………. 190
10.3 Electronic Fencing Industry: SWOT Analysis………… 191
10.3.1 Strengths………………………………………………… 191
10.3.2 Weaknesses……………………………………………. 191
10.3.3 Opportunities……………………………………………. 192
10.3.4 Threats…………………………………………………… 192
10.4 Electronic Fencing Market Drivers………………………. 193
10.5 Electronic Fencing Market Inhibitors……………………. 194
10.6 Global Electronic Fencing Market – 2019-2026……… 194
10.6.1 Electronic Fencing Market – 2019-2026…………. 194
10.6.2 Electronic Fencing Market Dynamics – 2019-2026……………………………………………………………… 196
10.6.3 Electronic Fencing Market Breakdown – 2019-2026……………………………………………………………… 196
11 Emergency Communication/Notification Market………. 198
11.1 Market & Technology Background……………………… 198
11.1.1 Public Safety Communications Market…………… 198
11.1.2 Emergency Communication & Emergency Notification………………………………………………. 200
11.1.3 Emergency Communication & Emergency Notification: Interoperability…………………………. 204
11.1.4 Cost of Emergency Communication & Emergency Notification………………………………………………. 204
11.1.5 Products & Services…………………………………… 205
11.2 Emergency Communication/Notification: Technology Background…………………………………………………… 205
11.2.1 Tetra………………………………………………………. 205
11.2.2 LTE……………………………………………………….. 214
11.2.3 5G Emergency Communication/Notification…….. 216
11.3 Emergency Communication/Notification Market: Business Opportunities……………………………………. 217
11.3.1 Managed Services for Shared/Core Services….. 217
11.3.2 Migration from “Simple” to “Integrated” Networks 217
11.3.3 Emergency Communication/Notification Market Prospects………………………………………………… 218
11.4 Emergency Communication/Notification Market Drivers 219
11.5 Emergency Communication/Notification Market Inhibitors………………………………………………………. 220
11.6 Global Emergency Communication/Notification Market – 2019-2026…………………………………………………….. 220
11.6.1 Emergency Communication/Notification/Notification Market – 2019-2026…………………………………… 220
11.6.2 Emergency Communication/Notification/Notification Market Dynamics – 2019-2026…………………….. 222
11.6.3 Emergency Communication/Notification/Notification Market Breakdown – 2019-2026…………………… 223
12 Explosives Trace Detection (ETD) Market……………….. 225
12.1 Market & Technology Background……………………… 225
12.1.1 ETD Technologies…………………………………….. 225
12.1.2 ETD Market Background…………………………….. 226
12.2 Explosives Trace Detection (ETD): HLS & PS Applications…………………………………………………… 228
12.2.1 Explosives Detected by Explosives Trace Detection……………………………………………………………… 228
12.2.2 Explosives Trace Detection Configuration………. 231
12.2.3 ETD Applications………………………………………. 231
12.3 Explosives Trace Detection (ETD): Business Opportunities & Challenges………………………………. 233
12.4 Explosives Trace Detection (ETD) Industry: SWOT Analysis……………………………………………………….. 234
12.4.1 Strengths………………………………………………… 234
12.4.2 Weaknesses……………………………………………. 234
12.4.3 Opportunities……………………………………………. 235
12.4.4 Threats…………………………………………………… 236
12.5 Global Explosives Trace Detection (ETD) Market – 2019-2026…………………………………………………….. 237
12.5.1 Explosives Trace Detection (ETD) Market – 2019-2026………………………………………………………. 237
12.5.2 Explosives Trace Detection (ETD) Market Dynamics – 2019-2026…………………………………………….. 238
12.5.3 Explosives Trace Detection (ETD) Market Breakdown – 2019-2026…………………………….. 239
13 Information Technologies (w/o AI, Big Data, Intel & Cyber) Market……………………………………………………… 241
13.1 Scope………………………………………………………….. 241
13.2 Major Findings and Conclusions………………………… 241
13.3 Market Background…………………………………………. 242
13.3.1 Homeland Security & Public Safety: Data Center Systems………………………………………………….. 242
13.3.1.1 Overview………………………………………………. 242
13.3.1.2 Counter Terror and Public Safety: Data Center Services……………………………………………….. 243
13.3.1.3 Counter Terror and Public Safety: Support Services……………………………………………….. 243
13.3.1.4 Counter Terror and Public Safety: Technical Consulting Services…………………………………. 243
13.3.1.5 Outsourcing Services………………………………. 244
13.3.1.6 Application Services………………………………… 244
13.3.2 Homeland Security and Public Safety: Enterprise Software…………………………………………………. 244
13.3.3 Homeland Security and Public Safety: IT Services……………………………………………………………… 246
13.3.4 Homeland Security and Public Safety Agencies: Cloud Storage & Computing………………………… 246
13.4 Market Drivers……………………………………………….. 247
13.5 Market Inhibitors…………………………………………….. 248
13.6 Global Information Technologies (w/o AI, Big Data, Intel & Cyber) Homeland Security & Public Safety Market – 2019-2026…………………………………………………….. 249
13.6.1 Information Technologies (w/o AI, Big Data, Intel & Cyber) Market – 2019-2026…………………………. 249
13.6.2 Information Technologies (w/o AI, Big Data, Intel & Cyber) Market Dynamics – 2019-2026…………… 250
13.6.3 Information Technologies (w/o AI, Big Data, Intel & Cyber) Market Breakdown – 2019-2026…………. 251
14 Intelligence Services IT Market……………………………… 253
14.1 Intelligence Services Information Technologies & Market Background…………………………………………………… 253
14.1.1 Geospatial Intelligence (GEOINT) Information Technology……………………………………………… 253
14.1.2 Imagery Intelligence (IMINT) Information Technology……………………………………………………………… 253
14.1.3 Measurement and Signature Intelligence (MASINT) Information Technology………………………………. 253
14.1.4 Open-Source Intelligence (OSINT) Information Technology……………………………………………… 254
14.1.5 Signals Intelligence (SIGINT) Information Technology……………………………………………… 255
14.1.5.1 Communication/Notifications Intelligence COMINT Information Technology……………………………. 255
14.1.5.2 ELINT Electronic Intelligence Information Technology……………………………………………. 256
14.1.6 Foreign Instrumentation Signals Intelligence (FISINT) Information Technology………………….. 257
14.1.7 Financial Intelligence (FININT) Information Technology……………………………………………… 257
14.1.8 Cryptanalysis Information Technology……………. 258
14.1.9 Traffic Analysis…………………………………………. 258
14.2 Global Intelligence Services IT Market – 2019-2026.. 259
14.2.1 Intelligence Services IT Market – 2019-2026…… 259
14.2.2 Intelligence Services IT Market Dynamics – 2019-2026………………………………………………………. 260
14.2.3 Intelligence Services IT Market Breakdown – 2019-2026………………………………………………………. 261
15 Intrusion Detection Systems Homeland Security & Public Safety Market……………………………………………………… 263
15.1 Market & Technology Background……………………… 263
15.1.1 Passive Infrared (PIR) Motion Detection…………. 263
15.1.2 Access Control Systems…………………………….. 266
15.2 Intrusion Detection Systems: Business Opportunities & Challenges……………………………………………………. 266
15.2.1 Challenges………………………………………………. 266
15.2.2 Business Opportunities………………………………. 267
15.3 Intrusion Detection Systems Industry: SWOT Analysis 268
15.3.1 Strengths………………………………………………… 268
15.3.2 Weaknesses……………………………………………. 268
15.3.3 Opportunities……………………………………………. 268
15.3.4 Threats…………………………………………………… 269
15.4 Intrusion Detection Systems Market Drivers………….. 270
15.5 Intrusion Detection Systems Market Inhibitors……….. 270
15.6 Global Intrusion Detection Systems Homeland Security & Public Safety Market – 2019-2026…………………… 271
15.6.1 Intrusion Detection Systems Market – 2019-2026……………………………………………………………… 271
15.6.2 Intrusion Detection Systems Market Dynamics – 2019-2026……………………………………………….. 273
15.6.3 Intrusion Detection Systems Market Breakdown – 2019-2026……………………………………………….. 273
16 Metal Detectors Market…………………………………………. 275
16.1 Market & Technology Background……………………… 275
16.1.1 Hand-Held Metal Detectors…………………………. 275
16.1.1.1 The Market……………………………………………. 275
16.1.1.2 Principles of Operation…………………………….. 275
16.1.1.3 Technology & Operational Essentials………….. 276
16.1.1.4 Hand-Held Metal Detectors – Technology Trends…………………………………………………………… 276
16.1.2 Metal Detection Portals………………………………. 277
16.1.2.1 The Market……………………………………………. 277
16.1.2.2 Metal Detection Portals Technology……………. 278
16.2 Metal Detectors: Business Opportunities & Challenges 280
16.3 Metal Detectors Industry: SWOT Analysis……………. 282
16.3.1 Strengths………………………………………………… 282
16.3.2 Weaknesses……………………………………………. 282
16.3.3 Opportunities……………………………………………. 282
16.3.4 Threats…………………………………………………… 283
16.4 Metal Detectors Market Drivers………………………….. 283
16.5 Metal Detectors Market Inhibitors……………………….. 284
16.6 Global Metal Detectors Market – 2019-2026…………. 285
16.6.1 Metal Detectors Market – 2019-2026…………….. 285
16.6.2 Metal Detectors Market Dynamics – 2019-2026.. 286
16.6.3 Metal Detectors Market Breakdown – 2019-2026 287
17 Non-Lethal Weapons Market…………………………………. 289
17.1 Non-Lethal Weapons Technology Background……… 289
17.2 Less-Lethal Weapons: Market Background…………… 293
17.3 Non-Lethal Weapons: Business Opportunities & Challenges……………………………………………………. 296
17.4 Non-Lethal Weapons Industry: SWOT Analysis…….. 297
17.4.1 Strengths………………………………………………… 297
17.4.2 Weaknesses……………………………………………. 298
17.4.3 Opportunities……………………………………………. 300
17.4.4 Threats…………………………………………………… 300
17.5 Non-Lethal Weapons Market Drivers…………………… 301
17.6 Non-Lethal Weapons Market Inhibitors………………… 303
17.7 Global Non-Lethal Weapons Market – 2019-2026….. 304
17.7.1 Non-Lethal Weapons Market – 2019-2026……… 304
17.7.2 Non-Lethal Weapons Market Dynamics – 2019-2026……………………………………………………………… 306
17.7.3 Non-Lethal Weapons Market Breakdown – 2019-2026………………………………………………………. 306
18 Personal (Ballistic & CBRNE) Protective Gear Market.. 308
18.1 Market & Technology Background……………………… 308
18.1.1 Personal Body Armor…………………………………. 308
18.1.2 Respiratory Protective Equipment…………………. 309
18.1.3 CBRN and Hazmat Personal Protective Gear….. 310
18.2 Personal (Ballistic & CBRNE) Protective Gear Industry: SWOT Analysis……………………………………………… 314
18.2.1 Strengths………………………………………………… 314
18.2.2 Weaknesses……………………………………………. 314
18.2.3 Opportunities……………………………………………. 315
18.2.4 Threats…………………………………………………… 315
18.3 Personal (Ballistic & CBRNE) Protective Gear Market Drivers…………………………………………………………. 316
18.4 Personal (Ballistic & CBRNE) Protective Gear Market Inhibitors………………………………………………………. 317
18.5 Global Personal (Ballistic & CBRNE) Protective Gear Market – 2019-2026………………………………………… 318
18.5.1 Personal (Ballistic & CBRNE) Protective Gear Market – 2019-2026…………………………………… 318
18.5.2 Personal (Ballistic & CBRNE) Protective Gear Market Dynamics – 2019-2026…………………….. 319
18.5.3 Personal (Ballistic & CBRNE) Protective Gear Market Breakdown – 2019-2026…………………… 320
19 Standoff Explosives & Weapons Detection Market…… 322
19.1 Market & Technology Background……………………… 322
19.2 Standoff Explosives & Weapons Detection: Business Opportunities & Challenges………………………………. 331
19.3 Standoff Person-Borne and Vehicle-Borne Explosives & Weapons Detection Industry: SWOT Analysis……….. 332
19.4 Standoff Explosives & Weapons Detection: Market Drivers…………………………………………………………. 334
19.5 Standoff Explosives & Weapons Detection: Market Inhibitors………………………………………………………. 335
19.6 Global Standoff Explosives & Weapons Detection Market – 2019-2026………………………………………… 336
19.6.1 Standoff Explosives & Weapon Detection Market – 2019-2026……………………………………………….. 336
19.6.2 Standoff Explosives & Weapon Detection Market Dynamics – 2019-2026………………………………. 337
19.6.3 Standoff Explosives & Weapon Detection Market Breakdown – 2019-2026…………………………….. 338
20 Video Analytics Homeland Security & Public Safety Market……………………………………………………………….. 340
20.1 Market & Technology Background……………………… 340
20.2 Video Analytics: HLS & PS Applications………………. 344
20.3 Video Analytics: Business Opportunities………………. 346
20.4 Video Analytics Industry: SWOT Analysis…………….. 348
20.4.1 Strengths………………………………………………… 348
20.4.2 Weaknesses……………………………………………. 349
20.4.3 Opportunities……………………………………………. 350
20.4.4 Threats…………………………………………………… 351
20.4.5 Video Analytics Market Drivers…………………….. 354
20.4.6 Video Analytics Market Inhibitors………………….. 357
20.5 Global Video Analytics Homeland Security & Public Safety Market – 2019-2026………………………………. 358
20.5.1 Video Analytics Market – 2019-2026……………… 358
20.5.2 Video Analytics Market Dynamics – 2019-2026.. 360
20.5.3 Video Analytics Market Breakdown – 2019-2026 360
21 Video Security Surveillance (w/o Analytics) Market….. 362
21.1 Market & Technology Background……………………… 362
21.2 Video Surveillance: HLS & PS Applications………….. 369
21.3 Video Surveillance: Business Opportunities & Challenges……………………………………………………. 371
21.4 Video Surveillance Industry: SWOT Analysis………… 372
21.4.1 Strengths………………………………………………… 372
21.4.2 Weaknesses……………………………………………. 373
21.4.3 Opportunities……………………………………………. 374
21.4.4 Threats…………………………………………………… 374
21.5 Video Surveillance Market Drivers……………………… 375
21.6 Video Surveillance Market Inhibitors…………………… 375
21.7 Global Video Security Surveillance (w/o Analytics) Market – 2019-2026………………………………………… 376
21.7.1 Video Surveillance (w/o Analytics) Market – 2019-2026………………………………………………………. 376
21.7.2 Video Surveillance (w/o Analytics) Market Dynamics – 2019-2026…………………………………………….. 377
21.7.3 Video Surveillance (w/o Analytics) Market Breakdown – 2019-2026…………………………….. 378
22 X-Ray Security Screening Market…………………………… 380
22.1 Major Findings……………………………………………….. 380
22.2 Major Conclusions………………………………………….. 380
22.3 Market Dynamics & Opportunities………………………. 382
22.4 X-ray Screening Systems: Market Drivers…………….. 383
22.5 X-ray Screening Systems: Market Inhibitors………….. 384
22.6 X-ray Security Industry: Business Opportunities & Challenges……………………………………………………. 385
22.7 X-ray Screening Systems Industry: SWOT Analysis.. 386
22.7.1 Strengths………………………………………………… 386
22.7.2 Weaknesses……………………………………………. 387
22.7.3 Opportunities……………………………………………. 387
22.7.4 Threats…………………………………………………… 388
22.8 Barriers to Entry, Supplier Power, Buyer Power & Barriers to Substitution…………………………………….. 389
22.9 X-ray Security Screening Systems Technologies…… 390
22.9.1 X-ray Systems – Characteristics…………………… 390
22.9.2 X-ray Screening Systems – Principles of Operation……………………………………………………………… 391
22.9.3 Innocuous Materials Interference………………….. 392
22.9.4 Threat Image Projection (TIP)………………………. 393
22.9.5 Automated Target Detection………………………… 393
22.10 Current X-ray Baggage, Cargo, People, Container & Vehicle Screening Technologies………………………… 394
22.10.1 Major Technologies…………………………………… 394
22.10.2 2D X-ray, EDS and ETD Technologies – Pros and Cons………………………………………………………. 395
22.11 Global X-Ray Security Screening Market – 2019-2026 396
22.11.1 X-Ray Screening Market – 2019-2026…………… 396
22.11.2 X-Ray Screening Market Dynamics – 2019-2026 398
22.11.3 X-Ray Screening Market Breakdown – 2019-2026……………………………………………………………… 398
[Back to top]
Global Homeland Security & Public Safety (with COVID-19 & Vaccines Impact) Market – 2022-2026: Volume 4
Download the PDF
NATIONAL MARKETS…………………………………………………… 17
North America……………………………………………………………… 17
1 U.S. Homeland Security & Public Safety Market – 2019-2026……………………………………………………………………. 17
1.1 Market Background…………………………………………… 17
1.2 U.S. Homeland Security & Public Safety Market……… 17
1.2.1 U.S. Market by Revenue Source – 2019-2026…… 17
1.2.2 Market Dynamics – 2019-2026………………………. 18
1.2.3 Market Breakdown – 2019-2026…………………….. 18
2 Canada Homeland Security & Public Safety Market – 2019-2026…………………………………………………………….. 20
2.1 Market Background…………………………………………… 20
2.2 Canada Homeland Security & Public Safety Market…. 20
2.2.1 Canada Market by Revenue Source – 2019-2026. 20
2.2.2 Market Dynamics – 2019-2026………………………. 21
2.2.3 Market Breakdown – 2019-2026…………………….. 21
Latin America………………………………………………………………. 23
3 Mexico Homeland Security & Public Safety Market – 2019-2026…………………………………………………………….. 23
3.1 Market Background…………………………………………… 23
3.2 Mexico Homeland Security & Public Safety Market….. 23
3.2.1 Mexico Market by Revenue Source – 2019-2026.. 23
3.2.2 Market Dynamics – 2019-2026………………………. 24
3.2.3 Market Breakdown – 2019-2026…………………….. 24
4 Colombia Homeland Security & Public Safety Market – 2019-2026…………………………………………………………….. 26
4.1 Market Background…………………………………………… 26
4.2 Colombia Homeland Security & Public Safety Market.. 26
4.2.1 Colombia Market by Revenue Source – 2019-2026………………………………………………………………. 26
4.2.2 Market Dynamics – 2019-2026………………………. 27
4.2.3 Market Breakdown – 2019-2026…………………….. 27
5 Brazil Homeland Security & Public Safety Market – 2019-2026……………………………………………………………………. 29
5.1 Market Background…………………………………………… 29
5.2 Brazil Homeland Security & Public Safety Market……. 29
5.2.1 Brazil Market by Revenue Source – 2019-2026…. 29
5.2.2 Market Dynamics – 2019-2026………………………. 30
5.2.3 Market Breakdown – 2019-2026…………………….. 30
6 Argentina Homeland Security & Public Safety Market – 2019-2026…………………………………………………………….. 32
6.1 Market Background…………………………………………… 32
6.2 Argentina Homeland Security & Public Safety Market. 32
6.2.1 Argentina Market by Revenue Source – 2019-2026………………………………………………………………. 32
6.2.2 Market Dynamics – 2019-2026………………………. 33
6.2.3 Market Breakdown – 2019-2026…………………….. 33
7 Rest of Latin America Homeland Security & Public Safety Market – 2019-2026……………………………………………….. 35
7.1 Rest of Latin America Homeland Security & Public Safety Market………………………………………………….. 35
7.1.1 Rest of Latin America Market by Revenue Source – 2019-2026………………………………………………… 35
7.1.2 Market Dynamics – 2019-2026………………………. 36
7.1.3 Market Breakdown – 2019-2026…………………….. 36
Europe……………………………………………………………………….. 38
8 UK Homeland Security & Public Safety Market – 2019-2026……………………………………………………………………. 38
8.1 Market Background…………………………………………… 38
8.2 UK Homeland Security & Public Safety Market……….. 38
8.2.1 UK Market by Revenue Source – 2019-2026…….. 38
8.2.2 Market Dynamics – 2019-2026………………………. 39
8.2.3 Market Breakdown – 2019-2026…………………….. 39
9 France Homeland Security & Public Safety Market – 2019-2026……………………………………………………………………. 41
9.1 Market Background…………………………………………… 41
9.2 France Homeland Security & Public Safety Market….. 41
9.2.1 France Market by Revenue Source – 2019-2026.. 41
9.2.2 Market Dynamics – 2019-2026………………………. 42
9.2.3 Market Breakdown – 2019-2026…………………….. 42
10 Netherlands Homeland Security & Public Safety Market – 2019-2026…………………………………………………………….. 44
10.1 Market Background…………………………………………… 44
10.2 Netherlands Homeland Security & Public Safety Market 44
10.2.1 Netherlands Market by Revenue Source – 2019-2026………………………………………………………… 44
10.2.2 Market Dynamics – 2019-2026………………………. 45
10.2.3 Market Breakdown – 2019-2026…………………….. 45
11 Belgium Homeland Security & Public Safety Market – 2019-2026…………………………………………………………….. 47
11.1 Market Background…………………………………………… 47
11.2 Belgium Homeland Security & Public Safety Market…. 47
11.2.1 Belgium Market by Revenue Source – 2019-2026 47
11.2.2 Market Dynamics – 2019-2026………………………. 48
11.2.3 Market Breakdown – 2019-2026…………………….. 48
12 Sweden Homeland Security & Public Safety Market – 2019-2026…………………………………………………………….. 50
12.1 Market Background…………………………………………… 50
12.2 Sweden Homeland Security & Public Safety Market…. 50
12.2.1 Sweden Market by Revenue Source – 2019-2026 50
12.2.2 Market Dynamics – 2019-2026………………………. 51
12.2.3 Market Breakdown – 2019-2026…………………….. 51
13 Denmark Homeland Security & Public Safety Market – 2019-2026…………………………………………………………….. 53
13.1 Market Background…………………………………………… 53
13.2 Denmark Homeland Security & Public Safety Market.. 53
13.2.1 Denmark Market by Revenue Source – 2019-2026………………………………………………………………. 53
13.2.2 Market Dynamics – 2019-2026………………………. 54
13.2.3 Market Breakdown – 2019-2026…………………….. 54
14 Germany Homeland Security & Public Safety Market – 2019-2026…………………………………………………………….. 56
14.1 Market Background…………………………………………… 56
14.2 Germany Homeland Security & Public Safety Market.. 56
14.2.1 Germany Market by Revenue Source – 2019-2026………………………………………………………………. 56
14.2.2 Market Dynamics – 2019-2026………………………. 57
14.2.3 Market Breakdown – 2019-2026…………………….. 57
15 Austria Homeland Security & Public Safety Market – 2019-2026…………………………………………………………….. 59
15.1 Market Background…………………………………………… 59
15.2 Austria Homeland Security & Public Safety Market….. 59
15.2.1 Austria Market by Revenue Source – 2019-2026.. 59
15.2.2 Market Dynamics – 2019-2026………………………. 60
15.2.3 Market Breakdown – 2019-2026…………………….. 60
16 Italy Homeland Security & Public Safety Market – 2019-2026……………………………………………………………………. 62
16.1 Market Background…………………………………………… 62
16.2 Italy Homeland Security & Public Safety Market………. 62
16.2.1 Italy Market by Revenue Source – 2019-2026…… 62
16.2.2 Market Dynamics – 2019-2026………………………. 63
16.2.3 Market Breakdown – 2019-2026…………………….. 63
17 Spain Homeland Security & Public Safety Market – 2019-2026……………………………………………………………………. 65
17.1 Market Background…………………………………………… 65
17.2 Spain Homeland Security & Public Safety Market……. 65
17.2.1 Spain Market by Revenue Source – 2019-2026…. 65
17.2.2 Market Dynamics – 2019-2026………………………. 66
17.2.3 Market Breakdown – 2019-2026…………………….. 66
18 Poland Homeland Security & Public Safety Market – 2019-2026…………………………………………………………….. 68
18.1 Market Background…………………………………………… 68
18.2 Poland Homeland Security & Public Safety Market….. 68
18.2.1 Poland Market by Revenue Source – 2019-2026.. 68
18.2.2 Market Dynamics – 2019-2026………………………. 69
18.2.3 Market Breakdown – 2019-2026…………………….. 69
19 Czech Republic Homeland Security & Public Safety Market – 2019-2026……………………………………………….. 71
19.1 Market Background…………………………………………… 71
19.2 Czech Republic Homeland Security & Public Safety Market…………………………………………………………… 71
19.2.1 Czech Republic Market by Revenue Source – 2019-2026………………………………………………………… 71
19.2.2 Market Dynamics – 2019-2026………………………. 72
19.2.3 Market Breakdown – 2019-2026…………………….. 72
20 Russia Homeland Security & Public Safety Market – 2019-2026……………………………………………………………………. 74
20.1 Market Background…………………………………………… 74
20.2 Russia Homeland Security & Public Safety Market…… 74
20.2.1 Russia Market by Revenue Source – 2019-2026.. 74
20.2.2 Market Dynamics – 2019-2026………………………. 75
20.2.3 Market Breakdown – 2019-2026…………………….. 75
21 Rest of Europe Homeland Security & Public Safety Market – 2019-2026……………………………………………….. 77
21.1 Rest of Europe Homeland Security & Public Safety Market…………………………………………………………… 77
21.1.1 Rest of Europe Market by Revenue Source – 2019-2026………………………………………………………… 77
21.1.2 Market Dynamics – 2019-2026………………………. 78
21.1.3 Market Breakdown – 2019-2026…………………….. 78
Middle East & Africa…………………………………………………….. 80
22 Turkey Homeland Security & Public Safety Market – 2019-2026……………………………………………………………………. 80
22.1 Market Background…………………………………………… 80
22.2 Turkey Homeland Security & Public Safety Market…… 80
22.2.1 Turkey Market by Revenue Source – 2019-2026.. 80
22.2.2 Market Dynamics – 2019-2026………………………. 81
22.2.3 Market Breakdown – 2019-2026…………………….. 81
23 Israel Homeland Security & Public Safety Market – 2019-2026……………………………………………………………………. 83
23.1 Market Background…………………………………………… 83
23.2 Israel Homeland Security & Public Safety Market…….. 83
23.2.1 Israel Market by Revenue Source – 2019-2026…. 83
23.2.2 Market Dynamics – 2019-2026………………………. 84
23.2.3 Market Breakdown – 2019-2026…………………….. 84
24 Saudi Arabia Homeland Security & Public Safety Market – 2019-2026…………………………………………………………….. 86
24.1 Market Background…………………………………………… 86
24.2 Saudi Arabia Homeland Security & Public Safety Market 86
24.2.1 Saudi Arabia Market by Revenue Source – 2019-2026………………………………………………………… 86
24.2.2 Market Dynamics – 2019-2026………………………. 87
24.2.3 Market Breakdown – 2019-2026…………………….. 87
25 UAE Homeland Security & Public Safety Market – 2019-2026……………………………………………………………………. 89
25.1 Market Background…………………………………………… 89
25.2 UAE Homeland Security & Public Safety Market……… 89
25.2.1 UAE Market by Revenue Source – 2019-2026….. 89
25.2.2 Market Dynamics – 2019-2026………………………. 90
25.2.3 Market Breakdown – 2019-2026…………………….. 90
26 Qatar Homeland Security & Public Safety Market – 2019-2026……………………………………………………………………. 92
26.1 Market Background…………………………………………… 92
26.2 Qatar Homeland Security & Public Safety Market……. 92
26.2.1 Qatar Market by Revenue Source – 2019-2026…. 92
26.2.2 Market Dynamics – 2019-2026………………………. 93
26.2.3 Market Breakdown – 2019-2026…………………….. 93
27 Kuwait Homeland Security & Public Safety Market – 2019-2026……………………………………………………………………. 95
27.1 Market Background…………………………………………… 95
27.2 Kuwait Homeland Security & Public Safety Market…… 95
27.2.1 Kuwait Market by Revenue Source – 2019-2026.. 95
27.2.2 Market Dynamics – 2019-2026………………………. 96
27.2.3 Market Breakdown – 2019-2026…………………….. 96
28 Nigeria Homeland Security & Public Safety Market – 2019-2026…………………………………………………………….. 98
28.1 Market Background…………………………………………… 98
28.2 Nigeria Homeland Security & Public Safety Market….. 98
28.2.1 Nigeria Market by Revenue Source – 2019-2026.. 98
28.2.2 Market Dynamics – 2019-2026………………………. 98
28.2.3 Market Breakdown – 2019-2026…………………….. 99
29 South Africa Homeland Security & Public Safety Market – 2019-2026…………………………………………………………… 101
29.1 Market Background…………………………………………. 101
29.2 South Africa Homeland Security & Public Safety Market 101
29.2.1 South Africa Market by Revenue Source – 2019-2026………………………………………………………. 101
29.2.2 Market Dynamics – 2019-2026…………………….. 102
29.2.3 Market Breakdown – 2019-2026…………………… 102
30 Rest of MEA Homeland Security & Public Safety Market – 2019-2026…………………………………………………………… 104
30.1 Rest of MEA Homeland Security & Public Safety Market 104
30.1.1 Rest of MEA Market by Revenue Source – 2019-2026………………………………………………………. 104
30.1.2 Market Dynamics – 2019-2026…………………….. 104
30.1.3 Market Breakdown – 2019-2026…………………… 105
Asia-Pacific……………………………………………………………….. 106
31 India Homeland Security & Public Safety Market – 2019-2026…………………………………………………………………… 106
31.1 Market Background…………………………………………. 106
31.2 India Homeland Security & Public Safety Market……. 106
31.2.1 India Market by Revenue Source – 2019-2026… 106
31.2.2 Market Dynamics – 2019-2026…………………….. 107
31.2.3 Market Breakdown – 2019-2026…………………… 107
32 China Homeland Security & Public Safety Market – 2019-2026…………………………………………………………………… 109
32.1 Market Background…………………………………………. 109
32.2 China Homeland Security & Public Safety Market….. 109
32.2.1 China Market by Revenue Source – 2019-2026.. 109
32.2.2 Market Dynamics – 2019-2026…………………….. 110
32.2.3 Market Breakdown – 2019-2026…………………… 110
33 South Korea Homeland Security & Public Safety Market – 2019-2026…………………………………………………………… 112
33.1 Market Background…………………………………………. 112
33.2 South Korea Homeland Security & Public Safety Market 112
33.2.1 South Korea Market by Revenue Source – 2019-2026………………………………………………………. 112
33.2.2 Market Dynamics – 2019-2026…………………….. 113
33.2.3 Market Breakdown – 2019-2026…………………… 113
34 Japan Homeland Security & Public Safety Market – 2019-2026…………………………………………………………………… 115
34.1 Market Background…………………………………………. 115
34.2 Japan Homeland Security & Public Safety Market….. 115
34.2.1 Japan Market by Revenue Source – 2019-2026. 115
34.2.2 Market Dynamics – 2019-2026…………………….. 116
34.2.3 Market Breakdown – 2019-2026…………………… 116
35 Australia Homeland Security & Public Safety Market – 2019-2026…………………………………………………………… 118
35.1 Market Background…………………………………………. 118
35.2 Australia Homeland Security & Public Safety Market. 118
35.2.1 Australia Market by Revenue Source – 2019-2026……………………………………………………………… 118
35.2.2 Market Dynamics – 2019-2026…………………….. 119
35.2.3 Market Breakdown – 2019-2026…………………… 119
36 Azerbaijan Homeland Security & Public Safety Market – 2019-2026…………………………………………………………… 121
36.1 Market Background…………………………………………. 121
36.2 Azerbaijan Homeland Security & Public Safety Market 121
36.2.1 Azerbaijan Market by Revenue Source – 2019-2026……………………………………………………………… 121
36.2.2 Market Dynamics – 2019-2026…………………….. 122
36.2.3 Market Breakdown – 2019-2026…………………… 122
37 Kazakhstan Homeland Security & Public Safety Market – 2019-2026…………………………………………………………… 124
37.1 Market Background…………………………………………. 124
37.2 Kazakhstan Homeland Security & Public Safety Market 124
37.2.1 Kazakhstan Market by Revenue Source – 2019-2026………………………………………………………. 124
37.2.2 Market Dynamics – 2019-2026…………………….. 125
37.2.3 Market Breakdown – 2019-2026…………………… 125
38 Pakistan Homeland Security & Public Safety Market – 2019-2026…………………………………………………………… 127
38.1 Market Background…………………………………………. 127
38.2 Pakistan Homeland Security & Public Safety Market. 127
38.2.1 Pakistan Market by Revenue Source – 2019-2026……………………………………………………………… 127
38.2.2 Market Dynamics – 2019-2026…………………….. 127
38.2.3 Market Breakdown – 2019-2026…………………… 128
39 Taiwan Homeland Security & Public Safety Market – 2019-2026…………………………………………………………… 130
39.1 Market Background…………………………………………. 130
39.2 Taiwan Homeland Security & Public Safety Market… 130
39.2.1 Taiwan Market by Revenue Source – 2019-2026 130
39.2.2 Market Dynamics – 2019-2026…………………….. 131
39.2.3 Market Breakdown – 2019-2026…………………… 131
40 Singapore Homeland Security & Public Safety Market – 2019-2026…………………………………………………………… 133
40.1 Market Background…………………………………………. 133
40.2 Singapore Homeland Security & Public Safety Market 133
40.2.1 Singapore Market by Revenue Source – 2019-2026……………………………………………………………… 133
40.2.2 Market Dynamics – 2019-2026…………………….. 134
40.2.3 Market Breakdown – 2019-2026…………………… 134
41 Malaysia Homeland Security & Public Safety Market – 2019-2026…………………………………………………………… 136
41.1 Market Background…………………………………………. 136
41.2 Malaysia Homeland Security & Public Safety Market. 136
41.2.1 Malaysia Market by Revenue Source – 2019-2026……………………………………………………………… 136
41.2.2 Market Dynamics – 2019-2026…………………….. 137
41.2.3 Market Breakdown – 2019-2026…………………… 137
42 Indonesia Homeland Security & Public Safety Market – 2019-2026…………………………………………………………… 139
42.1 Market Background…………………………………………. 139
42.2 Indonesia Homeland Security & Public Safety Market 139
42.2.1 Indonesia Market by Revenue Source – 2019-2026……………………………………………………………… 139
42.2.2 Market Dynamics – 2019-2026…………………….. 140
42.2.3 Market Breakdown – 2019-2026…………………… 140
43 Rest of Asia Pacific Homeland Security & Public Safety Market – 2019-2026………………………………………………. 142
43.1 Rest of Asia Pacific Homeland Security & Public Safety Market………………………………………………………….. 142
43.1.1 Rest of Asia Pacific Market by Revenue Source – 2019-2026……………………………………………….. 142
43.1.2 Market Dynamics – 2019-2026…………………….. 142
43.1.3 Market Breakdown – 2019-2026…………………… 143
[Back to top]
Global Homeland Security & Public Safety (with COVID-19 & Vaccines Impact) Market – 2022-2026: Volume 5
Download the PDF
VENDORS…………………………………………………………………… 15
1 3DX-RAY……………………………………………………………… 15
1.1 Company Profile………………………………………………. 15
1.2 Homeland Security & Public Safety Products………….. 16
1.1 Contact Information………………………………………….. 18
2 3M………………………………………………………………………. 19
2.1 Company Profile………………………………………………. 19
2.2 Homeland Security & Public Safety Products………….. 20
2.3 Contact Information………………………………………….. 20
3 3xLOGIC………………………………………………………………. 21
3.1 Company Profile………………………………………………. 21
3.2 Homeland Security & Public Safety Products………….. 21
3.3 Contact Information………………………………………….. 22
4 ABB…………………………………………………………………….. 23
4.1 Company Profile………………………………………………. 23
4.2 Homeland Security & Public Safety Products………….. 24
4.3 Contact Information………………………………………….. 24
5 Accenture…………………………………………………………….. 25
5.1 Company Profile………………………………………………. 25
5.2 Homeland Security & Public Safety Products………….. 26
5.3 Contact Information………………………………………….. 26
6 ACTi Corporation………………………………………………….. 27
6.1 Company Profile………………………………………………. 27
6.2 Homeland Security & Public Safety Products………….. 27
6.3 Contact Information………………………………………….. 28
7 ADT Inc……………………………………………………………….. 29
7.1 Company Profile………………………………………………. 29
7.2 Homeland Security & Public Safety Products………….. 30
7.3 Contact Information………………………………………….. 30
8 AeroVironment Inc………………………………………………… 31
8.1 Company Profile………………………………………………. 31
8.2 Homeland Security & Public Safety Products………….. 32
8.3 Contact Information………………………………………….. 32
9 Agent Video Intelligence………………………………………… 33
9.1 Company Profile………………………………………………. 33
9.2 Homeland Security & Public Safety Products………….. 33
9.3 Contact Information………………………………………….. 34
10 Airbus Defence and Space……………………………………… 35
10.1 Company Profile………………………………………………. 35
10.2 Homeland Security & Public Safety Products………….. 36
10.3 Contact Information………………………………………….. 36
11 Alcatel-Lucent Enterprise (Nokia Group)………………….. 37
11.1 Company Profile………………………………………………. 37
11.2 Homeland Security & Public Safety Products………….. 38
11.3 Contact Information………………………………………….. 40
12 ALPHAOPEN………………………………………………………… 41
12.1 Company Profile………………………………………………. 41
12.2 Homeland Security & Public Safety Products………….. 41
12.3 Contact Information………………………………………….. 42
13 Anixter………………………………………………………………… 43
13.1 Company Profile………………………………………………. 43
13.2 Homeland Security & Public Safety Products………….. 43
13.3 Contact Information………………………………………….. 44
14 Aralia Systems……………………………………………………… 45
14.1 Company Profile………………………………………………. 45
14.2 Homeland Security & Public Safety Products………….. 45
14.3 Contact Information………………………………………….. 46
15 Astrophysics Inc…………………………………………………… 47
15.1 Company Profile………………………………………………. 47
15.2 Homeland Security & Public Safety Products………….. 48
1.3 Contact Information………………………………………….. 48
16 AT&T Inc……………………………………………………………… 50
16.1 Company Profile………………………………………………. 50
16.2 Homeland Security & Public Safety Products………….. 51
16.3 Contact Information………………………………………….. 51
17 Austal………………………………………………………………….. 52
17.1 Company Profile………………………………………………. 52
17.2 Homeland Security & Public Safety Products………….. 53
17.3 Contact Information………………………………………….. 53
18 Autoclear……………………………………………………………… 54
18.1 Company Profile………………………………………………. 54
18.2 Homeland Security & Public Safety Products………….. 55
1.4 Contact Information………………………………………….. 55
19 Avigilon Corporation……………………………………………… 56
19.1 Company Profile………………………………………………. 56
19.2 Homeland Security & Public Safety Products………….. 56
19.3 Contact Information………………………………………….. 57
20 Aware………………………………………………………………….. 58
20.1 Company Profile………………………………………………. 58
20.2 Homeland Security & Public Safety Products………….. 58
20.3 Contact Information………………………………………….. 59
21 Axis…………………………………………………………………….. 60
21.1 Company Profile………………………………………………. 60
21.2 Homeland Security & Public Safety Products………….. 60
21.3 Contact Information………………………………………….. 61
22 AxxonSoft……………………………………………………………. 62
22.1 Company Profile………………………………………………. 62
22.2 Homeland Security & Public Safety Products………….. 62
22.3 Contact Information………………………………………….. 63
23 Ayonix…………………………………………………………………. 64
23.1 Company Profile………………………………………………. 64
23.2 Homeland Security & Public Safety Products………….. 65
23.3 Contact Information………………………………………….. 65
24 BAE Systems……………………………………………………….. 66
24.1 Company Profile………………………………………………. 66
24.2 Homeland Security & Public Safety Products………….. 68
24.3 Contact Information………………………………………….. 68
25 BioEnable Technologies Pvt Ltd……………………………… 69
25.1 Company Profile………………………………………………. 69
25.2 Homeland Security & Public Safety Products………….. 69
25.3 Contact Information………………………………………….. 70
26 BioLink Solutions………………………………………………….. 71
26.1 Company Profile………………………………………………. 71
26.2 Homeland Security & Public Safety Products………….. 71
26.3 Contact Information………………………………………….. 72
27 Boeing…………………………………………………………………. 73
27.1 Company Profile………………………………………………. 73
27.2 Homeland Security & Public Safety Products………….. 74
27.3 Contact Information………………………………………….. 74
28 Bollinger Shipyards, Inc…………………………………………. 75
28.1 Company Profile………………………………………………. 75
28.2 Homeland Security & Public Safety Products………….. 76
28.3 Contact Information………………………………………….. 76
29 Bosch Security Systems………………………………………… 77
29.1 Company Profile………………………………………………. 77
29.2 Homeland Security & Public Safety Products………….. 77
29.3 Contact Information………………………………………….. 78
30 Bruker Corporation……………………………………………….. 79
30.1 Company Profile………………………………………………. 79
30.2 Homeland Security & Public Safety Products………….. 80
30.3 Contact Information………………………………………….. 81
31 BT………………………………………………………………………. 82
31.1 Company Profile………………………………………………. 82
31.2 Homeland Security & Public Safety Products………….. 83
31.3 Contact Information………………………………………….. 83
32 Camero……………………………………………………………….. 84
32.1 Company Profile………………………………………………. 84
32.2 Homeland Security & Public Safety Products………….. 84
32.3 Contact Information………………………………………….. 85
33 CelPlan………………………………………………………………… 86
33.1 Company Profile………………………………………………. 86
33.2 Homeland Security & Public Safety Products………….. 86
33.3 Contact Information………………………………………….. 87
34 China Security & Surveillance, Inc…………………………… 88
34.1 Company Profile………………………………………………. 88
34.2 Homeland Security & Public Safety Products………….. 88
34.3 Contact Information………………………………………….. 89
35 Cisco Systems……………………………………………………… 90
35.1 Company Profile………………………………………………. 90
35.2 Homeland Security & Public Safety Products………….. 91
35.3 Contact Information………………………………………….. 92
36 Citilog………………………………………………………………….. 93
36.1 Company Profile………………………………………………. 93
36.2 Homeland Security & Public Safety Products………….. 94
36.3 Contact Information………………………………………….. 94
37 Cognitec Systems GmbH……………………………………….. 95
37.1 Company Profile………………………………………………. 95
37.2 Homeland Security & Public Safety Products………….. 96
37.3 Contact Information………………………………………….. 96
38 Cognyte Software………………………………………………….. 97
38.1 Company Profile………………………………………………. 97
38.2 Homeland Security & Public Safety Products………….. 97
38.3 Contact Information………………………………………….. 98
39 Computer Network Limited (CNL)……………………………. 99
39.1 Company Profile………………………………………………. 99
39.2 Homeland Security & Public Safety Products………….. 99
39.3 Contact Information…………………………………………. 100
40 Diebold Nixdorf…………………………………………………… 101
40.1 Company Profile…………………………………………….. 101
40.2 Homeland Security & Public Safety Products………… 101
40.3 Contact Information…………………………………………. 101
41 Elbit Systems Ltd………………………………………………… 103
41.1 Company Profile…………………………………………….. 103
41.2 Homeland Security & Public Safety Products………… 104
41.3 Contact Information…………………………………………. 105
42 Emerson Electric…………………………………………………. 106
42.1 Company Profile…………………………………………….. 106
42.2 Homeland Security & Public Safety Products………… 107
42.3 Contact Information…………………………………………. 107
43 Ericsson…………………………………………………………….. 108
43.1 Company Profile…………………………………………….. 108
43.2 Homeland Security & Public Safety Products………… 108
43.3 Contact Information…………………………………………. 109
44 ESRI………………………………………………………………….. 110
44.1 Company Profile…………………………………………….. 110
44.2 Homeland Security & Public Safety Products………… 111
44.3 Contact Information…………………………………………. 114
45 Eurologix Security Ltd…………………………………………. 115
45.1 Company Profile…………………………………………….. 115
45.2 Homeland Security & Public Safety Products………… 115
45.3 Contact Information…………………………………………. 116
46 FaceFirst……………………………………………………………. 118
46.1 Company Profile…………………………………………….. 118
46.2 Homeland Security & Public Safety Products………… 119
46.3 Contact Information…………………………………………. 119
47 Firetide………………………………………………………………. 120
47.1 Company Profile…………………………………………….. 120
47.2 Homeland Security & Public Safety Products………… 120
47.3 Contact Information…………………………………………. 121
48 Fulcrum Biometrics LLC………………………………………. 122
48.1 Company Profile…………………………………………….. 122
48.2 Products……………………………………………………….. 123
48.3 Contact Information…………………………………………. 125
49 G4S…………………………………………………………………… 126
49.1 Company Profile…………………………………………….. 126
49.2 Homeland Security & Public Safety Products………… 126
49.3 Contact Information…………………………………………. 127
50 General Atomics Aeronautical Systems Inc…………….. 128
50.1 Company Profile…………………………………………….. 128
50.2 Homeland Security & Public Safety Products………… 129
50.3 Contact Information…………………………………………. 129
51 General Dynamics Corporation……………………………… 130
51.1 Company Profile…………………………………………….. 130
51.2 Homeland Security & Public Safety Products………… 131
51.3 Contact Information…………………………………………. 131
52 Getac Technology Corporation……………………………… 132
52.1 Company Profile…………………………………………….. 132
52.2 Homeland Security & Public Safety Products………… 133
52.3 Contact Information…………………………………………. 133
53 Hanwha Techwin…………………………………………………. 134
53.1 Company Profile…………………………………………….. 134
53.2 Homeland Security & Public Safety Products………… 135
53.3 Contact Information…………………………………………. 135
54 Hewlett Packard Enterprise…………………………………… 136
54.1 Company Profile…………………………………………….. 136
54.2 Homeland Security & Public Safety Products………… 136
54.3 Contact Information…………………………………………. 137
55 Hexagon AB……………………………………………………….. 138
55.1 Company Profile…………………………………………….. 138
55.2 Homeland Security & Public Safety Products………… 138
55.3 Contact Information…………………………………………. 139
56 HID Global………………………………………………………….. 140
56.1 Company Profile…………………………………………….. 140
56.2 Homeland Security & Public Safety Products………… 140
56.3 Contact Information…………………………………………. 142
57 Honeywell International Inc…………………………………… 143
57.1 Company Profile…………………………………………….. 143
57.2 Homeland Security & Public Safety Products………… 144
57.3 Contact Information…………………………………………. 145
58 Huawei Technologies Co., Ltd……………………………….. 146
58.1 Company Profile…………………………………………….. 146
58.2 Homeland Security & Public Safety Products………… 147
58.3 Contact Information…………………………………………. 148
59 IBM……………………………………………………………………. 149
59.1 Company Profile…………………………………………….. 149
59.2 Homeland Security & Public Safety Products………… 150
59.3 Contact Information…………………………………………. 151
60 IDEMIA………………………………………………………………. 152
60.1 Company Profile…………………………………………….. 152
60.2 Homeland Security & Public Safety Products………… 153
60.3 Contact Information…………………………………………. 153
61 Identiv……………………………………………………………….. 154
61.1 Company Profile…………………………………………….. 154
61.2 Homeland Security & Public Safety Products………… 155
61.3 Contact Information…………………………………………. 155
62 IndigoVision……………………………………………………….. 156
62.1 Company Profile…………………………………………….. 156
62.2 Homeland Security & Public Safety Products………… 156
62.3 Contact Information…………………………………………. 156
63 Intel Security………………………………………………………. 157
63.1 Company Profile…………………………………………….. 157
63.2 Homeland Security & Public Safety Products………… 157
63.3 Contact Information…………………………………………. 158
64 IntuVision Inc……………………………………………………… 159
64.1 Company Profile…………………………………………….. 159
64.2 Homeland Security & Public Safety Products………… 159
64.3 Contact Information…………………………………………. 160
65 Inward Detection…………………………………………………. 161
65.1 Company Profile…………………………………………….. 161
65.2 Homeland Security & Public Safety Products………… 162
65.3 Contact Information…………………………………………. 162
66 iOmniscient………………………………………………………… 163
66.1 Company Profile…………………………………………….. 163
66.2 Homeland Security & Public Safety Products………… 163
66.3 Contact Information…………………………………………. 165
67 IPConfigure………………………………………………………… 166
67.1 Company Profile…………………………………………….. 166
67.2 Homeland Security & Public Safety Products………… 166
67.3 Contact Information…………………………………………. 166
68 IPS Intelligent Video Analytics………………………………. 167
68.1 Company Profile…………………………………………….. 167
68.2 Homeland Security & Public Safety Products………… 167
68.3 Contact Information…………………………………………. 168
69 Iris ID Systems, Inc………………………………………………. 169
69.1 Company Profile…………………………………………….. 169
69.2 Homeland Security & Public Safety Products………… 170
69.3 Contact Information…………………………………………. 170
70 IriTech Inc………………………………………………………….. 171
70.1 Company Profile…………………………………………….. 171
70.2 Homeland Security & Public Safety Products………… 171
70.3 Contact Information…………………………………………. 172
71 Israel Aerospace Industries Ltd…………………………….. 173
71.1 Company Profile…………………………………………….. 173
71.2 Homeland Security & Public Safety Products………… 174
71.3 Contact Information…………………………………………. 175
72 ISS…………………………………………………………………….. 176
72.1 Company Profile…………………………………………….. 176
72.2 Homeland Security & Public Safety Products………… 176
72.3 Contact Information…………………………………………. 177
73 L3Harris Technologies, Inc…………………………………… 178
73.1 Company Profile…………………………………………….. 178
73.2 Homeland Security & Public Safety Products………… 179
73.3 Contact Information…………………………………………. 179
74 Leidos, Inc………………………………………………………….. 180
74.1 Company Profile…………………………………………….. 180
74.2 Homeland Security & Public Safety Products………… 181
74.3 Contact Information…………………………………………. 181
75 Leonardo……………………………………………………………. 182
75.1 Company Profile…………………………………………….. 182
75.2 Homeland Security & Public Safety Products………… 183
75.3 Contact Information…………………………………………. 183
76 Lockheed Martin Corporation……………………………….. 184
76.1 Company Profile…………………………………………….. 184
76.2 Homeland Security & Public Safety Products………… 185
76.3 Contact Information…………………………………………. 186
77 MACROSCOP……………………………………………………… 187
77.1 Company Profile…………………………………………….. 187
77.2 Homeland Security & Public Safety Products………… 187
77.3 Contact Information…………………………………………. 187
78 MDS…………………………………………………………………… 188
78.1 Company Profile…………………………………………….. 188
78.2 Homeland Security & Public Safety Products………… 188
78.3 Contact Information…………………………………………. 189
79 Mer Group………………………………………………………….. 190
79.1 Company Profile…………………………………………….. 190
79.2 Homeland Security & Public Safety Products………… 191
79.3 Contact Information…………………………………………. 193
80 Milestone Systems A/S…………………………………………. 194
80.1 Company Profile…………………………………………….. 194
80.2 Homeland Security & Public Safety Products………… 194
80.3 Contact Information…………………………………………. 194
81 Mirasys………………………………………………………………. 195
81.1 Company Profile…………………………………………….. 195
81.2 Homeland Security & Public Safety Products………… 195
81.3 Contact Information…………………………………………. 195
82 Motorola Solutions, Inc………………………………………… 196
82.1 Company Profile…………………………………………….. 196
82.2 Homeland Security & Public Safety Products………… 197
82.3 Contact Information…………………………………………. 200
83 National Instruments……………………………………………. 201
83.1 Company Profile…………………………………………….. 201
83.2 Homeland Security & Public Safety Products………… 201
83.3 Contact Information…………………………………………. 201
84 NEC Corporation…………………………………………………. 202
84.1 Company Profile…………………………………………….. 202
84.2 Homeland Security & Public Safety Products………… 203
84.3 Contact Information…………………………………………. 204
85 NICE Systems…………………………………………………….. 205
85.1 Company Profile…………………………………………….. 205
85.2 Homeland Security & Public Safety Products………… 205
85.3 Contact Information…………………………………………. 206
86 Northrop Grumman Corporation……………………………. 207
86.1 Company Profile…………………………………………….. 207
86.2 Homeland Security & Public Safety Products………… 208
86.3 Contact Information…………………………………………. 209
87 Nuance Communications, Inc……………………………….. 210
87.1 Company Profile…………………………………………….. 210
87.2 Homeland Security & Public Safety Products………… 211
87.3 Contact Information…………………………………………. 211
88 Nuctech Co. Ltd…………………………………………………… 212
88.1 Company Profile…………………………………………….. 212
88.2 Homeland Security & Public Safety Products………… 213
88.3 Contact Information…………………………………………. 213
89 ObjectVideo………………………………………………………… 214
89.1 Company Profile…………………………………………….. 214
89.2 Homeland Security & Public Safety Products………… 214
89.3 Contact Information…………………………………………. 215
90 OSI Systems Company…………………………………………. 216
90.1 Company Profile…………………………………………….. 216
90.2 Homeland Security & Public Safety Products………… 217
90.3 Contact Information…………………………………………. 218
91 Panasonic Corporation………………………………………… 219
91.1 Company Profile…………………………………………….. 219
91.2 Homeland Security & Public Safety Products………… 220
91.3 Contact Information…………………………………………. 222
92 Pivot3………………………………………………………………… 223
92.1 Company Profile…………………………………………….. 223
92.2 Homeland Security & Public Safety Products………… 224
92.3 Contact Information…………………………………………. 224
93 Proximex……………………………………………………………. 225
93.1 Company Profile…………………………………………….. 225
93.2 Homeland Security & Public Safety Products………… 225
93.3 Contact Information…………………………………………. 225
94 QinetiQ Limited…………………………………………………… 226
94.1 Company Profile…………………………………………….. 226
94.2 Homeland Security & Public Safety Products………… 227
94.3 Contact Information…………………………………………. 227
95 Rapiscan Systems, Inc…………………………………………. 228
95.1 Company Profile…………………………………………….. 228
95.2 Homeland Security & Public Safety Products………… 229
95.3 Contact Information…………………………………………. 232
96 Raytheon……………………………………………………………. 233
96.1 Company Profile…………………………………………….. 233
96.2 Homeland Security & Public Safety Products………… 234
96.3 Contact Information…………………………………………. 235
97 Salient Sciences………………………………………………….. 236
97.1 Company Profile…………………………………………….. 236
97.2 Homeland Security & Public Safety Products………… 236
97.3 Contact Information…………………………………………. 236
98 Schneider Electric……………………………………………….. 237
98.1 Company Profile…………………………………………….. 237
98.2 Homeland Security & Public Safety Products………… 237
98.3 Contact Information…………………………………………. 238
99 Siemens…………………………………………………………….. 239
99.1 Company Profile…………………………………………….. 239
99.2 Homeland Security & Public Safety Products………… 240
99.3 Contact Information…………………………………………. 240
100 Smiths Detection Inc……………………………………………. 241
100.1 Company Profile…………………………………………….. 241
100.2 Homeland Security & Public Safety Products………… 242
100.3 Contact Information…………………………………………. 244
101 Sony Corp………………………………………………………….. 245
101.1 Company Profile…………………………………………….. 245
101.2 Homeland Security & Public Safety Products………… 245
101.3 Contact Information…………………………………………. 246
102 Speech Technology Center…………………………………… 247
102.1 Company Profile…………………………………………….. 247
102.2 Homeland Security & Public Safety Products………… 248
102.3 Contact Information…………………………………………. 248
103 Suprema Inc……………………………………………………….. 249
103.1 Company Profile…………………………………………….. 249
103.2 Homeland Security & Public Safety Products………… 250
103.3 Contact Information…………………………………………. 250
104 Synectics Plc………………………………………………………. 251
104.1 Company Profile…………………………………………….. 251
104.2 Homeland Security & Public Safety Products………… 251
104.3 Contact Information…………………………………………. 252
105 Tandu Technologies & Security Systems Ltd………….. 253
105.1 Company Profile…………………………………………….. 253
105.2 Contact Information…………………………………………. 253
106 Texas Instruments……………………………………………….. 254
106.1 Company Profile…………………………………………….. 254
106.2 Homeland Security & Public Safety Products………… 254
106.3 Contact Information…………………………………………. 256
107 Textron Inc…………………………………………………………. 257
107.1 Company Profile…………………………………………….. 257
107.2 Homeland Security & Public Safety Products………… 258
107.3 Contact Information…………………………………………. 259
108 Thales Group………………………………………………………. 260
108.1 Company Profile…………………………………………….. 260
108.2 Homeland Security & Public Safety Products………… 261
108.3 Contact Information…………………………………………. 261
109 Total Recall………………………………………………………… 262
109.1 Company Profile…………………………………………….. 262
109.2 Homeland Security & Public Safety Products………… 263
109.3 Contact Information…………………………………………. 263
110 Unisys Corporation……………………………………………… 264
110.1 Company Profile…………………………………………….. 264
110.2 Homeland Security & Public Safety Products………… 265
110.3 Contact Information…………………………………………. 265
111 Vanderlande……………………………………………………….. 266
111.1 Company Profile…………………………………………….. 266
111.2 Homeland Security & Public Safety Products………… 267
111.3 Contact Information…………………………………………. 268
112 Verint…………………………………………………………………. 269
112.1 Company Profile…………………………………………….. 269
112.2 Homeland Security & Public Safety Products………… 270
112.3 Contact Information…………………………………………. 270
113 Vialogy LLC………………………………………………………… 271
113.1 Company Profile…………………………………………….. 271
113.2 Homeland Security & Public Safety Products………… 271
113.3 Contact Information…………………………………………. 272
114 VisiConsult…………………………………………………………. 273
114.1 Company Profile…………………………………………….. 273
114.2 Homeland Security & Public Safety Products………… 273
114.3 Contact Information…………………………………………. 274
115 Zhejiang Dahua Technology…………………………………. 275
115.1 Company Profile…………………………………………….. 275
115.2 Homeland Security & Public Safety Products………… 275
115.3 Contact Information…………………………………………. 276
[Back to top]
Global Homeland Security & Public Safety (with COVID-19 & Vaccines Impact) Market – 2022-2026: Volume 6
Download the PDF
APPENDIX A: NATIONAL MARKETS BACKGROUND………… 15
North America……………………………………………………………… 15
1 U.S. Homeland Security & Public Safety Market………… 15
1.1 U.S. Homeland Security & Public Safety Market Background…………………………………………………….. 15
1.1.1 Facts & Figures 2020…………………………………… 15
1.1.2 U.S. Public Safety & Homeland Security: Introduction……………………………………………….. 15
1.1.3 Terror in the U.S…………………………………………. 19
1.2 U.S. Federal Homeland Security Related Organizations 19
1.2.1 Department of Homeland Security (DHS)…………. 21
1.2.2 Department of Homeland Security: Agencies and Units………………………………………………………… 22
1.2.3 DHS – Transportation Security Administration (TSA)………………………………………………………………. 24
1.2.4 DHS – U.S. Customs & Border Protection (CBP).. 26
1.2.5 DHS – Federal Emergency Management Agency (FEMA)…………………………………………………….. 26
1.2.6 DHS – U.S. Immigration & Customs Enforcement (ICE)………………………………………………………… 27
1.2.7 DHS – U.S. Coast Guard (USCG)…………………… 27
1.2.8 U.S. Secret Service (USSS)………………………….. 28
1.2.9 DHS – Science & Technology Directorate (S&T)… 28
1.2.10 DHS – Domestic Nuclear Detection Office (DNDO)………………………………………………………………. 29
1.2.11 DHS – U.S. Citizenship & Immigration Services (USCIS)……………………………………………………. 30
1.2.12 DHS – National Protection and Programs Directorate (NPPD)……………………………………… 31
1.2.13 Department of Defense (DOD)………………………. 32
1.2.14 Department of Justice (DOJ)…………………………. 32
1.2.15 Federal Bureau of Investigation (FBI)………………. 34
1.2.16 Department of State (DOS)…………………………… 35
1.2.17 National Aeronautic & Space Administration (NASA)………………………………………………………………. 36
1.2.18 Department of Transportation (DOT)……………….. 37
1.2.19 Department of Commerce (DOC)…………………… 37
1.3 U.S. Police Forces……………………………………………. 38
1.4 U.S. Airports Security Statistics…………………………… 39
1.4.1 Air Passengers Checkpoint CCTV Support Program………………………………………………………………. 46
1.4.2 CCTV Assisted Secure Flight Program……………. 46
1.5 U.S. Land Border Security………………………………….. 47
1.5.1 Introduction……………………………………………….. 47
1.5.2 U.S. Land Border Security Components…………… 49
1.5.3 Southwest Border……………………………………….. 49
1.5.4 Northern Border…………………………………………. 50
1.5.5 Trusted Traveler, Expedited Clearance and Other Partnerships………………………………………………. 51
1.6 U.S. Critical Infrastructure Security………………………. 51
1.6.1 Scope………………………………………………………. 51
1.6.2 Major Findings……………………………………………. 52
1.6.3 Critical Infrastructure Security Tactics……………… 54
1.6.4 Critical Infrastructure Vulnerabilities………………… 55
1.6.5 Planning of Infrastructure Security………………….. 56
1.6.6 Critical Infrastructure Strategy Outlook…………….. 56
1.6.7 Information Sharing with the Private Sector………. 57
1.6.8 Food and Agro-Terror Market Outlook…………….. 58
1.6.9 CIP Terror Mitigation Outlook………………………… 60
1.7 U.S. Maritime Security………………………………………. 62
1.7.1 Scope………………………………………………………. 62
1.7.2 Major Findings & Conclusions……………………….. 63
1.7.3 Maritime Security Infrastructure……………………… 65
1.7.4 Port Critical Infrastructure Operations……………… 66
1.7.5 The Container Security Initiative (CSI)…………….. 67
1.8 U.S. Land Transportation Security……………………….. 68
1.8.1 Scope………………………………………………………. 68
1.8.2 Land Transportation Security: Background……….. 69
1.8.3 Mass Transit Security………………………………….. 70
1.9 U.S. Energy Sector Security……………………………….. 71
1.9.1 Scope………………………………………………………. 71
1.9.2 U.S. Energy Sector Security: Background………… 71
1.10 U.S. Public Events Security………………………………… 73
1.10.1 Scope………………………………………………………. 73
1.10.2 U.S. Natural & Manmade Disaster Mitigation…….. 73
2 Canada Homeland Security & Public Safety Market……. 76
2.1 Canada Homeland Security & Public Safety Market Background…………………………………………………….. 76
2.1.1 Facts & Figures 2020…………………………………… 76
2.1.2 Canada Geopolitical Overview………………………. 76
2.1.3 Crime in Canada………………………………………… 77
2.1.4 Terror in Canada………………………………………… 77
2.1.5 Canada’s Counter Terror & Law Enforcement Legislation………………………………………………… 78
2.1.6 Canada’s Homeland Security & Public Safety Agencies…………………………………………………… 79
2.1.7 Canada’s Police Forces……………………………….. 80
2.1.8 Canada’s Security Intelligence Services…………… 80
2.1.9 Canada’s Defense Forces…………………………….. 81
2.1.10 Canada: Airport Security Statistics………………….. 81
2.1.11 Canada Border Security……………………………….. 82
Latin America………………………………………………………………. 84
3 Mexico Homeland Security & Public Safety Market……. 84
3.1 Mexico Homeland Security & Public Safety Market Background…………………………………………………….. 84
3.1.1 Facts & Figures 2020…………………………………… 84
3.1.2 Mexico Geopolitical Overview………………………… 84
3.1.3 Mexico Homeland Security & Public Safety Industry………………………………………………………………. 85
3.1.4 Crime in Mexico…………………………………………. 88
3.1.5 Terror in Mexico…………………………………………. 90
3.1.6 Mexico’s Counter Terror Legislation & Law Enforcement……………………………………………… 90
3.1.7 Mexico’s Homeland Security & Public Safety Agencies…………………………………………………… 91
3.1.8 Mexico’s Police Forces………………………………… 91
3.1.9 Mexico’s Intelligence Services……………………….. 93
3.1.10 Mexico’s Defense Forces……………………………… 93
3.1.11 Mexico: Safe City Projects……………………………. 95
3.1.12 Mexico: Airport Security Statistics…………………. 100
4 Colombia Homeland Security & Public Safety Market.. 102
4.1 Colombia Homeland Security & Public Safety Market Background…………………………………………………… 102
4.1.1 Facts & Figures 2020…………………………………. 102
4.1.2 Colombia Geopolitical Overview…………………… 102
4.1.3 Colombia Homeland Security & Public Safety Industry…………………………………………………… 103
4.1.4 Crime in Colombia…………………………………….. 105
4.1.5 Terror in Colombia…………………………………….. 105
4.1.6 Colombia’s Counter Terror Legislation & Law Enforcement…………………………………………….. 106
4.1.7 Colombia’s Homeland Security & Public Safety Agencies…………………………………………………. 107
4.1.8 Colombia’s Police Forces……………………………. 107
4.1.9 Colombia’s Intelligence Services…………………… 107
4.1.10 Colombia’s Defense Forces…………………………. 108
4.1.11 Colombia: Airport Security Statistics………………. 109
5 Brazil Homeland Security & Public Safety Market…….. 110
5.1 Brazil Homeland Security & Public Safety Market Background…………………………………………………… 110
5.1.1 Facts & Figures 2020…………………………………. 110
5.1.2 Brazil Geopolitical Overview………………………… 110
5.1.3 Brazil Homeland Security & Public Safety Industry……………………………………………………………… 112
5.1.4 Crime in Brazil………………………………………….. 113
5.1.5 Terror in Brazil………………………………………….. 114
5.1.6 Brazil’s Counter Terror Legislation & Law Enforcement…………………………………………….. 115
5.1.7 Brazil’s Homeland Security & Public Safety Agencies…………………………………………………. 115
5.1.8 Brazil’s Police Forces…………………………………. 116
5.1.9 Brazil’s Intelligence Services……………………….. 116
5.1.10 Brazil’s Defense Forces……………………………… 117
5.1.11 Brazil: Safe City Projects…………………………….. 117
5.1.12 Brazil: Airport Security Statistics…………………… 118
5.1.13 Brazil Border Security………………………………… 120
6 Argentina Homeland Security & Public Safety Market. 122
6.1 Argentina Homeland Security & Public Safety Market Background…………………………………………………… 122
6.1.1 Facts & Figures 2020…………………………………. 122
6.1.2 Argentina Geopolitical Overview…………………… 122
6.1.3 Argentina Homeland Security & Public Safety Industry…………………………………………………… 122
6.1.4 Crime in Argentina…………………………………….. 123
6.1.5 Terror in Argentina…………………………………….. 124
6.1.6 Argentina’s Counter Terror Legislation & Law Enforcement…………………………………………….. 124
6.1.7 Argentina’s Homeland Security & Public Safety Agencies…………………………………………………. 125
6.1.8 Argentina’s Police Forces……………………………. 126
6.1.9 Argentina’s Intelligence Services………………….. 126
6.1.10 Argentina’s Defense Forces………………………… 127
6.1.11 Argentina: Airport Security Statistics……………… 127
6.1.12 Argentina Border Security…………………………… 128
Europe……………………………………………………………………… 130
7 UK Homeland Security & Public Safety Market………… 130
7.1 UK Homeland Security & Public Safety Market Background…………………………………………………… 130
7.1.1 Facts & Figures 2020…………………………………. 130
7.1.2 UK Geopolitical Overview……………………………. 130
7.1.3 The Brexit Effects……………………………………… 131
7.1.4 UK Homeland Security & Public Safety: Market Background……………………………………………… 132
7.1.5 UK National Security Risk Assessment 2018…… 135
7.1.6 Crime in the UK………………………………………… 136
7.1.7 Terror in the UK………………………………………… 136
7.1.8 UK Counter Terror & Law Enforcement Legislation……………………………………………………………… 142
7.1.9 UK Homeland Security & Public Safety Agencies 148
7.1.10 UK Police Forces………………………………………. 148
7.1.11 UK Intelligence Services…………………………….. 151
7.1.12 UK Defense Forces…………………………………… 156
7.1.13 UK: Safe City Projects………………………………… 156
7.1.14 UK: Airport Security Statistics………………………. 160
7.1.15 UK Border Security……………………………………. 162
8 Germany Homeland Security & Public Safety Market.. 173
8.1 Germany Homeland Security & Public Safety Market Background…………………………………………………… 173
8.1.1 Facts & Figures 2020…………………………………. 173
8.1.2 Germany Geopolitical Overview……………………. 173
8.1.3 Germany: Economy, Immigration & Terror………. 174
8.1.4 Germany Homeland Security & Public Safety Industry: Background…………………………………. 180
8.1.5 Crime in Germany…………………………………….. 181
8.1.6 Terror in Germany…………………………………….. 181
8.1.7 Germany’s Counter Terror Legislation & Law Enforcement…………………………………………….. 182
8.1.8 Germany’s Terror Challenge & Counter Terror Strategy………………………………………………….. 184
8.1.9 Germany’s Homeland Security & Public Safety Agencies…………………………………………………. 194
8.1.10 Germany’s Police Forces……………………………. 194
8.1.11 Germany’s Intelligence Services…………………… 198
8.1.12 Germany’s Defense Forces…………………………. 200
8.1.13 Germany’s Safe City………………………………….. 200
8.1.14 Germany: Airport Security Statistics………………. 206
8.1.15 Germany Border Security……………………………. 207
9 France Homeland Security & Public Safety Market…… 215
9.1 France Homeland Security & Public Safety Market Background…………………………………………………… 215
9.1.1 Facts & Figures 2020…………………………………. 215
9.1.2 France Geopolitical Overview………………………. 215
9.1.3 France Homeland Security & Public Safety Industry……………………………………………………………… 216
9.1.4 Crime in France………………………………………… 216
9.1.5 Terror in France………………………………………… 217
9.1.6 France’s Terror Threats & Counter Terror Strategy……………………………………………………………… 222
9.1.7 French Anti-Terror Legislation……………………… 227
9.1.8 France’s Homeland Security & Public Safety Agencies…………………………………………………. 231
9.1.9 France’s Police Forces……………………………….. 231
9.1.10 France’s Intelligence Services……………………… 236
9.1.11 France’s Defense Forces……………………………. 239
9.1.12 France: Safe City Projects…………………………… 240
9.1.13 France: Airport Security Statistics…………………. 241
9.1.14 France Border Security………………………………. 242
10 Spain Homeland Security & Public Safety Market…….. 253
10.1 Spain Homeland Security & Public Safety Market Background…………………………………………………… 253
10.1.1 Facts & Figures 2020…………………………………. 253
10.1.2 Spain Geopolitical Overview………………………… 253
10.1.3 Spain Homeland Security & Public Safety Industry……………………………………………………………… 254
10.1.4 Crime in Spain………………………………………….. 256
10.1.5 Terror in Spain…………………………………………. 256
10.1.6 Spain’s Counter Terror Legislation & Law Enforcement…………………………………………….. 257
10.1.7 Spain’s Homeland Security & Public Safety Agencies…………………………………………………. 258
10.1.8 Spain’s Police Forces………………………………… 258
10.1.9 Spain’s Intelligence Services……………………….. 261
10.1.10 Spain’s Defense Forces……………………………… 263
10.1.11 Spain: Safe City Projects…………………………….. 263
10.1.12 Spain: Airport Security Statistics…………………… 267
11 Italy Homeland Security & Public Safety Market………. 269
11.1 Italy Homeland Security & Public Safety Market Background…………………………………………………… 269
11.1.1 Facts & Figures 2020…………………………………. 269
11.1.2 Italy Geopolitical Overview………………………….. 269
11.1.3 Italy Homeland Security & Public Safety Industry 270
11.1.4 Crime in Italy……………………………………………. 272
11.1.5 Terror in Italy……………………………………………. 273
11.1.6 Italy’s Counter Terror Legislation & Law Enforcement…………………………………………….. 273
11.1.7 Italy’s Homeland Security & Public Safety Agencies……………………………………………………………… 274
11.1.8 Italy’s Police Forces…………………………………… 275
11.1.9 Italy’s Intelligence Services…………………………. 277
11.1.10 Italy’s Defense Forces………………………………… 279
11.1.11 Italy: Safe City Projects………………………………. 279
11.1.12 Italy: Airport Security Statistics…………………….. 281
11.1.13 Italy Border Security…………………………………… 282
12 Poland Homeland Security & Public Safety Market…… 285
12.1 Poland Homeland Security & Public Safety Market Background…………………………………………………… 285
12.1.1 Facts & Figures 2020…………………………………. 285
12.1.2 Poland Geopolitical Overview………………………. 285
12.1.3 Poland Homeland Security & Public Safety Industry……………………………………………………………… 285
12.1.4 Crime in Poland………………………………………… 286
12.1.5 Terror in Poland………………………………………… 287
12.1.6 Poland’s Counter Terror Legislation & Law Enforcement…………………………………………….. 287
12.1.7 Poland’s Homeland & Public Safety Agencies…. 287
12.1.8 Poland’s Police Forces……………………………….. 288
12.1.9 Poland’s Intelligence Services……………………… 289
12.1.10 Poland’s Defense Forces……………………………. 290
12.1.11 Poland: Safe City Projects…………………………… 290
12.1.12 Poland: Airport Security Statistics…………………. 291
12.1.13 Poland Border Security………………………………. 291
13 Russia Homeland Security & Public Safety Market…… 293
13.1 Russia Homeland Security & Public Safety Market Background…………………………………………………… 293
13.1.1 Facts & Figures 2020…………………………………. 293
13.1.2 Russia Geopolitical Overview………………………. 293
13.1.3 Russia Homeland Security & Public Safety Industry……………………………………………………………… 294
13.1.4 Crime in Russia………………………………………… 295
13.1.5 Russia’s Counter Terror Legislation & Law Enforcement…………………………………………….. 296
13.1.6 Russia’s Homeland Security & Public Safety Agencies…………………………………………………. 297
13.1.7 Russia’s Police Forces……………………………….. 298
13.1.8 Russia’s Intelligence Services……………………… 298
13.1.9 Russia’s Defense Forces……………………………. 299
13.1.10 Russia: Airport Security Statistics…………………. 300
13.1.11 Russia Border Security………………………………. 302
14 Sweden Homeland Security & Public Safety Market…. 303
14.1 Sweden Homeland Security & Public Safety Market Background…………………………………………………… 303
14.1.1 Facts & Figures 2020…………………………………. 303
14.1.2 Sweden Geopolitical Overview…………………….. 303
14.1.3 Sweden Homeland Security & Public Safety Industry……………………………………………………………… 303
14.1.4 Crime in Sweden………………………………………. 304
14.1.5 Terror in Sweden………………………………………. 304
14.1.6 Sweden’s Counter Terror Legislation & Law Enforcement…………………………………………….. 305
14.1.7 Sweden’s Homeland Security & Public Safety Agencies…………………………………………………. 306
14.1.8 Sweden’s Police Forces……………………………… 306
14.1.9 Sweden’s Defense Forces…………………………… 307
14.1.10 Sweden’s Intelligence Services…………………….. 307
14.1.11 Sweden: Safe City Projects…………………………. 307
14.1.12 Sweden: Airport Security Statistics………………… 308
15 Denmark Homeland Security & Public Safety Market… 309
15.1 Denmark Homeland Security & Public Safety Market Background…………………………………………………… 309
15.1.1 Facts & Figures 2020…………………………………. 309
15.1.2 Denmark Geopolitical Overview……………………. 309
15.1.3 Denmark Homeland Security & Public Safety Industry…………………………………………………… 309
15.1.4 Crime in Denmark……………………………………… 310
15.1.5 Terror in Denmark…………………………………….. 311
15.1.6 Denmark’s Counter Terror Legislation & Law Enforcement…………………………………………….. 311
15.1.7 Denmark’s Police Forces……………………………. 312
15.1.8 Denmark’s Intelligence Services…………………… 313
15.1.9 Denmark’s Defense Forces…………………………. 313
15.1.10 Denmark: Airport Security Statistics………………. 314
16 Netherlands Homeland Security & Public Safety Market 315
16.1 Netherlands Homeland Security & Public Safety Market Background…………………………………………………… 315
16.1.1 Facts & Figures 2020…………………………………. 315
16.1.2 Netherlands Geopolitical Overview……………….. 315
16.1.3 Netherlands Homeland Security & Public Safety Industry…………………………………………………… 315
16.1.4 Crime in the Netherlands…………………………….. 316
16.1.5 Terror in the Netherlands……………………………. 316
16.1.6 Netherlands’ Counter Terror Legislation & Law Enforcement…………………………………………….. 317
16.1.7 Netherlands’ Homeland Security & Public Safety Agencies…………………………………………………. 318
16.1.8 Netherlands’ Police Forces………………………….. 319
16.1.9 Netherlands’ Intelligence Services………………… 319
16.1.10 Netherlands’ Defense Forces………………………. 319
16.1.11 Netherlands: Safe City Projects……………………. 319
16.1.12 Netherlands: Airport Security Statistics…………… 320
16.1.13 Netherlands’ Border Security……………………….. 320
17 Belgium Homeland Security & Public Safety Market…. 321
17.1 Belgium Homeland Security & Public Safety Market Background…………………………………………………… 321
17.1.1 Facts & Figures 2020…………………………………. 321
17.1.2 Belgium Geopolitical Overview…………………….. 321
17.1.3 Belgium Homeland Security & Public Safety Industry……………………………………………………………… 322
17.1.4 Crime in Belgium………………………………………. 323
17.1.5 Terror in Belgium………………………………………. 323
17.1.6 Belgium’s Counter Terror Legislation & Law Enforcement…………………………………………….. 335
17.1.7 Belgium’s Homeland Security & Public Safety Agencies…………………………………………………. 339
17.1.8 Belgium’s Police Forces……………………………… 339
17.1.9 Belgium’s Intelligence Services…………………….. 341
17.1.10 Belgium’s Defense Forces…………………………… 342
17.1.11 Belgium: Safe City Projects…………………………. 342
17.1.12 Belgium: Airport Security Statistics………………… 345
17.1.13 Belgium Border Security……………………………… 345
18 Austria Homeland Security & Public Safety Market….. 353
18.1 Austria Homeland Security & Public Safety Market Background…………………………………………………… 353
18.1.1 Facts & Figures 2020…………………………………. 353
18.1.2 Austria Homeland Security & Public Safety Industry……………………………………………………………… 353
18.1.3 Crime in Austria………………………………………… 353
18.1.4 Terror in Austria………………………………………… 354
18.1.5 Austria Counter Terror Legislation & Law Enforcement…………………………………………….. 354
18.1.6 Austria’s Homeland Security & Public Safety Agencies…………………………………………………. 355
18.1.7 Austria’s Police Forces……………………………….. 355
18.1.8 Austria’s Intelligence Services……………………… 355
18.1.9 Austria’s Defense Forces……………………………. 355
18.1.10 Austria: Airport Security Statistics…………………. 356
19 Czech Republic Homeland Security & Public Safety Market……………………………………………………………….. 357
19.1 Czech Republic Homeland Security & Public Safety Market Background…………………………………………. 357
19.1.1 Facts & Figures 2020…………………………………. 357
19.1.2 Czech Republic Geopolitical Overview…………… 357
19.1.3 Czech Republic Homeland Security & Public Safety Industry…………………………………………………… 357
19.1.4 Crime in the Czech Republic……………………….. 358
19.1.5 Terror in the Czech Republic……………………….. 358
19.1.6 Czech Republic’s Counter Terror Legislation & Law Enforcement…………………………………………….. 358
19.1.7 Czech Republic’s Police Forces……………………. 358
19.1.8 Czech Republic’s Intelligence Services………….. 359
19.1.9 Czech Republic’s Defense Forces………………… 359
19.1.10 Czech Republic: Airport Security Statistics……… 359
[Back to top]
Global Homeland Security & Public Safety (with COVID-19 & Vaccines Impact) Market – 2022-2026: Volume 7
Download the PDF
APPENDIX A (Continued)………………………………………………. 15
Middle East & Africa…………………………………………………….. 15
1 Turkey Public Safety & Homeland Security Market…….. 15
1.1 Turkey Public Safety & Homeland Security Market Background…………………………………………………….. 15
1.1.1 Facts & Figures 2020…………………………………… 15
1.1.2 Turkey Homeland Security & Public Safety Market 15
1.1.3 Turkey COVID-19 Pandemic…………………………. 17
1.1.4 Crime in Turkey………………………………………….. 18
1.1.5 Terror in Turkey………………………………………….. 18
1.1.6 Turkey’s Counter Terror Legislation & Law Enforcement……………………………………………… 19
1.1.7 Turkey’s Homeland Security & Public Safety Agencies…………………………………………………… 19
1.1.8 Turkey’s Police Forces…………………………………. 20
1.1.9 Turkey’s Intelligence Services……………………….. 22
1.1.10 Turkey’s Defense Forces……………………………… 24
1.1.11 Turkey: Airport Security Statistics…………………… 24
1.1.12 Turkey Border Security………………………………… 26
2 Israel Public Safety & Homeland Security Market………. 27
2.1 Israel Public Safety & Homeland Security Market…….. 27
2.1.1 Facts & Figures 2020…………………………………… 27
2.1.2 Israel Geopolitical Overview………………………….. 27
2.1.3 Israel COVID-19 Pandemic…………………………… 28
2.1.4 Israel Homeland Security & Public Safety Market. 29
2.1.5 Crime in Israel……………………………………………. 32
2.1.6 Terror in Israel……………………………………………. 32
2.1.7 Israel’s Homeland Security & Public Safety Agencies………………………………………………………………. 33
2.1.8 Israel’s Police Forces…………………………………… 34
2.1.9 Israel’s Intelligence Services…………………………. 35
2.1.10 Israel’s Defense Forces……………………………….. 36
2.1.11 Israel’s Safe City Projects…………………………….. 37
2.1.12 Israel: Airport Security Statistics…………………….. 43
2.1.13 Israel Border Security………………………………….. 43
3 Saudi Arabia Public Safety & Homeland Security Market 44
3.1 Saudi Arabia Public Safety & Homeland Security Market Background…………………………………………………….. 44
3.1.1 Facts & Figures 2020…………………………………… 44
3.1.2 Saudi Arabia Homeland Security & Public Safety Market……………………………………………………… 44
3.1.3 Saudi Arabia COVID-19 Pandemic…………………. 44
3.1.4 Crime in Saudi Arabia………………………………….. 45
3.1.5 Saudi Arabia’s Counter Terror Legislation & Law Enforcement……………………………………………… 45
3.1.6 Saudi Arabia’s Homeland Security & Public Safety Agencies…………………………………………………… 46
3.1.7 Saudi Arabia’s Police Forces…………………………. 51
3.1.8 Saudi Arabia’s Intelligence Services……………….. 52
3.1.9 Saudi Arabia’s Defense Forces……………………… 53
3.1.10 Saudi Arabia’s Safe City Projects…………………… 54
3.1.11 Saudi Arabia: Airport Security Statistics…………… 59
3.1.12 Saudi Arabia Border Security………………………… 59
3.2 Iraq Public Safety & Homeland Security Market Background…………………………………………………….. 60
3.2.1 Facts & Figures 2020…………………………………… 60
3.2.2 Iraq Economy…………………………………………….. 60
3.2.3 COVID-19 in Iraq………………………………………… 61
3.2.4 Crime in Iraq……………………………………………… 62
3.2.5 Terror in Iraq……………………………………………… 62
3.2.6 Iraq’s Counter Terror Legislation & Law Enforcement………………………………………………………………. 63
3.2.7 Iraq’s Homeland Security & Public Safety Agencies………………………………………………………………. 63
3.2.8 Iraq’s Police Forces…………………………………….. 64
3.2.9 Iraq’s Intelligence Services……………………………. 65
3.2.10 Iraq’s Defense Forces………………………………….. 66
3.2.11 Iraq: Airport Security Statistics……………………….. 70
3.2.12 Iraq Border Security…………………………………….. 72
4 UAE Public Safety & Homeland Security Market………… 73
4.1 UAE Public Safety & Homeland Security Market Background…………………………………………………….. 73
4.1.1 Facts & Figures 2020…………………………………… 73
4.1.2 UAE Homeland Security & Public Safety Market… 73
4.1.3 UAE COVID-19 Pandemic……………………………. 78
4.1.4 Crime in the UAE………………………………………… 78
4.1.5 Terror in the UAE……………………………………….. 79
4.1.6 UAE’s Counter Terror Legislation & Law Enforcement……………………………………………… 79
4.1.7 UAE’s Homeland Security & Public Safety Agencies………………………………………………………………. 81
4.1.8 UAE’s Police Forces……………………………………. 82
4.1.9 UAE’s Intelligence Services…………………………… 84
4.1.10 UAE’s Defense Forces…………………………………. 84
4.1.11 UAE’s Safe City Projects………………………………. 85
4.1.12 UAE: Airport Security Statistics………………………. 87
4.1.13 UAE Border Security……………………………………. 87
5 Qatar Public Safety & Homeland Security Market………. 89
5.1 Qatar Public Safety & Homeland Security Market Background…………………………………………………….. 89
5.1.1 Facts & Figures 2020…………………………………… 89
5.1.2 Qatar Homeland Security & Public Safety Market. 89
5.1.3 Qatar COVID-19 Pandemic…………………………… 91
5.1.4 Crime in Qatar……………………………………………. 91
5.1.5 Terror in Qatar…………………………………………… 93
5.1.6 Qatar’s Counter Terror Legislation & Law Enforcement……………………………………………… 94
5.1.7 Qatar’s Police Forces………………………………….. 96
5.1.8 Qatar’s Intelligence Services…………………………. 97
5.1.9 Qatar’s Defense Forces……………………………….. 97
5.1.10 Qatar’s Safe City Projects…………………………….. 98
5.1.11 Qatar: Airport Security Statistics…………………….. 98
5.1.12 Qatar Border Security………………………………… 100
6 Kuwait Public Safety & Homeland Security Market…… 101
6.1 Kuwait Public Safety & Homeland Security Market Background…………………………………………………… 101
6.1.1 Facts & Figures 2020…………………………………. 101
6.1.2 Kuwait Homeland Security & Public Safety Market……………………………………………………………… 101
6.1.3 COVID-19 pandemic in Kuwait…………………….. 102
6.1.4 Crime in Kuwait………………………………………… 102
6.1.5 Kuwait’s Counter Terror Legislation & Law Enforcement…………………………………………….. 104
6.1.6 Kuwait’s Homeland Security & Public Safety Agencies…………………………………………………. 104
6.1.7 Kuwait’s Police Forces……………………………….. 105
6.1.8 Kuwait’s Intelligence Services………………………. 105
6.1.9 Kuwait’s Defense Forces…………………………….. 106
6.1.10 Kuwait’s Safe City Projects………………………….. 107
6.1.11 Kuwait: Airport Security Statistics………………….. 108
6.1.12 Kuwait Border Security……………………………….. 109
7 Nigeria Public Safety & Homeland Security Market…… 110
7.1 Nigeria Public Safety & Homeland Security Market Background…………………………………………………… 110
7.1.1 Facts & Figures 2020…………………………………. 110
7.1.2 Nigeria Homeland Security & Public Safety Market……………………………………………………………… 110
7.1.3 COVID-19 pandemic in Nigeria…………………….. 111
7.1.4 Crime……………………………………………………… 112
7.1.5 Terror in Nigeria……………………………………….. 113
7.1.6 Nigeria’s Counter Terror Legislation & Law Enforcement…………………………………………….. 113
7.1.7 Nigeria’s Homeland Security & Public Safety Agencies…………………………………………………. 115
7.1.8 Nigeria’s Police Forces………………………………. 115
7.1.9 Nigeria’s Defense Forces……………………………. 119
7.1.10 Nigeria: Airport Security Statistics…………………. 119
7.1.11 Nigeria Border Security………………………………. 120
8 South Africa Public Safety & Homeland Security Market 122
8.1 South Africa Public Safety & Homeland Security Market Background…………………………………………………… 122
8.1.1 Facts & Figures 2020…………………………………. 122
8.1.2 COVID-19 pandemic in South Africa……………… 122
8.1.3 Crime in South Africa…………………………………. 123
8.1.4 Terror in South Africa…………………………………. 124
8.1.5 South Africa’s Counter Terror Legislation & Law Enforcement…………………………………………….. 124
8.1.6 South Africa’s Homeland Security & Public Safety Agencies…………………………………………………. 126
8.1.7 South Africa’s Police Forces………………………… 126
8.1.8 South Africa’s Intelligence Services………………. 127
8.1.9 South Africa’s Defense Forces…………………….. 128
8.1.10 South Africa: Airport Security Statistics………….. 129
8.1.11 South Africa Border Security……………………….. 129
Asia Pacific……………………………………………………………….. 130
9 India Public Safety & Homeland Security Market……… 130
9.1 India Public Safety & Homeland Security Market Background…………………………………………………… 130
9.1.1 Facts & Figures 2020…………………………………. 130
9.1.2 India Homeland Security & Public Safety Market 130
9.1.3 COVID-19 pandemic in India……………………….. 132
9.1.4 Crime in India…………………………………………… 133
9.1.5 Terror in India…………………………………………… 136
9.1.6 India’s Counter Terror Legislation & Law Enforcement…………………………………………….. 136
9.1.7 India’s Homeland Security & Public Safety Agencies……………………………………………………………… 137
9.1.8 India’s Police Forces………………………………….. 138
9.1.9 India’s Defense Market………………………………. 139
9.1.10 India’s Intelligence Services………………………… 142
9.1.11 India’s Defense Forces………………………………. 143
9.1.12 India’s Safe City Projects……………………………. 144
9.1.13 India: Airport Security Statistics……………………. 146
9.1.14 India Border Security…………………………………. 147
10 China Public Safety & Homeland Security Market…….. 150
10.1 China Public Safety & Homeland Security Market Background…………………………………………………… 150
10.1.1 Facts & Figures 2020…………………………………. 150
10.1.2 China Geopolitical Overview………………………… 151
10.1.3 China Economy………………………………………… 152
10.1.4 China: Security Threat Assessment………………. 155
10.1.5 China’s Security Industry…………………………….. 156
10.1.6 China Homeland Security & Public Safety Market……………………………………………………………… 159
10.1.7 Crime in China………………………………………….. 160
10.1.8 Terror in China…………………………………………. 162
10.1.9 China’s Counter Terror Legislation & Law Enforcement…………………………………………….. 162
10.1.10 China’s Homeland Security & Public Safety Agencies…………………………………………………. 164
10.2 National Security Commission of the Communist Party of China (CNSC)…………………………………………….. 165
10.3 The 610 Office……………………………………………….. 165
10.3.1 China’s Police Forces………………………………… 168
10.3.2 China’s Intelligence Services……………………….. 168
10.3.3 China’s Ministry of Public Security………………… 169
10.3.4 China’s Public Security Bureau…………………….. 170
10.3.5 China’s Ministry of State Security………………….. 170
10.3.6 China’s Defense Forces……………………………… 171
10.3.7 Natural Disasters in China…………………………… 176
10.3.8 China’s Safe City Projects…………………………… 176
10.3.9 China: Airport Security Statistics…………………… 180
10.3.10 China Border Security………………………………… 187
11 South Korea Public Safety & Homeland Security Market 188
11.1 South Korea Public Safety & Homeland Security Market Background…………………………………………………… 188
11.1.1 Facts & Figures 2020…………………………………. 188
11.1.2 South Korea Homeland Security & Public Safety Market……………………………………………………. 188
11.1.3 Crime in South Korea…………………………………. 189
11.1.4 Terror in South Korea………………………………… 190
11.1.5 South Korea’s Homeland Security & Public Safety Agencies…………………………………………………. 191
11.1.6 South Korea’s Police Forces……………………….. 192
11.1.7 South Korea’s Intelligence Services………………. 192
11.1.8 South Korea’s Defense Forces…………………….. 193
11.1.9 South Korea’s Safe City Projects………………….. 193
11.1.10 South Korea: Airport Security Statistics………….. 195
11.1.11 South Korea Border Security……………………….. 195
12 Japan Public Safety & Homeland Security Market……. 197
12.1 Japan Public Safety & Homeland Security Market Background…………………………………………………… 197
12.1.1 Facts & Figures 2020…………………………………. 197
12.1.2 Japan Homeland Security & Public Safety Market……………………………………………………………… 197
12.1.3 Crime in Japan…………………………………………. 198
12.1.4 Terror in Japan…………………………………………. 198
12.1.5 Japan’s Homeland Security & Public Safety Agencies…………………………………………………. 199
12.1.6 Japan’s Police Forces………………………………… 200
12.1.7 Japan’s Intelligence Services……………………….. 200
12.1.8 Japan’s Defense Forces……………………………… 201
12.1.9 Japan’s Safe City Projects…………………………… 202
12.1.10 Natural Disasters in Japan………………………….. 202
12.1.11 Japan: Airport Security Statistics…………………… 205
12.1.12 Japan Border Security………………………………… 206
13 Australia Public Safety & Homeland Security Market… 208
13.1 Australia Public Safety & Homeland Security Market Background…………………………………………………… 208
13.1.1 Facts & Figures 2020…………………………………. 208
13.1.2 Crime in Australia……………………………………… 208
13.1.3 Terror in Australia……………………………………… 209
13.1.4 Australia’s Counter Terror Legislation & Law Enforcement…………………………………………….. 210
13.1.5 Australia’s Homeland Security & Public Safety Agencies…………………………………………………. 211
13.1.6 Australia’s Police Forces…………………………….. 213
13.1.7 Australia’s Intelligence Services……………………. 213
13.1.8 Australia’s Defense Forces………………………….. 215
13.1.9 Australia’s Safe City Projects……………………….. 216
13.1.10 Natural Disasters………………………………………. 218
13.2 Airports in Australia…………………………………………. 219
13.2.1 Australia Border Security…………………………….. 219
14 Azerbaijan Public Safety & Homeland Security Market 221
14.1 Azerbaijan Public Safety & Homeland Security Market Background…………………………………………………… 221
14.1.1 Facts & Figures 2020…………………………………. 221
14.1.2 Azerbaijan Homeland Security & Public Safety Market……………………………………………………. 221
14.1.3 Crime in Azerbaijan…………………………………… 222
14.1.4 Terror in Azerbaijan…………………………………… 223
14.1.5 Azerbaijan’s Counter Terror Legislation & Law Enforcement…………………………………………….. 223
14.1.6 Azerbaijan’s Homeland Security & Public Safety Agencies…………………………………………………. 223
14.1.7 Azerbaijan’s Police Forces………………………….. 224
14.1.8 Azerbaijan’s Intelligence Services…………………. 225
14.1.9 Azerbaijan’s Defense Forces……………………….. 225
14.1.10 Azerbaijan: Airport Security Statistics…………….. 226
14.1.11 Azerbaijan Border Security………………………….. 227
15 Kazakhstan Public Safety & Homeland Security Market 228
15.1 Kazakhstan Public Safety & Homeland Security Market Background…………………………………………………… 228
15.1.1 Facts & Figures 2020…………………………………. 228
15.1.2 Crime in Kazakhstan………………………………….. 228
15.1.3 Terror in Kazakhstan………………………………….. 229
15.1.4 Kazakhstan’s Counter Terror Legislation & Law Enforcement…………………………………………….. 230
15.1.5 Kazakhstan’s Police Forces…………………………. 230
15.1.6 Kazakhstan’s Intelligence Services……………….. 231
15.1.7 Kazakhstan’s Defense Forces……………………… 231
15.1.8 Kazakhstan: Airport Security Statistics…………… 232
15.1.9 Kazakhstan Border Security………………………… 232
16 Pakistan Public Safety & Homeland Security Market… 233
16.1 Pakistan Public Safety & Homeland Security Market Background…………………………………………………… 233
16.1.1 Facts & Figures 2020…………………………………. 233
16.1.2 Crime in Pakistan……………………………………… 233
16.1.3 Terror in Pakistan……………………………………… 233
16.1.4 Pakistan’s Counter Terror Legislation & Law Enforcement…………………………………………….. 234
16.1.5 Pakistan’s Homeland Security & Public Safety Agencies…………………………………………………. 236
16.1.6 Pakistan’s Police Forces…………………………….. 236
16.1.7 Pakistan’s Intelligence Services……………………. 239
16.1.8 Pakistan’s Defense Forces………………………….. 240
16.1.9 Natural Disasters in Pakistan……………………….. 241
16.1.10 Pakistan: Airport Security Statistics……………….. 241
16.1.11 Pakistan Border Security…………………………….. 241
17 Taiwan Public Safety & Homeland Security Market…… 243
17.1 Taiwan Public Safety & Homeland Security Market Background…………………………………………………… 243
17.1.1 Facts & Figures 2020…………………………………. 243
17.1.2 Taiwan Homeland Security & Public Safety Market……………………………………………………………… 243
17.1.3 Crime and Terror in Taiwan…………………………. 243
17.1.4 Taiwan’s Homeland Security & Public Safety Agencies…………………………………………………. 244
17.1.5 Taiwan’s Police Forces………………………………. 245
17.1.6 Taiwan’s Intelligence Services……………………… 245
17.1.7 Taiwan’s Defense Forces……………………………. 246
17.1.8 Taiwan: Airport Security Statistics…………………. 246
17.1.9 Taiwan Border Security………………………………. 247
18 Singapore Public Safety & Homeland Security Market. 249
18.1 Singapore Public Safety & Homeland Security Market Background…………………………………………………… 249
18.1.1 Facts & Figures 2020…………………………………. 249
18.1.2 Singapore Homeland Security & Public Safety Market……………………………………………………. 249
18.1.3 Crime in Singapore……………………………………. 250
18.1.4 Terror in Singapore……………………………………. 250
18.1.5 Singapore’s Homeland Security & Public Safety Agencies…………………………………………………. 251
18.1.6 Singapore’s Police Forces…………………………… 253
18.1.7 Singapore’s Intelligence Services…………………. 253
18.1.8 Singapore’s Defense Forces……………………….. 254
18.1.9 Singapore: Airport Security Statistics…………….. 255
18.1.10 Singapore Border Security………………………….. 255
19 Malaysia Public Safety & Homeland Security Market… 257
19.1 Malaysia Public Safety & Homeland Security Market Background…………………………………………………… 257
19.1.1 Facts & Figures 2020…………………………………. 257
19.1.2 Malaysia Homeland Security & Public Safety Market……………………………………………………………… 257
19.1.3 Crime in Malaysia……………………………………… 257
19.1.4 Terror in Malaysia……………………………………… 259
19.1.5 Malaysia’s Counter Terror Legislation & Law Enforcement…………………………………………….. 259
19.1.6 Malaysia’s Homeland Security & Public Safety Agencies…………………………………………………. 260
19.1.7 Malaysia’s Police Forces…………………………….. 261
19.1.8 Malaysia’s Intelligence Services…………………… 261
19.1.9 Malaysia’s Defense Forces…………………………. 262
19.1.10 Malaysia: Airport Security Statistics………………. 265
19.1.11 Malaysia Border Security……………………………. 265
20 Indonesia Public Safety & Homeland Security Market. 267
20.1 Indonesia Public Safety & Homeland Security Market Background…………………………………………………… 267
20.1.1 Facts & Figures 2020…………………………………. 267
20.1.2 Indonesia Geopolitical Overview…………………… 267
20.1.3 Indonesia Homeland Security & Public Safety Market……………………………………………………. 268
20.1.4 Crime in Indonesia…………………………………….. 269
20.1.5 Terror & Civil Unrest in Indonesia…………………. 270
20.1.6 Indonesia’s Counter Terror Legislation & Law Enforcement…………………………………………….. 270
20.1.7 Indonesia’s Homeland Security & Public Safety Agencies…………………………………………………. 273
20.1.8 Indonesia’s Police Forces……………………………. 274
20.1.9 Indonesia’s Intelligence Services………………….. 274
20.1.10 Indonesia’s Defense Forces………………………… 275
20.1.11 Indonesia’s Safe City Projects……………………… 276
20.1.12 Natural Disasters in Indonesia……………………… 277
20.1.13 Indonesia: Airport Security Statistics……………… 278
20.1.14 Indonesia Border Security…………………………… 279
21 Appendix B: Homeland Security & Public Safety Industry 281
21.1 Mergers & Acquisitions (M&A)…………………………… 281
21.2 Business Models & Strategies…………………………… 281
21.2.1 Variable Economic Conditions……………………… 281
21.2.2 Market Tiers…………………………………………….. 282
21.2.3 Defense Primes & Mega Corporations’ Inroads into the Market……………………………………………….. 282
21.2.4 Market Entry Strategies………………………………. 282
21.2.5 Market Entry Challenges…………………………….. 283
21.2.6 The Industry: Supply-Side & Demand-Side Analysis……………………………………………………………… 284
21.2.7 Price Elasticity………………………………………….. 288
21.2.8 Vendor – Government Relationship………………. 290
22 Appendix C: Developments to Observe in 2021……….. 295
23 Appendix D: Homeland Security & Public Safety Related Product Standards………………………………………………. 297
24 Appendix E: Abbreviations…………………………………… 319
25 Research Methodology………………………………………… 331
25.1 Report Structure…………………………………………….. 331
25.2 Research Methodology……………………………………. 331
25.3 For Whom is this Report?…………………………………. 332
26 Disclaimer and Copyright……………………………………… 333
[Back to top]


![Global Homeland Security & Public Safety Market [$B] – 2020 & 2026](https://hsrc.biz/wp-content/uploads/2020/06/Global-Homeland-Security-Public-Safety-Market-B-–-2020-2026.jpg)
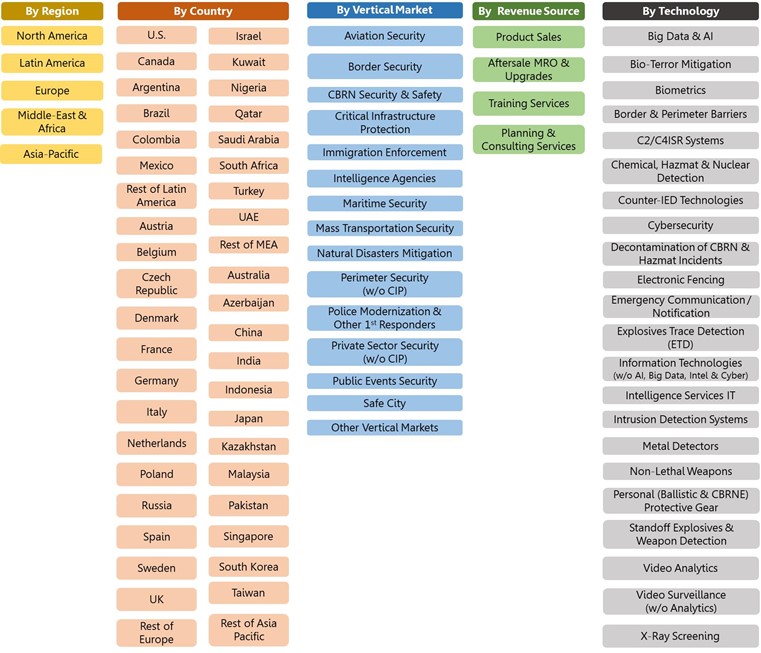
![Global Homeland Security & Public Safety Regional Market Shares [%] – 2019-2026](https://hsrc.biz/wp-content/uploads/2020/06/Global-Homeland-Security-Public-Safety-Regional-Market-Shares-–-2019-2026.jpg)