| 1 |
Executive Summary |
| 1.1. |
Main Findings |
| 1.2. |
Main Conclusions |
| 1.3. |
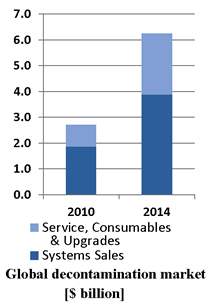
Global Market: 2011-2016 |
| 1.4. |
Technological Challenges |
| 2 |
Introduction |
| 2.1. |
Definition of Decontamination |
| 2.2. |
Who is This Report For? |
| 2.3. |
Report Scope |
| 2.4. |
Report Structure |
| 2.5. |
Methodology |
| 2.5.1. |
Research Methods |
| 2.5.2. |
Basic Assumptions |
| 2.6. |
CBRN Terror |
| 2.7. |
Decontamination Strategy |
| 2.8. |
The Decontamination Industry |
| 3 |
Global Decontamination Market Inhibitors |
| 4 |
Decontamination Industry Competitive Analysis |
| 5 |
Decontamination Industry SWOT Analysis |
| 5.1. |
Scope |
| 5.2. |
Decontamination Industry SWOT Analysis |
| 6 |
Present and Pipeline Decontamination Technologies |
| 6.1. |
Overview |
| 6.2. |
The Decontamination Process |
| 6.3. |
Contaminant Detection and Identification |
| 6.3.1. |
Sample Characterization |
| 6.3.2. |
Isolating the Contaminated Area |
| 6.3.3. |
Designing the Decontamination Strategy |
| 6.3.4. |
Clearance Sampling |
| 6.4. |
Building & People Decontamination |
| 6.4.1. |
People Decontamination |
| 6.4.2. |
Building Decontamination |
| 6.5. |
Decontamination Technologies |
| 6.5.1. |
Core Technologies Overview |
| 6.6. |
Physics Based Decontamination Technologies |
| 6.6.1. |
Sorbents |
| 6.6.2. |
Solvent-Wash |
| 6.6.3. |
High-Pressure Methods |
| 6.6.4. |
Thermal Methods |
| 6.7. |
Chemistry Based Decontamination Technologies |
| 6.7.1. |
Oxidizing Agents |
| 6.7.2. |
Strong Bases |
| 6.7.3. |
Surfactants |
| 6.7.4. |
Micro-emulsions |
| 6.8. |
Biology – Based Technologies |
| 6.8.1. |
Bacterial Decontamination Agents |
| 6.9. |
Decontamination Systems Configurations |
| 6.9.1. |
Scope |
| 6.9.2. |
People Decontamination Systems |
| 6.9.3. |
Equipment Decontamination Systems |
| 6.10. |
Indoor Heavy Equipment Decontamination |
| 6.10.1. |
Building and Infrastructure Decontamination Systems |
| 6.10.2. |
Fumigation Decontamination Systems |
| 6.10.3. |
External Foam / Gel Sprayers |
| 6.11. |
New Technologies – Drivers |
| 6.12. |
New Technologies – Inhibitors |
| 7 |
Stockpiling Decontamination Agents & Equipment |
| 8 |
Global CBRN Terror & Hazmat Incidents Decontamination Market: 2011-2016 |
| 8.1. |
Market Overview |
| 8.2. |
Market Forecast |
| 8.3. |
Global Decontamination Equipment Market: 2011-2016 |
| 8.3.1. |
Overview |
| 8.3.2. |
CBRN Contamination Detection Systems Market Forecast |
| 8.3.3. |
Equipment & Buildings Decontamination Systems Market Forecast |
| 8.3.4. |
Global People Decontamination Systems Market Forecast |
| 9 |
The US Market: 2011-2016 |
| 9.1. |
The Obama Administration Strategy |
| 9.2. |
Drivers |
| 9.3. |
Inhibitors |
| 9.4. |
Market Forecast |
| 10 |
Germany, the UK, France and Italy Markets: 2011-2016 |
| 10.1. |
Market Drivers |
| 10.2. |
Market Inhibitors |
| 10.3. |
Market Forecast |
| 11 |
China, India, Taiwan, Middle East and Japan Market: 2011-2016 |
| 11.1. |
Market Drivers |
| 11.2. |
Market Inhibitors |
| 11.3. |
Market Forecast |
| 12 |
Latin American Market: 2011-2016 |
| 12.1. |
Market Drivers |
| 12.2. |
Market Inhibitors |
| 12.3. |
Market Forecast |
| 13 |
Rest of the World Market: 2011-2016 |
| 13.1. |
Market Drivers |
| 13.2. |
Market Inhibitors |
| 13.3. |
Market Forecast |
| 14 |
Global Decontamination Equipment Service & Upgrade Market: 2011-2016 |
| 14.1. |
The Global Market |
| 14.1.1. |
Market by Modality |
| 14.1.2. |
Market by Country |
| 14.2. |
U.S. Service & Upgrade Market: 2011-2016 |
| 14.3. |
Germany, UK, France and Italy Service & Upgrade Market: 2011-2016 |
| 14.4. |
China, India, Taiwan, Japan and the Middle East Service & Upgrade Market -2011-2016 |
| 14.5. |
Latin American Service & Upgrade Market: 2011-2016 |
| 14.6. |
ROW Service & Upgrade Market: 2011-2016 |
| 15 |
Business Opportunities and Challenges: 2011-2016 |
| 15.1. |
A Market Waiting for Transition |
| 15.1.1. |
HLS Decontamination Strategy Outlook |
| 15.1.2. |
Factors Affecting Decontamination Systems Business Opportunities |
| 15.2. |
Technology Performance Challenges |
| 15.2.1. |
Challenge One: Time |
| 15.2.2. |
Challenge Two: Decontamination Level |
| 15.2.3. |
Challenge Three: Accurate Contamination Simulations |
| 15.2.4. |
Challenge Four: Cost of Decontamination |
| 15.2.5. |
Challenge Five: Environmentally Unfriendly Materials |
| 15.2.6. |
Challenge Six: Transport and Storage |
| 15.2.7. |
Challenge Seven: Radioactive Decontamination |
| 15.3. |
Business Opportunities for Decontamination Systems |
| 15.3.1. |
Business Opportunity One |
| 15.3.2. |
Business Opportunity Two |
| 15.3.3. |
Business Opportunity Three |
| 15.3.4. |
Business Opportunity Four |
| 15.3.5. |
Business Opportunity Five |
| 15.3.6. |
Business Opportunity Six |
| 15.3.7. |
Business Opportunity Seven |
| 15.4. |
Radiological Decontamination Technologies |
| 15.4.1. |
Business Opportunity Eight |
| 15.4.2. |
Business Opportunity Nine |
| 15.4.3. |
Business Opportunity Ten |
| 15.4.4. |
Business Opportunity Eleven |
| 15.4.5. |
Business Opportunity Twelve |
| 15.5. |
Chemical-Biological Decontamination Technologies and Business Opportunities |
| 15.5.1. |
Business Opportunity Thirteen |
| 15.5.2. |
Business Opportunity Fourteen |
| 15.5.3. |
Business Opportunity Fifteen |
| 15.5.4. |
Business Opportunity Sixteen |
| 15.5.5. |
Business Opportunity Seventeen |
| 15.5.6. |
Business Opportunity Eighteen |
| 15.5.7. |
Business Opportunity Nineteen |
| 15.5.8. |
Business Opportunity Twenty |
| 15.5.9. |
Business Opportunity Twenty-one |
| 15.6. |
Contamination Simulation Algorithms |
| 15.6.1. |
Business Opportunity Twenty-two |
| 16 |
Decontamination Vendors and Products |
| 16.1. |
Decontamination Systems |
| 16.1.1. |
Allen-Vanguard Corporation |
| 16.1.2. |
Andax |
| 16.1.3. |
Base-X Inc. |
| 16.1.4. |
Bio Defense Corporation |
| 16.1.5. |
BIOQUELL, Inc. |
| 16.1.6. |
ClorDi Sys Solutions, Inc |
| 16.1.7. |
Container Products Corp. |
| 16.1.8. |
CRDS TVI Corporation |
| 16.1.9. |
Crest Ultrasonics Corp. |
| 16.1.10. |
Cryogenesis |
| 16.1.11. |
DQE, Inc. |
| 16.1.12. |
DuPont Personal Protection |
| 16.1.13. |
Environmental Fire Solutions, Inc. |
| 16.1.14. |
Equipment Management Company |
| 16.1.15. |
Fend- All |
| 16.1.16. |
First Line Technology, LLC |
| 16.1.17. |
Flangler Emergency Services, LLC |
| 16.1.18. |
Foster-Miller, Inc. |
| 16.1.19. |
FSI North America |
| 16.1.20. |
GenV- Clean Earth Technologies, LLC |
| 16.1.21. |
Global Ground Support |
| 16.1.22. |
Hughes Safety Showers Ltd. |
| 16.1.23. |
Intelgard, Inc. |
| 16.1.24. |
Karcher Futuretech GmbH |
| 16.1.25. |
Life Safety Systems, Inc. |
| 16.1.26. |
Matthews Specialty Vehicles, Inc |
| 16.1.27. |
Mobile Air Applied Science, Inc. |
| 16.1.28. |
Modec, Inc |
| 16.1.29. |
Nor E First Response, Inc. |
| 16.1.30. |
OWR AG |
| 16.1.31. |
Precision Lift, Inc. |
| 16.1.32. |
Reeves EMS, LLC |
| 16.1.33. |
RFD Beaufort |
| 16.1.34. |
RMC Medical |
| 16.1.35. |
Survival, Inc. |
| 16.1.36. |
SWEDE |
| 16.1.37. |
TSGI USA |
| 16.1.38. |
TVI Corporation |
| 16.1.39. |
Ultimate Survival Technologies |
| 16.1.40. |
US Foam Technologies, Inc |
| 16.1.41. |
Wel-Fab Inc. |
| 16.1.42. |
Western Shelter Systems |
| 16.1.43. |
Zimek Technologies, LLC |
| 16.1.44. |
Zumro, Inc. |
| 16.2. |
Other Decontamination Hardware |
| 16.2.1. |
Aero Tec Laboratories Inc. |
| 16.2.2. |
Air Systems International |
| 16.2.3. |
Akron Brass Co. |
| 16.2.4. |
Allen-Vanguard, Inc |
| 16.2.5. |
Applied Surface Technologies |
| 16.2.6. |
BCDS, Inc. |
| 16.2.7. |
ClorDi Sys Solutions, Inc. |
| 16.2.8. |
Crestline Industries |
| 16.2.9. |
Cryogenesis |
| 16.2.10. |
Cryokinetics |
| 16.2.11. |
DQE, Inc. |
| 16.2.12. |
EFT |
| 16.2.13. |
Equipment Management Company |
| 16.2.14. |
E-Z-EM, Inc. |
| 16.2.15. |
Fend-All |
| 16.2.16. |
First Line Technology, LLC |
| 16.2.17. |
FSI North America |
| 16.2.18. |
Genecor International, Inc. |
| 16.2.19. |
Guild Associates, Inc. |
| 16.2.20. |
Haws Corporation |
| 16.2.21. |
Hydro-Therm |
| 16.2.22. |
IET, Inc. |
| 16.2.23. |
Intelgard |
| 16.2.24. |
Kappler, Inc |
| 16.2.25. |
Karcher Futuretech |
| 16.2.26. |
Minuteman International, Inc. |
| 16.2.27. |
Miti Manufacturing Co. Inc. |
| 16.2.28. |
Mobile Air Applied Science, Inc. |
| 16.2.29. |
Modec Inc. |
| 16.2.30. |
Morgan Inc. |
| 16.2.31. |
Nano Scale |
| 16.2.32. |
Nor E First Response, Inc. |
| 16.2.33. |
NPS Corporation |
| 16.2.34. |
OWR AG |
| 16.2.35. |
Radiation Decontamination Solutions, LLC |
| 16.2.36. |
RAPID Deployment Products Inc. |
| 16.2.37. |
Red Head Brass, LLC |
| 16.2.38. |
Reeves EMS |
| 16.2.39. |
Reliapon |
| 16.2.40. |
RMC Medical |
| 16.2.41. |
Sabre Technical Services |
| 16.2.42. |
Slate Enterprises, Inc. |
| 16.2.43. |
SteriFx, Inc |
| 16.2.44. |
Steris Corporation |
| 16.2.45. |
Swede |
| 16.2.46. |
TECWAR® Tactical Water Purification Systems |
| 16.2.47. |
Tempest Technology, Inc. |
| 16.2.48. |
TVI Corporation |
| 16.3. |
Decontamination Equipment Selection Factors |
| 16.4. |
Commercial Decontaminants Prices & Performance |
| 16.5. |
Liquid Decontamination Delivery Systems: Prices & Performance |
| 16.6. |
Gaseous Decontamination Delivery Systems: Prices & Performance |
| 16.7. |
Decontamination Shower Systems: Prices & Performance |
| 16.8. |
Decontamination Shower Hardware: Prices & Performance |
| 16.9. |
Decontamination Kits: Prices & Performance |
| 16.10. |
Decontamination Containment Hardware: Prices & Performance |
| 16.11. |
Decontamination Support Equipment: Prices & Performance |
| 17 |
Appendix A: CBRN Terror |
| 17.1. |
Biological Terror |
| 17.1.1. |
Bio-Weapons Historical Perspective |
| 17.1.2. |
Biological Terror Bacterial Agents |
| 17.2. |
Nuclear-Radiological Terror |
| 17.2.1. |
How Real is the Nuclear Threat? |
| 17.2.2. |
Nuclear Terror |
| 17.2.3. |
Radiological Dispersal Devices (RDD) |
| 17.3. |
Chemical Terror |
| 17.3.1. |
Nerve Agents |
| 18 |
Appendix B: Decontamination Legal Issues |
| 18.1. |
International Legislation/Agreements |
| 18.1.1. |
The Nuclear Weapons Non-Proliferation Treaty (NPT) 1970 |
| 18.1.2. |
The Biological and Toxin Weapons Convention (BTWC) 1972 |
| 18.1.3. |
Convention for the Physical Protection of Nuclear Material 1987 |
| 18.1.4. |
Chemicals Weapons Convention 1992 |
| 18.2. |
U.S. Legislation |
| 18.2.1. |
U.S. Code Title 50, Chapter 40 Defense against Weapons of Mass Destruction |
| 18.2.2. |
Federal Insecticide, Fungicide, and Rodenticide Act (FIFRA) 1996 |
| 18.2.3. |
Emergency Supplemental Appropriations Act for Recovery from and Response
to Terrorist Attacks on the United States 2001 |
| 18.2.4. |
Public Health Security and Bioterrorism Preparedness and Response Act 2002 |
| 18.2.5. |
Pandemic and All-Hazards Preparedness Act (PAHPA), 2006 |
| 18.2.6. |
Homeland Security Presidential Directive 21 |