Top
HSRCOSINT Market & Technologies – 2020-2026

OSINT Market & Technologies - 2020-2026

The Only Comprehensive OSINT (Open-Source Intelligence) Market Report Ever Published, Granulated into 58 Submarkets

  • May 2021
  • 379
  • 153
    • 4450 $
    • 5450 $
    • 6950 $
    • 10000 $

    Small Businesses, Startups & Academia - Up to 50% Off

Quantity
IBM
Amazon
Sandia National Lab
HITACHI
Thales
Smiths Detection
Nuctech
Korea Internet & Security Agency
L3Harris
Huawei
Leidos
NEC
Toshiba
Deloitte
MAG

Want to customize this report?

If you purchase this report, you are entitled to a 30% discount towards customizing it, to better fit your market research and strategic needs. Our Custom Research and Industry Insights Department will work with you to better understand your information gaps and strategic needs and will provide you with a tailor-made market research report within a short period of time.

Why Choose Us?

30+ Years of Experience
We are a multidisciplinary team of Transformational Technologies industry experts with over 30 years of experience.
Gold Standard
With over 950 private sector clients (73% repeat customers), including major defense and security vendors, and Forbes Global 2000 companies, HSRC earned the reputation as the industry’s Gold Standard for Transformational Technologies Market Reports.
Tailored Research Services
Provide you with clear, actionable recommendations designed to empower decision making and to help you exploit emerging opportunities in the Transformational Technologies industries.
Information Security
Your personal information is safe and secure.

From: $4,450

Description

OSINT is becoming a necessity and the market is growing. OSINT tools, Webint and Social Media Monitoring Automation allows analysts to cope with various sources and provide near real-time analysis.
An increasing amount of personal data, corporate content, and government databases are now open and accessible to intelligence organizations around the world, leading to a rise in OSINT investments and, by extension, OSINT, WEBINT or SOCMINT budgets.

OSINT Market Segmentation 2020-2026


Several types of security organizations are now reportedly investing in Open Source Intelligence Tools to increase their monitoring and research capabilities, in the open web, deep web and Darknet. Social networks such as Facebook, Twitter, Instagram, LinkedIn, and other local services hold detailed personal data on billions of people, and lay the grounds for Social Media Monitoring. Locations, connections, hobbies, and purchasing habits are open for all which have turned these networks into goldmines for intelligence analysts.
An additional source of intelligence is news reports from around the world: information about a riot, a disease outbreak or the moving of troops can reach local and then international media within seconds. Once published, news reaches intelligence organizations around the world instantly. This flow of information and the relevant supportive intelligence systems are a strong tool for every intelligence organization. Organizations related to Military Intelligence, Police Intelligence, and Homeland Security are reportedly investing in the purchase of state-of-the-art OSINT systems.

Global Open-Source Intelligence Market Share [%] by Region in 2026

OSINT Market by region

Global Open-Source Intelligence Market Share [%] by Region in 2026

One of the fastest-growing verticals is Open-Source Intelligence monitoring for cyber intelligence, in the realm of Threat Intelligence. As hackers interact over the dark net and manage operations and assaults in web forums and groups, constant monitoring of these activities can provide valuable information about planned attacks. In most cyber defense organizations, OSINT and WEBINT are becoming one of the building blocks for strong Threat Intelligence process.

The global Open-Source Intelligence Market in Homeland Security and Public Safety is boosted by the following drivers:

  • An increased use of social networks and a rise of user-generated content, including video sharing, groups, and forums, which expand the amount of content available for intelligence organizations to gather and analyze.
  • The growth in fake news and deep fake technology makes disinformation and misinformation campaigns far more dangerous
  • Rapid advances in big data, data analytics, text analytics and artificial intelligence are facilitating the conversion of millions of scattered data into manageable databases for intelligence analysts. By automating the collection and analysis, analysts can now cope with various sources and provide near real-time analyses
  • The growing willingness to release open governmental data to the web, facilitating data access on a personal or country level.
  • Leakage of private and secret data to the open sphere. Initiatives such as Wiki-Leaks or Panama Papers are exposing previously undisclosed information, enabling sophisticated intelligence organizations to make use of this data for the investigation and monitoring of people, companies, and countries through advanced Open Source Intelligence tools.
  • Investment in intelligence gathering on citizens by less liberal countries – China’s social media monitoring activity has been known for years and additional countries such as Russia and Turkey have already built capabilities to monitor citizens based on Open-Source Intelligence systems. This trend is now penetrating the once-perceived privacy stronghold in European countries. The 2015-2017 terror attacks in Europe have brought the civil and privacy rights vs. Homeland Security and Public Safety debate to new highs and should lead western European parliaments to increase OSINT budgets and Social Media Intelligence (SOCMINT)
  • The growth of OSINT training courses around the world, which have boosted the number of potential users of advanced systems. Courses offer publicly available Information collection techniques, top OSINT tools, and even HUMINT over OSINT capabilities.

The “Open-Source Intelligence Global Market 2020-2026” report examines each dollar spent in the market via 5 orthogonal money trails: regional markets, national markets, vertical markets, sub-markets and by solutions market.

Questions answered in this market report include:

  • What will the OSINT market size be in 2020-2026?
  • Which verticals are the fastest-growing?
  • Which countries are expected to invest in OSINT and WEBINT solutions and services?
  • What are the OSINT market drivers and inhibitors?

This report is a valuable resource for executives with interests in the industry. It has been explicitly customized for industry and decision-makers to enable them to identify business opportunities, emerging technologies, market trends and risks, as well as to benchmark business plans.

Why Buy this OSINT Market Report?

A.Open-Source Intelligence Market size data is analyzed via 5 independent key perspectives:

The market data is analyzed through 5 key perspectives: regional markets, national markets, vertical markets, sub-markets, and technological solutions.
Given the highly-fragmented market, the report addresses the Intelligence budget “money trail” each dollar spent according to the following orthogonal market segments:

  • By 9 OSINT Vertical Markets:
    1. Government Intelligence Agencies
    2. Law Enforcement and 1st Responders such as Police Intelligence
    3. OSINT for Defense/Military Intelligence
    4. Financial Services Industry & Fraud Detection
    5. Cyber Security – Threat Intelligence
    6. Border Control & Customs
    7. Mass Transportation (Air, Sea & Land)
    8. Intelligence Fusion Centers
    9. Critical Infrastructure Security
  • By 8 OSINT Sub-Markets:
    1. Riot Forecast & Control
    2. Criminal Activities
    3. Terror Monitoring via OSINT
    4. OSINT for Cyber Security
    5. Smart City Uses
    6. Natural Disasters
    7. Political Monitoring via OSINT
    8. OSINT for Defense Intelligence
  • By 11 Open Source Intelligence Tools and Technological Solutions Markets
    1. Web Scrapers
    2. Databases and Big Data Software
    3. Video Analytics for OSINT
    4. Text Analytics for OSINT (Stand-alone)
    5. Visualization Tools
    6. Cyber – Network Security
    7. Humint over Osint
    8. Osint Outsource Services
    9. Social Media Monitoring and Analysis
    10. News Analysis
    11. Web Analysis
  • By 5 Regional Markets:
    1. North America
    2. Latin America
    3. Europe
    4. Middle East & Africa
    5. Asia Pacific
  • By 23 National & Regional Markets:
  1. USA
  2. Canada
  3. Germany
  4. France
  5. UK
  6. Italy
  7. Spain
  8. Rest of Europe
  9. Australia
  10. India
  11. China 
  12. South Korea
  1. Japan
  2. Rest of Asia Pacific
  3. Brazil
  4. Mexico
  5. Colombia
  6. Rest of Latin America
  7. GCC
  8. South Africa
  9. Kenya
  10. Nigeria
  11. Rest of ME&A

Detailed market analysis frameworks for each of the market sectors, including:

  1. Market Drivers & Inhibitors
  2. Business Opportunities
  3. SWOT Analysis
  4. Competitive Analysis
  5. Business Environment


Table of Contents

Download TOC as PDF

Open Source Intelligence (OSINT) Market 2020-2026

Table of Contents

1             Executive Summary         31

1.1         Key Findings and Conclusions      31

1.1.1      Market Growth  31

1.1.2      Geographies and Market Drivers               31

1.1.3      Market Structure & Perception   32

1.2         Global OSINT Market 2020-2026               35

1.2.1      Market Size – Assessment and Forecast – 2020-2026        35

1.2.2      Market Dynamics 2020-2026       36

1.2.3      Market Breakdown 2020-2026    36

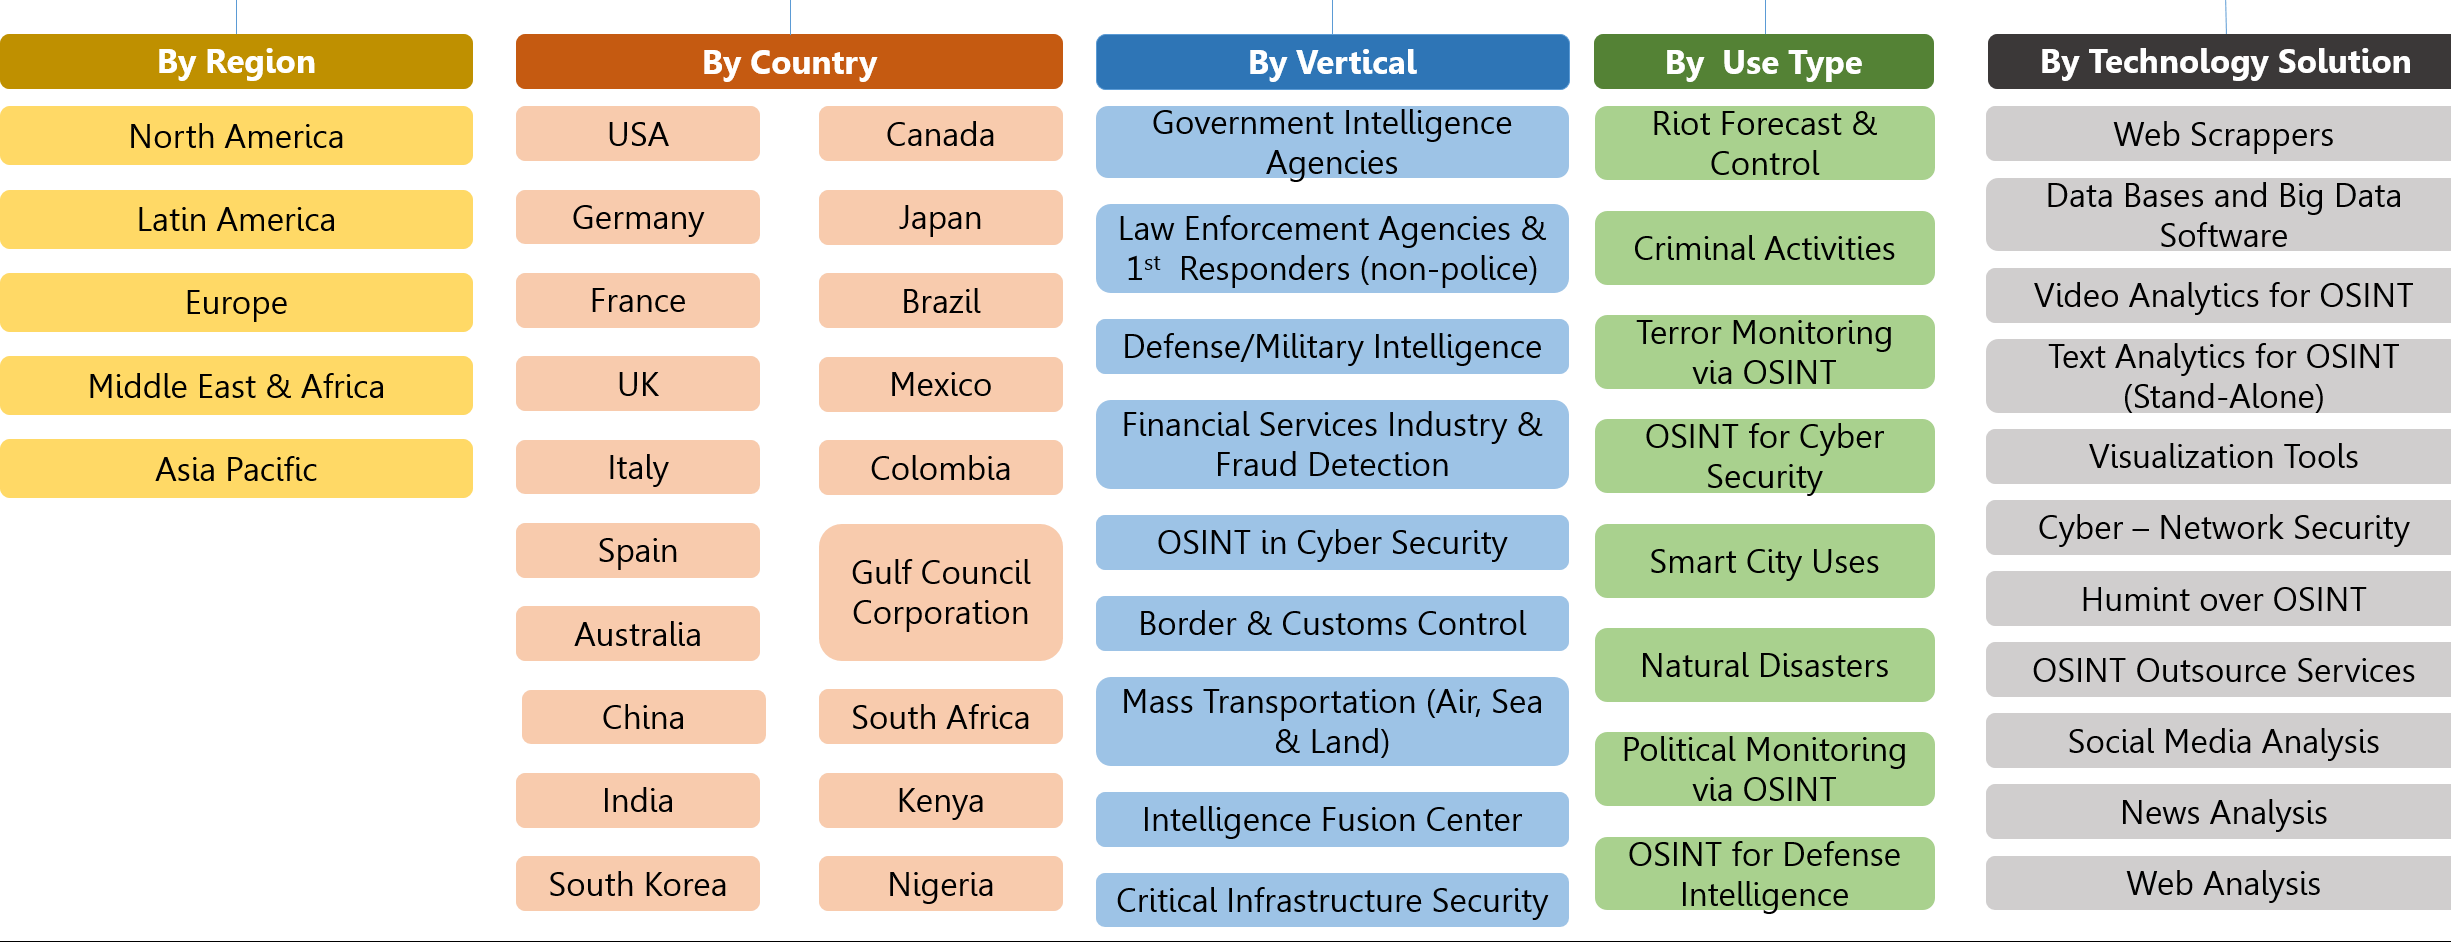
1.2.4      Global OSINT Markets Organogram          39

2             Open Source Intelligence (OSINT) Market Background & Assessment         40

2.1         Open Source Intelligence (OSINT): Definition        40

2.2         Popularity of OSINT         41

2.3         Social Media Monitoring               42

2.4         OSINT Types of Prodcuts and Solutions    42

2.4.1      Variety of Products          42

2.4.2      End-to-End solutions (Enterprise Solutions)           43

2.4.3      OSINT Solutions Deployment Strategies  44

2.5         Homeland Security, National Security, Law Enforcement and Public Safety Agenices               45

2.6         Palantir IPO Analysis        47

3             Global Security Concerns & Assessment  49

3.1         Global Security Concerns              49

3.2         Global Risks 2020: A Regional Perceptive               52

3.2.1      North America Homeland Security & Public Safety Market Drivers              56

3.2.1.1  Cyber Attacks     57

3.2.1.2  Data Fraud or Theft         57

3.2.1.3  Terrorism Threat              57

3.2.2      Europe Homeland Security & Public Safety Market Drivers             58

3.2.2.1  Cyberattacks      60

3.2.2.2  Assets bubble     60

3.2.2.3  Interstate conflict            60

3.2.2.4  Terror financing 60

3.2.3      APAC Homeland Security & Public Safety Market Drivers 61

3.2.3.1  Water Crises       62

3.2.3.2  Terrorist attacks               62

3.2.3.3  Manmade environmental catastrophes   63

3.2.3.4  Natural catastrophes      63

3.2.3.5  Cyberattacks      63

3.2.3.6  Interstate conflict            64

3.2.4      Middle East and Africa Homeland Security & Public Safety Market Drivers              64

3.2.4.1  Terrorism Threat              66

3.2.4.2  Political and Social Instability       66

3.2.4.3  Cyber-Attacks     66

3.2.4.4  Fiscal crises         67

3.2.4.5  Energy price shock          67

3.2.5      Latin America and the Caribbean Homeland Security & Public Safety Market Drivers               67

3.2.5.1  Failure of national governance    68

3.2.5.2  Economic issues               68

3.2.5.3  Failure of critical infrastructure   68

3.2.5.4  Drug trafficking 69

4             COVID-19 Pandemic Background & Assessment   70

4.1         COVID-19 and OSINT      70

4.2         North America COVID-19 Assessment      71

4.3         Europe COVID-19 Assessment     71

4.4         LATAM COVID-19 Assessment     71

4.5         APAC COVID-19 Assessment         72

4.6         Middle East & Africa COVID-19 Assessment           72

4.7         Homeland Security, Public Safety, National Security and Defense Agencies             72

4.8         Prolifiration of Data        75

4.9         Main Personal Data Sources for Homeland Security, Public Safety and Defense OSINT Projects               76

4.10       OSINT in Homeland Security, Public Safety, National Security and Defense Market               76

4.11       Global OSINT in Homeland Security and Public Safety Market Organogram             78

5             OSINT Market – Drivers and Inhibitors      80

5.1         OSINT Market: Drivers    80

5.2         OSINT Market: Inhibitors              81

6             OSINT Market: SWOT Analysis     82

6.1         Strenghts             82

6.2         Weaknesses        83

6.3         Opportunities     84

6.4         Threats 84

7             OSINT Technology Related Enablers & Inhibitors 85

7.1         Proliferation of Data       85

7.1.1      Main Personal Data Sources for Homeland Security & Public Safety OSINT & Big Data Projects               86

7.2         Privacy Issues and Concerns        86

7.2.1      Convention 108+              87

7.2.2      The General Data Protection Regulation (GDPR)  87

7.3         Data Sharing & Data Ownership  88

7.4         Profiling Activities            91

7.5         Cloud Computing Technologies  93

7.5.1      Cloud Computing Background     93

7.5.2      Cloud Computing Technologies Adoption by Homeland Security and National Security Agencies             95

7.6         The U.S. Federal Acquisition Streamlining Act of 1994      97

8             Global OSINT Market by Technology Market – 2020-2026              98

8.1         Consolidated Market 2020-2026               98

8.2         Market Analysis 2020-2026          99

8.3         Market Dynamics 2020-2026       100

8.4         Market Breakdown 2020-2026    101

9             Technology         103

9.1         OSINT Technology Background   103

9.2         OSINT Collection and Analysis Process     104

9.3         Data Sources Collection and Recording   105

9.3.1      Digital and Analog Data Production          105

9.4         Machine Learning            106

9.4.1      Machine Learning Methods         107

9.4.2      Deep Machine Learning 108

9.4.3      Application Types            108

9.4.3.1  Speech Recognition         108

9.4.3.2  Image Recognition           108

9.4.3.3  Natural Language Processing       109

9.4.3.4  Recommendation Systems           109

9.5         Data Exploration Vs. Machine Learning Model     109

9.6         Legacy Analytics Vs. Big Data Analytics    109

9.7         Web Scrapers     110

9.7.1      Market Size – Assessment and Forecast – 2020-2026        111

9.7.2      Market Breakdown 2020-2026    113

9.8         Databases and Big Data Software              113

9.8.1      Market Size – Assessment and Forecast – 2020-2026        114

9.8.2      Market Breakdown 2020-2026    116

9.9         Video Analytics for OSINT             116

9.9.1      Market Size – Assessment and Forecast – 2020-2026        118

9.9.2      Market Breakdown 2020-2026    119

9.10       Text Analytics for OSINT (Stand-Alone)     119

9.10.1    Market Size – Assessment and Forecast – 2020-2026        121

9.10.2    Market Breakdown 2020-2026    122

9.11       Visualization & Analytics Tools    123

9.11.1    Market Size – Assessment and Forecast – 2020-2026        123

9.11.2    Market Breakdown 2020-2026    125

9.12       Cyber Solutions – Network Security           125

9.12.1    Market Size – Assessment and Forecast – 2020-2026        126

9.12.2    Market Breakdown 2020-2026    128

9.13       HUMINT over OSINT       128

9.13.1    Market Size – Assessment and Forecast – 2020-2026        130

9.13.2    Market Breakdown 2020-2026    130

9.14       OSINT Outsourcing          131

9.14.1    The Problem with OSINT Outsourcing      132

9.14.2    Market Size – Assessment and Forecast – 2020-2026        132

9.14.3    Market Breakdown 2020-2026    134

9.15       Social Media Analysis      134

9.15.1    Sentiment Analysis on Social Media         135

9.15.2    Target Monitoring in Social Media            136

9.15.3    Social Media Monitoring is Widely Used 137

9.15.4    Market Size – Assessment and Forecast – 2020-2026        142

9.15.5    Market Breakdown 2020-2026    143

9.16       News Analysis    144

9.16.1    Reaching as Many Sources as Possible     144

9.16.2    Adding a Smart Analysis Layer    144

9.16.3    The importance of news monitoring         145

9.16.4    Market Size – Assessment and Forecast – 2020-2026        146

9.16.5    Market Breakdown 2020-2026    147

9.16.6    Market Size – Assessment and Forecast – 2020-2026        149

9.16.7    Market Breakdown 2020-2026    151

10           Global OSINT Markets by Vertical Market – 2020-2026     151

10.1       Consolidated Market 2020-2026               151

10.2       Market Analysis 2020-2026          152

10.3       Market Dynamics 2020-2026       153

10.4       Market Breakdown 2020-2026    154

11           Vertical Markets               156

11.1       Vertical Markets Data Sources and Type of Use Diagram 158

11.2       Applications and Data Type by Vertical    159

11.3       OSINT Maturity Level and Forecast by Vertical     160

11.4       Mission Critical Applications        161

11.4.1    Mission Critical Applications        161

11.5       Government Intelligence Agencies           162

11.5.1    Use Cases            163

11.5.1.1               Social Media Monitoring               163

11.5.1.2               People Interactions and Relationships      163

11.5.1.3               Anticipatory Intelligence               163

11.5.1.4               Money Laundering, Fraud & Terrorist Financing  164

11.5.2    Market Size – Assessment and Forecast – 2020-2026        164

11.5.3    Market Breakdown 2020-2026    166

11.6       Police Forces, Law Enforcement and 1st Responders Agenices      166

11.6.1    Police Forces and Law Enforcement Agenices       166

11.6.2    First Reponders (non-police)        170

11.6.3    Social Media Analysis Usage by Law Enforcement Agencies           171

11.6.3.1               Crowdsourcing OSINT Usage by Law Enforcement Agencies           172

11.6.3.2               Digital Forensics and OSINT Usage by Law Enforcement Agencies               173

11.6.4    Market Size – Assessment and Forecast – 2020-2026        174

11.6.5    Market Breakdown 2020-2026    175

11.7       Defense/Military Intelligence      176

11.7.1    Market Size – Assessment and Forecast – 2020-2026        179

11.7.2    Market Breakdown 2020-2026    180

11.8       Financial Intelligence & Fraud Detection 181

11.8.1    Market Size – Assessment and Forecast – 2020-2026        181

11.8.2    Market Breakdown 2020-2023    183

11.9       Cyber Security Agencies 184

11.9.1    Market Size – Assessment and Forecast – 2020-2026        185

11.9.2    Market Breakdown 2020-2026    187

11.10     Border Control and Customs       187

11.10.1 Market Size – Assessment and Forecast – 2020-2026        190

11.10.2 Market Breakdown 2020-2026    191

11.11     Mass Trasnportation (Air, Sea & Land)     191

11.11.1 Market Size – Assessment and Forecast – 2020-2026        192

11.11.2 Market Breakdown 2020-2026    193

11.12     Intelligence Fusion Centers          194

11.12.1 Market Size – Assessment and Forecast – 2020-2026        195

11.12.2 Market Breakdown 2020-2026    196

11.13     Critical Infrastructure Security     196

11.13.1 Market Size – Assessment and Forecast – 2020-2026        197

11.13.2 Market Breakdown 2020-2026    198

12           Global OSINT Markets by Use Type – 2020-2026  199

12.1       Consolidated Market 2020-2026               199

12.2       Market Analysis 2020-2026          200

12.3       Market Dynamics 2020-2026       201

12.4       Market Breakdwon 2020-2026    201

13           Use Types            202

13.1       Riot Forecast & Control  202

13.1.1    Market Size – Assessment and Forecast – 2020-2026        204

13.1.2    Market Breakdown 2020-2026    205

13.2       Criminal Activities            206

13.2.1    Market Size – Assessment and Forecast – 2020-2026        207

13.2.2    Market Breakdown 2020-2026    208

13.3       Terror Monitoring            209

13.3.1    Market Size – Assessment and Forecast – 2020-2026        210

13.3.2    Market Breakdown 2020-2026    212

13.4       OSINT for Cyber Security – Threat Intelligence     213

13.4.1    Market Size – Assessment and Forecast – 2020-2026        215

13.4.2    Market Breakdown 2020-2026    216

13.5       Smart City Uses 217

13.5.1    Market Size – Assessment and Forecast – 2020-2026        217

13.5.2    Market Breakdown 2020-2026    218

13.6       Natural Disaster Management    219

13.6.1    Market Size – Assessment and Forecast – 2020-2026        221

13.6.2    Market Breakdown 2020-2026    222

13.7       Political Monitoring         222

13.7.1    Market Size – Assessment and Forecast – 2020-2026        223

13.7.2    Market Breakdown 2020-2026    225

13.8       Defense Intelligence        226

13.8.1    Market Size – Assessment and Forecast – 2020-2026        226

13.8.2    Market Breakdown 2020-2026    228

13.9       Financial Investigations – Financial Intelligence (FININT)  229

13.9.1    Market Size – Assessment and Forecast – 2020-2026        229

13.9.2    Market Breakdown 2020-2026    230

14           Global OSINT Market by Region  232

14.1       5 Regional Markets Comparison Anlysis  232

14.1.1    Consolidated Market 2020-2026               232

14.1.2    Market Analysis 2020-2026          233

14.1.3    Market Dynamics 2020-2026       233

14.1.4    Market Breakdown 2020-2026    234

15           Global OSINT Market by Country               236

15.1       19 National Markets Companrison Anlysis             236

15.1.1    Consolidated Market 2020-2026               236

15.1.2    Market Analysis 2020-2026          237

15.1.3    Market Dynamics 2020-2026       238

15.1.4    Market Breakdown 2020-2026    239

North America   243

15.2       USA OSINT Market           243

15.2.1    Facts & Figures 2020       243

15.2.2    U.S. National Security Risk Assessment 2021        243

15.2.3    USA OSINT Overview       247

15.2.4    USA OSINT Market – 2020-2026 249

15.2.5    Market Size – Assessment and Forecast – 2020-2026        249

15.2.6    Market Breakdown 2020-2026    250

15.3       Canada OSINT Market    250

15.3.1    Facts & Figures 2020       250

15.3.2    Canada National Security Risk Assessment 2021  250

15.3.3    Canada OSINT Overview               252

15.3.4    Canada OSINT Market – 2020-2026          252

15.3.5    Market Size – Assessment and Forecast – 2020-2026        252

15.3.6    Market Breakdown 2020-2026    253

Europe  254

15.4       UK OSINT Market             254

15.4.1    Facts & Figures 2020       254

15.4.2    UK National Security Risk Assessment 2021          254

15.4.3    UK OSINT Overview         256

15.4.4    UK OSINT Market – 2020-2026    257

15.4.5    Market Size – Assessment and Forecast – 2020-2026        257

15.4.6    Market Breakdown – 2020-2026               258

15.5       Germany OSINT Market 2020-2026          259

15.5.1    Facts & Figures 2020       259

15.5.2    Germany National Security Risk Assessment 2021             259

15.5.3    Germany OSINT Overview            261

15.5.4    Germany OSINT Market – 2020-2026       262

15.5.5    Market Size – Assessment and Forecast – 2020-2026        262

15.5.6    Market Breakdown – 2020-2026               263

15.6       France OSINT Market 2020-2026               264

15.6.1    Facts & Figures 2020       264

15.6.2    France National Security Risk Assessment 2021   264

15.6.3    France OSINT Overview  265

15.6.4    France OSINT Market 2020-2026               266

15.6.5    Market Size – Assessment and Forecast – 2020-2026        266

15.6.6    Market Breakdown – 2020-2026               267

15.7       Italy OSINT Market 2020-2026    268

15.7.1    Facts & Figures 2020       268

15.7.2    Italy National Security Risk Assessment 2021        268

15.7.3    Italy OSINT Overview      269

15.7.4    Italy OSINT Market 2020-2026    269

15.7.5    Market Size – Assessment and Forecast – 2020-2026        269

15.7.6    Market Breakdown – 2020-2026               271

15.8       Spain OSINT Market 2020-2026  272

15.8.1    Facts & Figures 2020       272

15.8.2    Spain National Security Risk Assessment 2021     272

15.8.3    Spain OSINT Overview    272

15.8.4    Spain OSINT Market 2020-2026  273

15.8.5    Market Size – Assessment and Forecast – 2020-2026        273

15.8.6    Market Breakdown – 2020-2026               274

Asia Pacific         275

15.9       Australia OSINT Market – 2020 – 2026     275

15.9.1    Facts & Figures 2020       275

15.9.2    Australia National Security Risk Assessment 2021              275

15.9.3    Australia OSINT Overview             277

15.9.4    Australia OSINT Market 2020-2026           278

15.9.5    Market Size – Assessment and Forecast – 2020-2026        278

15.9.6    Market Breakdown – 2020-2026               279

15.10     India OSINT Market – 2020-2026               280

15.10.1 Facts & Figures 2020       280

15.10.2 India National Security Risk Assessment 2021      280

15.10.3 India OSINT Overview     281

15.10.4 India OSINT Market 2020-2026   282

15.10.5 Market Size – Assessment and Forecast – 2020-2026        282

15.10.6 Market Breakdown – 2020-2026               283

15.11     China OSINT Market – 2020-2026              283

15.11.1 Facts & Figures 2021       283

15.11.2 China National Security Risk Assessment 2021     284

15.11.3 China OSINT Overview    284

15.11.4 China OSINT Market 2020-2026  285

15.11.5 Market Size – Assessment and Forecast – 2020-2026        285

15.11.6 Market Breakdown 2020-2026    286

15.12     South Korea OSINT Market 2020-2026     287

15.12.1 Facts & Figures 2020       287

15.12.2 South Korea National Security Assessment 2021 287

15.12.3 South Korea OSINT Overview      287

15.12.4 South Korea OSINT Market 2020-2026     288

15.12.5 Market Size – Assessment and Forecast – 2020-2026        288

15.12.6 Market Breakdown – 2020-2026               289

15.13     Japan OSINT Market – 2020-2026             289

15.13.1 Facts & Figures 2020       289

15.13.2 Japan National Security Risk Assessment 2021     289

15.13.3 Japan OSINT Overview    290

15.13.4 Japan OSINT Market 2020-2026  290

15.13.5 Market Size – Assessment and Forecast – 2020-2026        290

15.13.6 Market Breakdown 2020-2026    291

Latin America     292

15.14     Brazil OSINT Market – 2020-2026              292

15.14.1 Facts & Figures 2020       292

15.14.2 Brazil National Security Assessment 2021              292

15.14.3 Brazil OSINT Overview    293

15.14.4 Brazil OSINT Market – 2020-2026              293

15.14.5 Market Size – Assessment and Forecast – 2020-2026        293

15.14.6 Market Breakdown – 2020-2026               294

15.15     Mexico OSINT Market – 2020-2026          295

15.15.1 Facts & Figures 2020       295

15.15.2 Mexico National Security Assessment 2021          295

15.15.3 Mexico OSINT Overview 295

15.15.4 Mexico OSINT Market 2020-2026              296

15.15.5 Market Size – Assessment and Forecast – 2020-2026        296

15.15.6 Market Breakdown – 2020-2026               297

15.16     Colombia OSINT Market – 2020-2026      297

15.16.1 Facts & Figures 2020       297

15.16.2 Colombia National Security Assessment 2021      297

15.16.3 Colombia OSINT Overview            298

15.16.4 Colombia OSINT Market 2020-2026          298

15.16.5 Market Size – Assessment and Forecast – 2020-2026        298

15.16.6 Market Breakdown – 2020-2023               299

Middle East and Africa   300

15.17     GCC (Golf Council Corporation) OSINT Market 2016-2022               300

15.17.1 GCC National Security Assessment for 2021          300

15.17.1.1             Saudi Arabia Country Assessment              300

15.17.1.2             UAE Country Assessment              301

15.17.1.3             Kuwait Country Assessment         301

15.17.1.4             Bahrain Country Assessment       301

15.17.2 GCC OSINT Overview       302

15.17.2.1             UAE OSINT Overview      302

15.17.2.2             Saudi Arabia OSINT Overview      302

15.17.3 GCC OSINT Market 2020-2026     302

15.17.4 Market Size – Assessment and Forecast – 2020-2026        302

15.17.5 Market Breakdown – 2020-2026               303

15.18     South Africa OSINT Market 2020-2026     304

15.18.1 Facts & Figures 2021       304

15.18.2 South Africa National Security Assessment 2021 304

15.18.3 South Africa OSINT Overview       305

15.18.4 South Africa OSINT Market 2020-2026     305

15.18.5 Market Size – Assessment and Forecast – 2020-2026        305

15.18.6 Market Breakdown – 2020-2026               306

15.19     Nigeria OSINT Market 2020-2026              307

15.19.1 Facts & Figures 2020       307

15.19.2 Nigeria National Security Assessment 2021           307

15.19.3 Nigeria OSINT Overview 307

15.19.4 Nigeria OSINT Market 2020-2026              308

15.19.5 Market Size – Assessment and Forecast – 2020-2026        308

15.19.6 Market Breakdown – 2020-2026               309

15.20     Kenya OSINT Market 2020-2026 309

15.20.1 Facts & Figures 2020       309

15.20.2 Kenya National Security Assessment 2021             309

15.20.3 Kenya OSINT Overview   310

15.20.4 Kenya OSINT Market 2020-2026 310

15.20.5 Market Size – Assessment and Forecast – 2020-2026        310

15.20.6 Market Breakdown – 2020-2026               311

16           Select OSINT Projects and Programs         312

17           Leading Vendors               319

17.1       Enterprise Solutions        321

17.1.1    Palantir 321

17.1.1.1               Company Profile              321

17.1.1.2               OSINT Products and Solutions     321

17.1.2    Splunk   324

17.1.2.1               Company Profile              324

17.1.2.2               OSINT Products and Solutions     325

17.1.3    IBM        326

17.1.3.1               Company Profile              326

17.1.3.2               OSINT Products and Solutions     327

17.1.4    SAS         329

17.1.4.1               Company Profile              329

17.1.4.2               OSINT Products and Solutions     330

17.1.5    BAE Systems       331

17.1.5.1               Company Profile              331

17.1.5.2               OSINT Products and Solutions     331

17.1.6    Leidos   332

17.1.6.1               Company Profile              332

17.1.6.2               OSINT Products and Solutions     332

17.1.7    Edge360              333

17.1.7.1               Company Profile              333

17.1.7.2               OSINT Products and Solutions     334

17.1.8    BrightPlanet        334

17.1.8.1               Company Profile              334

17.1.8.2               OSINT Products and Solutions     334

17.1.9    Cyveillance (previosly part of LookingGlass Cyber Solutions, now part of ZeroFOX)               335

17.1.9.1               Company Profile              335

17.1.9.2               OSINT Products and Solutions     335

17.1.10 Haystax Technology        336

17.1.10.1             Company Profile              336

17.1.10.2             OSINT Products and Solutions     337

17.1.11 Raytheon             337

17.1.11.1             Company Profile              337

17.1.11.2             OSINT Products and Solutions     337

17.2       Stand-Alone Solutions    338

17.2.1    Thales   338

17.2.1.1               Company Profile              338

17.2.1.2               OSINT Products and Solutions     338

17.2.2    Digital Clues       339

17.2.2.1               OSINT Products and Solutions     339

17.2.3    Voyager Labs     340

17.2.3.1               OSINT Products and Solutions     340

17.2.4    CobWebs Technologies  340

17.2.4.1               OSINT Products and Solutions     341

17.2.5    Recorded Future              341

17.2.5.1               Company Profile              341

17.2.5.2               OSINT Products and Solutions     342

17.2.6    Cipher   343

17.2.6.1               Company Profile              343

17.2.6.2               OSINT Products and Solutions     343

17.2.7    Digimind              343

17.2.7.1               Company Profile              343

17.2.7.2               OSINT Products and Solutions     344

17.2.8    Comintelli            344

17.2.8.1               Company Profile              344

17.2.8.2               OSINT Products and Solutions     345

17.2.9    CI Radar               345

17.2.9.1               Company Profile              345

17.2.9.2               OSINT Products and Solutions     346

17.2.10 InfoNgen             346

17.2.10.1             Company Profile              346

17.2.10.2             OSINT Products and Solutions     347

17.2.11 M-Brain               347

17.2.11.1             Company Profile              347

17.2.11.2             OSINT Products and Solutions     347

17.2.12 Centripetal Networks     348

17.2.12.1             Company Profile              348

17.2.12.2             OSINT Products and Solutions     349

17.2.13 Netlytic 349

17.2.13.1             Company Profile              349

17.2.13.2             OSINT Products and Solutions     349

17.2.14 Rocket Software               349

17.2.14.1             Company Profile              349

17.2.14.2             OSINT Products and Solutions     350

17.2.15 Kcura/Relativity Analytics             350

17.2.15.1             Company Profile              350

17.2.15.2             OSINT Products and Solutions     351

17.2.16 Clarabridge         351

17.2.16.1             Company Profile              351

17.2.16.2             OSINT Products and Solutions     351

17.2.17 Zetta Cloud         352

17.2.17.1             Company Profile              352

17.2.17.2             OSINT Products and Solutions     352

17.3       Building Blocks  352

17.3.1    Text Analytics     353

17.3.1.1               Basis Technology             353

17.3.1.2               Expert System    354

17.3.1.3               Intuview              356

17.3.1.4               Lexalytics            356

17.3.1.5               Sinequa 357

17.3.1.6               Discovertext       358

17.3.1.7               Other Text Analytics Companies 359

17.3.2    Visualization & Analytics Tools    360

17.3.2.1               Gephi     360

17.3.2.2               Touch Graph       361

17.3.2.3               Cambridge Intelligence – KeyLines            361

17.3.2.4               Treparel (now part of Evalueserve)           362

17.3.2.5               Other Visualization & Analytics Tools Companies               364

17.3.3    Crawlers              365

17.3.3.1               Mozenda             365

17.3.3.2               80legs   365

17.3.3.3               Websundew        366

17.3.4    Content Databases and Web-Scrappers   367

17.3.4.1               Meltwater           367

17.3.4.2               Import.io             368

17.3.4.3               Webhose.io        369

17.3.5    Social Media Analysis Tools         369

17.3.5.1               Tracx     370

17.3.5.2               Radian6 (now part of Salesforce Marketing Cloud)             370

17.3.5.3               Socialbakers       371

17.3.5.4               Sprout Social      372

17.3.6    OSINT Outsource Services            373

17.3.6.1               Praescient Analytics        373

17.3.6.2               Terrogence         374

17.4       OSINT companies acquisitions     374

18           Research Methodology  375

18.1       Report Structure               375

18.2       Research Methodology  375

18.3       For Whom is This Report?            376

19           Disclaimer & Copyright   378

Tables

List of Tables

Table 1 – Global OSINT Market Size ($M) and Annual Growth Rates (%) – 2020-2026            35

Table 2 – Top 5 Risks of Doing Business in North America 57

Table 3 – Top 5 Risks to Doing Business in Europe               59

Table 4 – Top 5 Risks to Doing Business in South Asia        62

Table 5 – Top 5 Risks to Doing Business in East Asia Pacific             63

Table 6 – Top 5 Risks to Doing Business in Middle East and North Africa    65

Table 7 – Top 5 Risks to Doing Business in Sub-Saharan Africa        65

Table 8 – Top 5 Risks to Doing Business in Latin America and the Caribbean            68

Table 9 – Cloud Computing Initiatives in Select Countries 96

Table 10 – Global OSINT Market ($M) by Technology 2020-2026   98

Table 11 – Global OSINT Market ($M) and CAGR (%) by Technology Market 2020, 2026      99

Table 12 – Global OSINT Market Annual Growth Rate (%) by Technology 2020-2026            100

Table 13 – Global OSINT Market Share (%) by Technology 2020-2026         101

Table 14 – Global OSINT Cumulative Market ($M) and Cumulative Market Share (%) by Technology Market 2020-2026   102

Table 15 – Machine Learning Method Types          107

Table 16 – Legacy Analytics Vs. Big Data Analytics               109

Table 17 – Web Scrapers for OSINT Market Size ($M) and Annual Growth Rate (%) 2020-2026               112

Table 18 – Databases and Big Data Software Technology for OSINT Market Size ($M) and Annual Growth Rates (%) 2020-2026        115

Table 19 – Video Analytics Software for OSINT Market Size ($M) and Annual Growth Rates (%) 2020-2026        118

Table 20 – Commercial Text Mining and Analysis Sofware Comparison       121

Table 21 – Text Analytics (stand-alone) for OSINT Market Size ($M) and Annual Growth Rates (%) 2020-2026    121

Table 22 – Visualization & Analytics Tools for OSINT Market Size ($M) and Annual Growth Rates (%) 2020-2026       123

Table 23 – Cyber Security Solutions for OSINT Market Size ($M) and Annual Growth Rate (%) 2020-2026           127

Table 24 – HUMINT Over OSINT Market Size ($M) and Annual Growth Rate (%) 2020-2026               130

Table 25 – OSINT Outsourcing in OSINT Market Size ($M) and Annual Growth Rates (%) 2020-2026      133

Table 26 – Social Media Analysis for OSINT Market Size ($M) and Annual Growth Rates (%) 2020-2026           142

Table 27 – News Analysis for OSINT Market Size ($M) and Annual Growth Rates (%) 2020-2026      146

Table 28 – Web Analysis for OSINT Market Size ($M) and Annual Growth Rates (%) 2020-2026      149

Table 29 – Global OSINT Market ($M) by Vertical Market 2020-2026          151

Table 30 – Global OSINT Market ($M) and CAGR (%) by Vertical Market 2020, 2026             153

Table 31 – Global OSINT Market Annual Growth Rate (%) by Vertical 2020-2026    153

Table 32 – Global OSINT Market Share (%) by Vertical 2020-2026 154

Table 33 – Global OSINT Cumulative Market ($M) and Cumulative Market Share (%) by Technology Market 2020-2026   155

Table 34 – Global OSINT Usage Types Used by Vertical Markets Ranked by Prevalence of Usage    159

Table 35 – Vertical Markets Maturity Level as of 2020 and Maturity Forecast for 2021-2026               160

Table 36 – Mission Critical Applications and Scope of Activity         161

Table 37 – Government Intelligence Agencies Vertical Market Size ($M) and Annual Growth Rates (%) 2020-2026       164

Table 38 – Police Forces, Law Enforcement and 1st Responders Vertical Market Size ($M) and Annual Growth Rates (%) 2020-2026        174

Table 39 – DARPA Research, Development, Test and Evaluation Budget request for FY2016               178

Table 40 – Defese/Military Intelligence Vertical Market Size ($M) and Annual Growth Rates (%) 2020-2026    179

Table 41 – Financial Intelligence & Fraud Detection Vertical Market Size ($M) and Annual Growth Rates (%) 2020-2026       182

Table 42 – Cybersecurity Agencies Vertical Market Size ($M) and Annual Growth Rate (%) 2020-2026           186

Table 43 – Border Control and Customs Vertical Market Size ($M) and Annual Growth Rate (%) 2020-2026    190

Table 44 -Mass Transportation Security Vertical Market Size ($M) and Annual Growth Rate (%) 2020-2026    192

Table 45 – Intelligence Fusion Centers Vertical Market Size ($M) and Annual Growth Rate (%) 2020-2026           195

Table 46 – Critical Infrastructure Security Vertical Market Size ($M) and Annual Growth Rate (%) 2020-2026    197

Table 47 – Global OSINT in Homeland Security, Public Safety and Defense Market ($M) by Use Type 2020-2026       199

Table 48 – Global OSINT in Homeland Security, Public Safety and Defense Market ($M) and CAGR (%) by Use Type Market 2020, 2026             200

Table 49 – Global OSINT in Homeland Security, Public Safety and Defense Market Annual Growth Rates (%) by Use Type Market 2020-2026              201

Table 50 – Global OSINT in Homeland Security, Public Safety and Defense Market Share (%) by Use Type Market 2020-2026  201

Table 51 – Riot Forecast & Control OSINT Use Type Market Size ($M) and Annual Growth Rates (%) 2020-2026       204

Table 52 – OSINT Against Criminal Activities Use Type Market Size ($M) and Annual Growth Rates (%) 2020-2026       207

Table 53 – OSINT for Terrorist Monitoring Market Size ($M) and Annual Growth Rates (%) 2020-2026           211

Table 54 – OSINT for Cybersecurity Threat Intelligence Market Size ($M) and Annual Growth Rates (%) 2020-2026       215

Table 55 – OSINT for Smart City Projects Market Size ($M) and Annual Growth Rates (%) 2020-2026           217

Table 56 – OSINT for Natural Disaster Management Market Size ($M) and Annual Growth Rates (%) 2020-2026       221

Table 57 – OSINT for Political Monitoring Market Size ($M) and Annual Growth Rates (%) 2020-2026           223

Table 58 – OSINT for Defense Intelligence Market Size ($M) and Annual Growth Rates (%) 2020-2026           227

Table 59 – OSINT for Financial Investigations and Intelligence Market Size ($M) and Annual Growth Rates (%) 2020-2026       229

Table 60 – Global OSINT in Homeland Security, Public Safety and Defense Market Size ($M) by Region 2020-2026      232

Table 61 – Global OSINT in Homeland Security, Public Safety and Defense Market Size ($M) and Compound Annual Growth Rate (%) by Region 2020, 2026    233

Table 62 – Global OSINT in Homeland Security, Public Safety and Defense Cumulative Market Size ($M) and Market Share (%) by Region 2016-2022      233

Table 63 – Global OSINT in Homeland Security, Public Safety and Defense Market Share (%) by Region 2020-2026      234

Table 64 – Global OSINT in Homeland Security, Public Safety and Defense Market Size ($M) by Country 2020-2026    236

Table 65 – Global OSINT in Homeland Security, Public Safety and Defense Market Size ($M) and Compound Annual Growth Rate (%) by County 2020, 2026    237

Table 66 – Global OSINT in Homeland Security, Public Safety and Defense Market Annual Growth Rate (%) by Country 2020-2026  238

Table 67 – Global OSINT in Homeland Security, Public Safety and Defense Market Share (%) by Country 2020-2026    239

Table 68 – Global OSINT in Homeland Security, Public Safety and Defense Cumulative Market ($M) and Market Share (%) by Country 2020-2026             240

Table 69 – USA OSINT Market Size ($M) and Annual Growth Rates (%) 2020-2026 249

Table 70 – Canada OSINT Market Size ($M) and Annual Growth Rates (%) 2020-2026          252

Table 71 – UK OSINT Market Size ($M) and Annual Growth Rates (%) 2020-2026   257

Table 72 – Germany OSINT Market Size ($M) and Annual Growth Rates (%) 2020-2026       262

Table 73 – France OSINT Market Size ($M) and Annual Growth Rates (%) 2020-2026           266

Table 74 – Italy OSINT Market Size ($M) and Annual Growth Rates (%) 2020-2026 270

Table 75 – Spain OSINT Market Size ($M) and Annual Growth Rates (%) 2020-2026              273

Table 76 – Australia OSINT Market Size ($M) and Annual Growth Rates (%) 2020-2026       278

Table 77 – India OSINT Market Size ($M) and Annual Growth Rates (%) 2020-2026               282

Table 78 – China OSINT Market Size ($M) and Annual Growth Rates (%) 2020-2026             285

Table 79 – South Korea OSINT Market Size ($M) and Annual Growth Rates (%) 2020-2023               288

Table 80 – Japan OSINT Market Size ($M) and Annual Growth Rates (%) 2020-2026             290

Table 81 – Brazil OSINT Market Size ($M) and Annual Growth Rates (%) 2020-2026             293

Table 82 – Mexico OSINT Market Size ($M) and Annual Growth Rates (%) 2020-2026          296

Table 83 – Colombia OSINT Market Size ($M) and Annual Growth Rates (%) 2020-2026      298

Table 84 – GCC OSINT Market Size ($M) and Annual Growth Rates (%) 2020-2026 302

Table 85 – South Africa OSINT Market Size ($M) and Annual Growth Rates (%) 2020-2026               305

Table 86 – Nigeria OSINT Market Size ($M) and Annual Growth Rates (%) 2020-2026          308

Table 87 – Kenya OSINT Market Size ($M) and Annual Growth Rates (%) 2020-2026            310

Table 88 – Select OSINT Projects and Programs 2019-2021             312

Table 89 – Select OSINT Projects and Programs Up to 2018             315

Table 90 – Other Text Analytics Companies            359

Table 91 – List of other Visualization & Analytics Tools Companies             364


Figures

List of Figures

Figure 1 – Global OSINT Market Size ($M) – 2020-2026      35

Figure 2 – Global OSINT Market Annual Growth Rate (%) 2020-2026           36

Figure 3 – Global OSINT Market ($M) by Region 2020-2026            36

Figure 4 – Global OSINT Market ($M) by Country 2020-2026          37

Figure 5 – Global OSINT Market ($M) by Technology 2020-2026    37

Figure 6 – Global OSINT Market ($M) by Use Type 2020-2026        38

Figure 7 – Global OSINT Market ($M) by Vertical 2020-2026           38

Figure 8 – Volume of Intelligence Produced by Intelligence Organizations by Source Type (2020-2021 HSRC Estimations)    41

Figure 9 – OSINT Product Deployment Strategy   46

Figure 10 – Vertical Markets and Types of Threats they Encounter              47

Figure 11 – Palantir Government Segment Revenues ($M)              49

Figure 12 – Palantir Revenues from U.S. Army 2008 – H1 2020     50

Figure 13 – Global Risks Landscape 2020 53

Figure 14 – Top Global Risks by Impact and Likelihood       53

Figure 15 – The Global Risks Interconnections Map 2020  54

Figure 16 – The Global Risks-Trends Interconnections Map 2019   55

Figure 17 – Global Risks 2020: A Regional Perceptive – Most Likely Global Risk       56

Figure 18 – Major Drug Trafficking Routes and Major Gold Mining Areas in Latin America 70

Figure 19 – Vertical Markets and Types of Threats they Encounter              76

Figure 20 – Main Personal Data Sources for Homeland Security, Public Safety and Defense OSINT Projects   77

Figure 21 – Main Personal Data Sources for Homeland Security and Public Safety OSINT & Big Data Projects      87

Figure 22 – Concerns When Applying Cloud Computing Technologies         95

Figure 23 – Cloud Migration – Crime Analytics Vs. RMS/CAD           97

Figure 24 – Global OSINT Market ($M) by Technology 2020-2026 100

Figure 25 – Global OSINT Market Share (%) by Technology 2020-2026        103

Figure 26 – Global OSINT Cumulative Market ($M) and Cumulative Market Share (%) by Technology 2020-2026   104

Figure 27 – OSINT Technology Platforms and Solutions Ecosystem              105

Figure 28 – OSINT & Big Data Collection and Analysis Flow Chart  106

Figure 29 – Digital vs. Analog Forms of Data          107

Figure 30 – Data Exploration Vs. Machine Learning Model              110

Figure 31 – Top Web Scraping Uses           112

Figure 32 – Web Scrapers for OSINT Market Size ($M) 2020-2026 113

Figure 33 – Web Scrapers for OSINT Market Share (%) 2020-2026                114

Figure 34 – Databases and Big Data Software for OSINT Market Size ($M) 2020-2026          116

Figure 35 – Databases and Big Data Software for OSINT Market Share (%) 2020-2026          117

Figure 36 – Video Analytics Software for OSINT Market Size ($M) 2020-2026          119

Figure 37 – Video Analytics Software for OSINT Market Share (%) 2020-2026          120

Figure 38 – Text Analytics (stand-alone) for OSINT Market Size ($M) 2020-2026     123

Figure 39 – Text Analytics (stand-alone) for OSINT Market Share (%) 2020-2026     123

Figure 40 – Visualization & Analytics Tools for OSINT Market Size ($M) 2020-2026               125

Figure 41 – Visualization & Analytics Tools for OSINT Market Share (%) 2020-2026               126

Figure 42 – Unidirectional Security Gateways        127

Figure 43 – Cyber Security Solutions for OSINT Market Size ($M) 2020-2026            128

Figure 44 – Cyber Security Solutions for OSINT Market Share (%) 2020-2026           129

Figure 45 – All-Source Processing and Analysis      130

Figure 46 – HUMINT Over OSINT Market Size ($M) 2020-2026       131

Figure 47 – HUMINT Over OSINT Market Share (%) 2020-2026      131

Figure 48 – OSINT Outsourcing in OSINT Market Size ($M) 2020-2026        134

Figure 49 – OSINT Outsourcing in OSINT Market Share (%) 2020-2026        135

Figure 50 – Leading Social Media Platforms (2020)             136

Figure 51 – World Map of Social Networks Used in Each Country  137

Figure 52 – USA Cities, Counties and Law Enforcement Agencies that Spent at least $10K on Social Media Software    139

Figure 53 – Social Media Analysis for OSINT Market Size ($M) 2020-2026  144

Figure 54 – Social Media Analysis for OSINT Market Share (%) 2020-2026  144

Figure 55 – News Analysis for OSINT Market Size ($M) 2020-2026               148

Figure 56 – News Analysis for OSINT Market Share (%) 2020-2026               148

Figure 57 – Web Analysis for OSINT Market Size ($M) 2020-2026  151

Figure 58 – Web Analysis for OSINT Market Share (%) 2020-2026 152

Figure 59 – Global OSINT Market ($M) by Vertical Market 2020-2026         153

Figure 60 – Global OSINT Market Share (%) by Vertical Market 2020-2026               156

Figure 61 – Global OSINT Market ($M) and Cumulative Market Share (%) by Vertical Market 2020-2026           157

Figure 62 – Vertical Markets Data Sources and Use Type Diagram 159

Figure 63 – Government Intelligence Agencies Vertical Market Size ($M) 2020-2026           166

Figure 64 – Government Intelligence Agencies Vertical Market Share (%) 2020-2026           167

Figure 65 – What does your agency use social media for?               169

Figure 66 – USA Cities, Counties and Law Enforcement Agencies that Spent at least $10K on Social Media Software    172

Figure 67 – Police Forces, Law Enforcement and 1st Responders Vertical Market Size ($M) 2020-2026           175

Figure 68 – Police Forces, Law Enforcement and 1st Responders Vertical Market Share (%) 2020-2026           176

Figure 69 – Defense/Military Intelligence Vertical Market Size ($M) 2020-2026     181

Figure 70 – Defense/Military Intelligence Vertical Market Share (%) 2020-2026      181

Figure 71 – Financial Intelligence & Fraud Detection Vertical Market Size ($M) 2020-2026 183

Figure 72 – Financial Intelligence & Fraud Detection Vertical Market Share (%) 2020-2026               184

Figure 73 – Cybersecurity Agencies Vertical Market Size ($M) 2020-2026  187

Figure 74 – Cybersecurity Agencies Vertical Market Share (%) 2020-2026  188

Figure 75 – Social Media and Communication Modes Between Smugglers and Migrants     190

Figure 76 – Border Control and Customs Vertical Market Size ($M) 2020-2026       191

Figure 77 – Border Control and Customs Vertical Market Share (%) 2020-2026       192

Figure 78 – Mass Transportation Security Vertical Market Size ($M) 2020-2026      194

Figure 79 – Mass Transportation Security Vertical Market Share (%) 2020-2026     194

Figure 80 – Intelligence Fusion Centers Vertical Market Size ($M) 2020-2026          196

Figure 81 – Intelligence Fusion Centers Vertical Market Share (%) 2020-2026          197

Figure 82 – Critical Infrastructure Security Vertical Market Size ($M) 2020-2026    198

Figure 83 – Critical Infrastructure Security Vertical Market Share (%) 2020-2026    199

Figure 84 – Global OSINT in Homeland Security, Public Safety and Defense Market ($M) by Use Type 2016-2022       201

Figure 85 – Riot Forecast & Control OSINT Use Type Market Size ($M) 2020-2026  205

Figure 86 – Riot Forecast & Control OSINT Use Type Market Share (%) 2020-2026 206

Figure 87 – OSINT Against Criminal Activities Use Type Market Size ($M)   208

Figure 88 – OSINT Against Criminal Activities Use Type Market Share (%)  209

Figure 89 – OSINT for Terrorist Monitoring Market Size ($M) 2020-2026   212

Figure 90 – OSINT for Terrorist Monitoring Market Share (%) 2020-2026   213

Figure 91 – Deloitte Threat Intelligence Feeds – OSINT as a Vital Source    214

Figure 92 – EY’s Approach to Threat Intelligence  216

Figure 93 – OSINT for Cybersecurity Threat Intelligence Market Size ($M) 217

Figure 94 – OSINT for Cybersecurity Threat Intelligence Market Share (%) 217

Figure 95 – OSINT for Smart City Projects Market Size ($M) 2020-2026      219

Figure 96 – OSINT for Smart City Projects Market Share (%)            219

Figure 97 – FEMA Twitter Alerts During Natural Disasters 221

Figure 98 – Hurricane Sandy Social Media Stats    221

Figure 99 – OSINT for Natural Disaster Management Market Size ($M)       222

Figure 100 – OSINT for Natural Disaster Management Market Share (%)    223

Figure 101 – OSINT for Political Monitoring Market Size ($M) 2020-2026   226

Figure 102 – OSINT for Political Monitoring Market Share (%) 2020-2026  226

Figure 103 – OSINT for Defense Intelligence Market Size ($M)       228

Figure 104 – OSINT for Defense Intelligence Market Share (%)       229

Figure 105 – OSINT for Financial Investigations and Intelligence Market Size ($M) 2020-2026               231

Figure 106 – OSINT for Financial Investigations and Intelligence Market Share (%) 2020-2026               231

Figure 107 – OSINT in Homeland Security, Public Safety and Defense Market Size (($M) by Region 2020-2026            233

Figure 108 – Global OSINT in Homeland Security, Public Safety and Defense Cumulative Market Size ($M) and Market Share (%) by Region 2020-2026       234

Figure 109 – Global OSINT in Homeland Security, Public Safety and Defense Market Share (%) by Region 2016-2022      236

Figure 110 – Global OSINT Market ($M) by Country 2020-2026      238

Figure 111 – Global OSINT in Homeland Security, Public Safety and Defense Market Share (%) by Country 2020-2026    241

Figure 112 – Global OSINT in Homeland Security, Public Safety and Defense Cumulative Market ($M) and Market Share (%) by Country 2016-2022             243

Figure 113 – USA OSINT Market Size ($M) 2020-2026        250

Figure 114 – USA OSINT Market Share (%) 2020-2026        251

Figure 115 – Canada OSINT Market Size ($M) 2020-2026  254

Figure 116 – Canada OSINT Market Share (%) 2020-2026  254

Figure 117 – UK OSINT Market Size ($M) 2020-2026          259

Figure 118 – UK OSINT Market Share (%) 2020-2026          259

Figure 119 – Strategische Initiative Technik Budget 2014 – 2020 (M€)        262

Figure 120 – Germany OSINT Market Size ($M) 2020-2026              264

Figure 121 – Germany OSINT Market Share (%) 2020-2026             264

Figure 122 – France OSINT Market Size ($M) 2020-2026   267

Figure 123 – France OSINT Market Share (%) 2020-2026   268

Figure 124 – Italy OSINT Market Size ($M) 2020-2026        271

Figure 125 – Italy OSINT Market Share (%) 2020-2026       272

Figure 126 – Spain OSINT Market Size ($M) 2020-2026      275

Figure 127 – Spain OSINT Market Share (%) 2020-2026     275

Figure 128 – Australia OSINT Market Size ($M) 2020-2026              280

Figure 129 – Australia OSINT Market Share (%) 2020-2026              280

Figure 130 – India OSINT Market Size ($M) 2020-2026      283

Figure 131 – India OSINT Market Share (%) 2020-2026      284

Figure 132 – China OSINT Market Size ($M) 2020-2026    287

Figure 133 – China OSINT Market Share (%) 2020-2026    287

Figure 134 – South Korea OSINT Market Size ($M) 2020-2026       289

Figure 135 – South Korea OSINT Market Share (%) 2020-2026       290

Figure 136 – Japan OSINT Market Size ($M) 2020-2026     292

Figure 137 – Japan OSINT Market Share (%) 2020-2026     292

Figure 138 – Brazil OSINT Market Size ($M) 2020-2026      295

Figure 139 – Brazil OSINT Market Share (%) 2020-2026     295

Figure 140 – Mexico OSINT Market Size ($M) 2020-2026  297

Figure 141 – Mexico OSINT Market Share (%) 2020-2026  298

Figure 142 – Colombia OSINT Market Size ($M) 2020-2026            300

Figure 143 – Colombia OSINT Market Share (%) 2020-2026             300

Figure 144 – GCC OSINT Market Size ($M) 2020-2026        304

Figure 145 – GCC OSINT Market Share (%) 2020-2026       304

Figure 146 – South Africa OSINT Market Size ($M) 2020-2026       307

Figure 147 – South Africa OSINT Market Share (%) 2020-2026       307

Figure 148 – Nigeria OSINT Market Size ($M) 2020-2021  309

Figure 149 – Nigeria OSINT Market Share (%) 2020-2026 310

Figure 150 – Kenya OSINT Market Size ($M) 2020-2026    312

Figure 151 – Kenya OSINT Market Share (%) 2020-2026   312

Figure 152 – OSINT Model – Examples of Tools and Capabilities     321

Figure 153 – Types of Building Blocks       354

Questions about this report?

Contact Sales: 1-571-527-1010 or Analysts: 1-202-455-0966

  • Have a question about OSINT Market & Technologies - 2020-2026
    Please fill out all fields in the form below and click "Submit" to send your question.
    Our representative will review your question and contact you with an answer as soon as possible.
  • 2+2=
  • This field is for validation purposes and should be left unchanged.
1
Interested in this report? Need more information?

You may also like…

X
Powered By