Top
HSRCPublic Safety & Homeland Security Technologies Market – 2019-2024
Global HLS & PS Technologies Market

Public Safety & Homeland Security Technologies Market - 2019-2024

Big Data & Artificial Intelligence and Video Analytics – Fastest Growing Technological Markets

  • March 2019
  • 423
  • 223
    • 4450 $
    • 5450 $
    • 6950 $
    • 10000 $

    Small Businesses, Startups & Academia - Up to 50% Off

Quantity
IBM
Amazon
Sandia National Lab
HITACHI
Thales
Smiths Detection
Nuctech
Korea Internet & Security Agency
L3Harris
Huawei
Leidos
NEC
Toshiba
Deloitte
MAG

Want to customize this report?

If you purchase this report, you are entitled to a 30% discount towards customizing it, to better fit your market research and strategic needs. Our Custom Research and Industry Insights Department will work with you to better understand your information gaps and strategic needs and will provide you with a tailor-made market research report within a short period of time.

Why Choose Us?

30+ Years of Experience
We are a multidisciplinary team of Transformational Technologies industry experts with over 30 years of experience.
Gold Standard
With over 950 private sector clients (73% repeat customers), including major defense and security vendors, and Forbes Global 2000 companies, HSRC earned the reputation as the industry’s Gold Standard for Transformational Technologies Market Reports.
Tailored Research Services
Provide you with clear, actionable recommendations designed to empower decision making and to help you exploit emerging opportunities in the Transformational Technologies industries.
Information Security
Your personal information is safe and secure.

From: $4,450

Description

The Homeland Security Technologies Market 2019-2024 Report contains thorough analysis of 24 technology markets ranging from metal detectors to electronic fencing to big data & artificial intelligence.

17 years have passed since 9/11, and the global Public Safety & Homeland Security Technologies market are forecast to go through major shifts. New and maturing technologies, such as artificial intelligence, big data & data analysis, smart sensors, AI-based cybersecurity, 5G, TETRA & LTE emergency communication and AI based video analytics, will create new market segments and fresh business opportunities.

During the 2019-2024 forecast period, legacy and dominating technologies, such as C2/C4ISR and intrusion detection systems will be replaced by more advanced technological solutions such as cybersecurity, big data analytics & artificial intelligence, and video analytics.

Technology Homeland Security & Public Safety Markets Ranked by 2018-2024 CAGR [%]

Technology Homeland Security & Public Safety Markets Ranked by 2018-2024 CAGR [%]

Technology Homeland Security & Public Safety Markets Ranked by 2019-2024 Cumulative Market [$B]


Market growth is driven by the following factors:

  • Terror
  • New and maturing technologies, (e.g., UGV, counter-drone systems, artificial intelligence, big data & data analysis, smart sensors, AI-based cybersecurity, 5G, TETRA & LTE emergency communication and AI based video analytics)
  • President Trump’s national security & law enforcement agenda
  • Organized crime
  • PRC President Xi’s internal security policy
  • Cybercrime and Cyberterrorism
  • The turmoil in the Arab world – the ongoing conflicts in Iraq, Syria and Yemen, and the Shia-Sunni conflict
  • An “invest whatever it takes” approach of autocratic and semi-autocratic governments (e.g., Saudi-Arabia, Iran, Egypt, Russia, Turkey) to avoid regime change
  • High security spending by governments (e.g., Israel, Brazil, Nigeria) exposed to high risk of terror and/or crime
  • Climate warming-related natural disasters growth

Why Buy this Report?

A. Questions answered in the 24 market reports include:

  • What is the market size and trends of 24 technological markets during 2017-2024?
  • What are the technological submarkets that provide attractive business opportunities?
  • Who are the decision-makers?
  • What drives the customers to purchase security solutions and services?
  • What are the customers looking for?
  • What are the internal security technology & services trends?
  • What are the 24 technological markets SWOTs (Strengths, Weaknesses, Opportunities and Threats)?
  • What are the challenges to market penetration & growth?

B. The Global Homeland Security & Public Safety Market size data is analyzed via 24 technologies, 43 national markets and 5 regional markets.

  • By 24 Technology Market Reports Summaries:
  1. Automatic Border Control (ABC)
  2. Big Data for HLS and public safety
  3. Bio-Agents & Infectious Disease Mitigation
  4. Biometrics
  5. Border & Perimeter Barriers
  6. C2/C4ISR Systems
  7. Chemical, Hazmat & Nuclear Detection
  8. Counter-IED Technologies
  9. Cybersecurity
  10. Decontamination of CBRN & Hazmat Incidents
  11. Electronic Fencing
  12. Emergency Communication
  1. Explosives Trace Detection (ETD)
  2. Information Technologies (w/o Intel & Cyber)
  3. Intelligence Services IT
  4. Intrusion Detection Systems
  5. Metal Detectors
  6. Non-Lethal Weapons
  7. Personal (Ballistic & CBRNE) Protective Gear
  8. Standoff Explosives & Weapon Detection
  9. Tomographic Explosive Detection Systems & BHS
  10. Video Analytics
  11. Video Surveillance (w/o Analytics)
  12. X-Ray Screening
  • By 43 National Markets:
  1. U.S.
  2. Canada
  3. Mexico
  4. Colombia
  5. Brazil
  6. Argentina
  7. Rest of LATAM
  8. UK
  9. France
  10. Netherlands
  11. Belgium
  12. Sweden
  13. Denmark
  14. Germany
  15. Austria
  16. Italy
  17. Spain
  18. Poland
  19. Czech Republic
  20. Russia
  21. Rest of Europe
  22. Turkey
  1. Israel
  2. Saudi Arabia
  3. UAE
  4. Qatar
  5. Kuwait
  6. Nigeria
  7. South Africa
  8. Rest of MEA
  9. India
  10. China
  11. South Korea
  12. Japan
  13. Australia
  14. Azerbaijan
  15. Kazakhstan
  16. Pakistan
  17. Taiwan
  18. Singapore
  19. Malaysia
  20. Indonesia
  21. Rest of Asia Pacific=
  • By 5 Regional Market Reports Summaries
  1. North America
  2. Latin America
  3. Europe
  4. Middle East & Africa
  5. Asia Pacific
 

C. Detailed market analysis frameworks for each of the market sectors are provided, including:

  1. Market drivers & inhibitors
  2. Business opportunities
  3. SWOT analysis
  4. Competitive analysis
  5. Business environment
  6. The 2017-2024 market
 

D. The Homeland Market report includes the following 5 appendices:

  1. Appendix A: National Homeland Security & Public Safety Market Background for 43 countries
  2. Appendix B: Emerging Threats Facing the EU & USA
  3. Appendix C: Homeland Security & Public Safety Industry
  4. Appendix D: Homeland Security & Public Safety Related Products Standards
  5. Appendix E: Abbreviations
 

E. The Market Analysis addresses over 320 global homeland security and public safety standards (including links).

F. The report provides updated extensive data of 118 leading homeland security and public safety vendors (including companies’ profile, recent annual revenues, key executives, homeland security and public safety products, and contact info.):

  1. 3M
  2. 3i-MIND
  3. 3VR
  4. 3xLOGIC
  5. ABB
  6. Accenture
  7. ACTi Corporation
  8. ADT Security Services
  9. AeroVironment Inc.
  10. Agent Video Intelligence
  11. Airbus Defence and Space
  12. Alcatel-Lucent (Nokia Group)
  13. ALPHAOPEN
  14. Anixter
  15. Aralia Systems
  16. AT&T Inc.
  17. Augusta Systems
  18. Austal
  19. Avigilon Corporation
  20. Aware
  21. Axis
  22. AxxonSoft
  23. Ayonix
  24. BAE Systems
  25. BioEnable Technologies Pvt Ltd
  26. BioLink Solutions
  27. Boeing
  28. Bollinger Shipyards, Inc
  29. Bosch Security Systems
  30. Bruker Corporation
  31. BT
  32. Camero
  33. Cassidian
  34. CelPlan
  35. China Security & Surveillance, Inc.
  36. Cisco Systems
  37. Citilog
  38. Cognitec Systems GmbH
  39. Computer Network Limited (CNL)
  40. Computer Sciences Corporation
  41. CrossMatch
  42. Diebold
  43. DRS Technologies Inc.
  44. DVTel
  45. Elbit Systems Ltd.
  46. Elsag Datamat
  47. Emerson Electric
  48. Ericsson
  49. ESRI
  50. FaceFirst
  51. Finmeccanica SpA
  52. Firetide
  53. Fulcrum Biometrics LLC
  54. G4S
  55. General Atomics Aeronautical Systems Inc.
  56. General Dynamics Corporation
  57. Getac Technology Corporation
  58. Hanwha Techwin
  59. Harris Corporation
  1. Hewlett Packard Enterprise
  2. Hexagon AB
  3. Honeywell International Inc.
  4. Huawei Technologies Co., Ltd
  5. IBM
  6. IndigoVision
  7. Intel Security
  8. IntuVision Inc
  9. iOmniscient
  10. IPConfigure
  11. IPS Intelligent Video Analytics
  12. Iris ID Systems, Inc.
  13. IriTech Inc.
  14. Israel Aerospace Industries Ltd.
  15. ISS
  16. L-3 Security & Detection Systems
  17. Leidos, Inc.
  18. Lockheed Martin Corporation
  19. MACROSCOP
  20. MDS
  21. Mer group
  22. Milestone Systems A/S
  23. Mirasys
  24. Motorola Solutions, Inc.
  25. National Instruments
  26. NEC Corporation
  27. NICE Systems
  28. Northrop Grumman Corporation
  29. Nuance Communications, Inc.
  30. ObjectVideo
  31. Panasonic Corporation
  32. Pelco
  33. Pivot3
  34. Proximex
  35. QinetiQ Limited
  36. Rapiscan Systems, Inc.
  37. Raytheon
  38. Rockwell Collins, Inc.
  39. Safran S.A.
  40. Salient Sciences
  41. Schneider Electric
  42. SeeTec
  43. Siemens
  44. Smart China (Holdings) Limited
  45. Smiths Detection Inc.
  46. Sony Corp.
  47. Speech Technology Center
  48. Suprema Inc.
  49. Synectics Plc
  50. Tandu Technologies & Security Systems Ltd
  51. Texas Instruments
  52. Textron Inc.
  53. Thales Group
  54. Total Recall
  55. Unisys Corporation
  56. Verint
  57. Vialogy LLC
  58. Vigilant Technology
  59. Zhejiang Dahua Technology

Table of Contents

Download TOC as PDF

TECHNOLOGY MARKETS.. 23

1         Global Homeland Security & Public Safety Technology Markets. 23

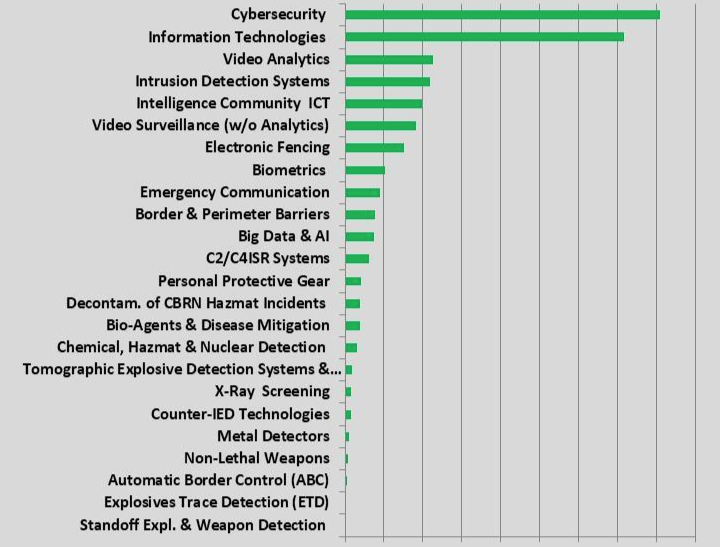
1.1        Market by Technology: Summary. 23

1.2        Market by Technology: Data & Trends Analysis. 26

2         Automatic Border Control (ABC) Market 33

2.1        Automatic Border Control (ABC, eGate) Technologies and Market Background  33

2.2        The European Automated Border Control: ABC4EU.. 39

2.3        ABC Artificial Intelligence. 41

2.4        Biometric Automatic Border Control (ABC) Advantages. 41

2.5        Automated Border Control Technologies. 42

2.5.1             Airport Automated Border Control (eGate) 44

2.5.2             Function of Automated Border Control 46

2.6        Automated Border Control Systems Standards. 47

2.7        Automated Border Control Legislation.. 48

2.8        Automated Border Control: Market Drivers. 49

2.9        Automated Border Control Market Inhibitors. 50

2.10     Automated Border Control Market: SWOT Analysis. 51

2.11     Automated Border Control: Market Barriers to New Entry, Supplier Power, Buyer Power, Barriers to Substitution and Competitive Rivalry. 52

2.12     Global Automatic Border Control (ABC) Market – 2017-2024. 53

2.12.1          Automatic Border Control (ABC) Market – 2017-2024. 53

2.12.2          Market Dynamics – 2017-2024. 54

2.12.3          Market Breakdown – 2017-2024. 55

3         Homeland Security & Public Safety, Big Data & Artificial Intelligence Market 56

3.1        Market & Technology Background. 56

3.2        Data Centric Access Control 58

3.2.1             Access Control 58

3.2.2             Access Control in Databases. 58

3.2.3             Encryption Prescribed Access Control 59

3.2.4             Trusted Bootstrapping. 59

3.2.5             Big Data & Data Analytics. 59

3.3        Artificial Intelligence. 60

3.3.1             Big Data, Artificial Intelligence & Data Analytics: HLS and Internal Security Applications. 62

3.4        Big Data Based Urban Surveillance. 63

3.5        Artificial Intelligence Based Machine Learning. 64

3.6        Artificial Intelligence in Cybersecurity. 65

3.7        Artificial Intelligence in Law Enforcement 66

3.8        Big Data, Artificial Intelligence& Data Analytics Industry: SWOT Analysis  67

3.8.1             Strengths. 67

3.8.2             Weaknesses. 67

3.8.3             Opportunities. 67

3.8.4             Threats. 68

3.9        Big Data, Artificial Intelligence & Data Analytics Market Drivers. 68

3.10     Big Data, Artificial Intelligence & Data Analytics Market Inhibitors. 69

3.11     Global Homeland Security & Public Safety related Big Data & Artificial Intelligence Market – 2017-2024. 70

3.11.1          Big Data & Artificial Intelligence Market – 2017-2024. 70

3.11.2          Big Data & Artificial Intelligence Market Dynamics – 2017-2024. 71

3.11.3          Market Breakdown – 2017-2024. 72

4         Bio-Agents & Infectious Disease Mitigation Market 73

4.1        Market Background. 73

4.2        Bio-Detection Technologies. 75

4.2.1             Sampling the Environment 75

4.2.2             Bio-Detectors in a Multitude of Ambient Settings. 76

4.2.3             Bio-Detection Triggering. 76

4.2.4             Sample Collection.. 76

4.2.5             Bio-Particle Detectors. 77

4.2.6             Bio-Agent Identification.. 77

4.3        Links to Bio-Detection Technologies, Products & Applications. 78

4.3.1             National Biosurveillance Systems. 79

4.4        Bio-Agents & Infectious Disease Detection: Homeland Security & Public Safety Applications. 81

4.5        Bio-Agents & Infectious Disease Detection: Business Opportunities & Challenges. 87

4.6        Bio-Agents & Infectious Disease Detection Industry: SWOT Analysis. 88

4.6.1             Strengths. 88

4.6.2             Weaknesses. 89

4.6.3             Opportunities. 90

4.6.4             Threats. 90

4.7        Bio-Agents & Infectious Disease Detection Market Drivers. 91

4.8        Bio-Agents & Infectious Disease Detection Market Inhibitors. 92

4.9        Global Bio-Agents & Infectious Disease Mitigation Market – 2017-2024  93

4.9.1             Bio-Agents & Infectious Disease Mitigation Market – 2017-2024. 93

4.9.2             Market Dynamics – 2017-2024. 95

4.9.3             Market Breakdown – 2017-2024. 96

5         Biometrics Homeland Security & Public Safety Market 97

5.1        Global Biometrics Market Background. 97

5.2        Multimodal Biometric Systems. 100

5.3        Biometrics: Homeland Security & Public Safety Applications. 100

5.3.1             Overview.. 100

5.3.2             Multi-biometrics for Border Control 102

5.3.3             Biometrics for Banking. 103

5.3.4             Biometrics for Digital Security. 104

5.4        Biometrics: Business Opportunities & Challenges. 106

5.5        Biometrics Industry: SWOT Analysis. 107

5.5.1             Strengths. 107

5.5.2             Weaknesses. 108

5.5.3             Opportunities. 108

5.5.4             Threats. 108

5.6        Biometrics Market Drivers. 110

5.7        Biometrics Market Inhibitors. 112

5.8        Global Biometrics Homeland Security & Public Safety Market – 2017-2024  113

5.8.1             Biometrics Market – 2017-2024. 113

5.8.2             Market Dynamics – 2017-2024. 114

5.8.3             Market Breakdown – 2017-2024. 115

6         Border & Perimeter Barriers Market 116

6.1        Major Findings and Conclusions. 116

6.2        Global Border & Perimeter Barriers Market Background. 116

6.3        The Mexico–United States “Wall” 117

6.4        Border & Perimeter Barriers: Market Drivers. 118

6.5        Border & Perimeter Barriers Market Inhibitors. 119

6.6        Border & Perimeter Barriers Market: SWOT Analysis. 121

6.7        Border & Perimeter Barriers Market Barriers to New Entry, Supplier Power, Buyer Power, Barriers to Substitution and Competitive Rivalry. 122

6.8        Global Border & Perimeter Security Barriers Market – 2017-2024. 123

6.8.1             Border & Perimeter Barriers Market – 2017-2024. 123

6.8.2             Market Dynamics – 2017-2024. 124

6.8.3             Market Breakdown – 2017-2024. 125

7         Homeland Security & Public Safety C2/C4ISR Systems Market 126

7.1        Scope. 126

7.2        Market & Technology Background. 127

7.3        HLS & PS C2/C4ISR Systems: Business Opportunities. 133

7.4        C2/C4ISR Industry SWOT Analysis. 133

7.4.1             Strengths. 133

7.4.2             Weaknesses. 134

7.4.3             Opportunities. 135

7.4.4             Threats. 135

7.5        C2/C4ISR Market Drivers. 136

7.6        C2/C4ISR Market Inhibitors. 137

7.7        Global Homeland Security & Public Safety C2/C4ISR Systems Market – 2017-2024. 138

7.7.1             C2/C4ISR Systems Market – 2017-2024. 138

7.7.2             Market Dynamics – 2017-2024. 139

7.7.3             Market Breakdown – 2017-2024. 140

8         Chemical, Hazmat & Nuclear Detection Market 141

8.1        Scope. 141

8.2        Chemical Agent Detection Technologies. 141

8.3        Nuclear/Radiological Detection Technologies. 142

8.3.1             The Advanced Spectroscopic Portal (ASP) 142

8.3.2             Human Portable Radiation Detection Systems (HPRDS) Program   142

8.3.3             Nuclear- Radiological People Screening Portals. 142

8.4        Market Background. 143

8.4.1             Chemical Plant Security. 143

8.4.2             Nuclear/Radiological Detection Markets. 143

8.5        Chemical, Hazmat & Nuclear Detection: Business Opportunities & Challenges  148

8.6        Chemical, Hazmat & Nuclear Detection Industry: SWOT Analysis. 149

8.6.1             Strengths. 149

8.6.2             Weaknesses. 150

8.6.3             Opportunities. 150

8.6.4             Threats. 151

8.7        Chemical, Hazmat & Nuclear Detection Market Drivers. 151

8.8        Chemical, Hazmat & Nuclear Detection Market Inhibitors. 153

8.9        Global Chemical, Hazmat & Nuclear Detection Market – 2017-2024. 155

8.9.1             Chemical, Hazmat & Nuclear Detection Market – 2017-2024. 155

8.9.2             Chemical, Hazmat & Nuclear Detection Market Dynamics – 2017-2024  156

8.9.3             Market Breakdown – 2017-2024. 157

9         Counter-IED Technologies Market 158

9.1        Market & Technology Background. 158

9.2        Counter-IED Technologies: Business Opportunities & Challenges. 162

9.2.1             Maintenance and Upgrades (Particularly of Jammers & Armored Trucks) 162

9.2.2             Sensors and Other Electronic Systems Upgrade. 163

9.2.3             Standoff Suicide Bombers Detection.. 163

9.2.4             Suicide Bombers Detonation Neutralization. 163

9.2.5             Standoff Detection of VBIED.. 163

9.2.6             VBIED Detonation Neutralization.. 164

9.2.7             Standoff Explosive Detection in Urban Environment 164

9.2.8             Large Area IED Detection Coverage. 164

9.2.9             IED Placement Detection.. 165

9.2.10          Active Armors for Vehicles. 165

9.3        Counter-IED Technologies Industry: SWOT Analysis. 165

9.3.1             Strengths. 165

9.3.2             Weaknesses. 166

9.3.3             Opportunities. 166

9.3.4             Threats. 167

9.4        Market Drivers. 167

9.5        Market Inhibitors. 168

9.6        Global Counter-IED Technologies Market – 2017-2024. 168

9.6.1             Counter-IED Technologies Market – 2017-2024. 168

9.6.2             Market Dynamics – 2017-2024. 170

9.6.3             Market Breakdown – 2017-2024. 170

10      Cybersecurity Market 172

10.1     Cybersecurity Market & Technology Background. 172

10.1.1          Cyber Terror & Crime. 172

10.1.2          Cyber Warfare. 174

10.1.3          Denial of Service. 175

10.1.4          Deliberate Manipulation of Information.. 175

10.1.5          Detection of Unauthorized Activity. 176

10.1.6          Anti-Malware Cyber-Security. 177

10.1.7          Privacy Enhanced Technologies (PETs) 178

10.2     Key Cyber Security Vendors. 179

10.3     Cybersecurity Industry: SWOT Analysis. 180

10.3.1          Strengths. 180

10.3.2          Weaknesses. 181

10.3.3          Opportunities. 181

10.3.4          Threats. 182

10.4     Cybersecurity Market Drivers. 183

10.5     Cybersecurity Market Inhibitors. 185

10.6     Global Cybersecurity Market – 2017-2024. 186

10.6.1          Cybersecurity Market – 2017-2024. 186

10.6.2          Market Dynamics – 2017-2024. 187

10.6.3          Market Breakdown – 2017-2024. 188

11      Decontamination of CBRN & Hazmat Incidents Market 189

11.1     Decontamination Technologies Background. 189

11.1.1          Overview.. 189

11.1.2          Decontamination Core Technologies. 191

11.1.3          The Decontamination Cycle. 191

11.2     Decontamination Strategy. 193

11.3     CBRN & Hazmat Decontamination Market Background. 194

11.4     The Decontamination Industry. 196

11.5     Decontamination of CBRN & Hazmat Incidents Market Drivers. 196

11.6     Decontamination of CBRN & Hazmat Incidents Market Inhibitors. 197

11.7     Global Decontamination of CBRN & Hazmat Incidents Market – 2017-2024  199

11.7.1          Decontamination of CBRN & Hazmat Incidents Market – 2017-2024  199

11.7.2          Market Dynamics – 2017-2024. 200

11.7.3          Market Breakdown – 2017-2024. 201

12      Electronic Fencing Homeland Security & Public Safety Market 202

12.1     Electronic Fences Technologies. 202

12.1.1          Vibration Sensors Mounted on Fence. 202

12.1.2          Capacitance Sensors Fence. 204

12.1.3          Strain Sensitive Cables Fence. 204

12.1.4          Fiber Optic Fence. 204

12.1.5          Taut Wire Fence. 204

12.1.6          Ported Coax Buried Line Fence. 205

12.1.7          Buried Geophone Fence. 206

12.2     Electronic Fencing: Business Opportunities & Challenges. 208

12.3     Electronic Fencing Industry: SWOT Analysis. 209

12.3.1          Strengths. 209

12.3.2          Weaknesses. 209

12.3.3          Opportunities. 210

12.3.4          Threats. 210

12.4     Electronic Fencing Market Drivers. 211

12.5     Electronic Fencing Market Inhibitors. 212

12.6     Global Electronic Fencing Market – 2017-2024. 212

12.6.1          Electronic Fencing Market – 2017-2024. 212

12.6.2          Market Dynamics – 2017-2024. 214

12.6.3          Market Breakdown – 2017-2024. 215

13      Emergency Communication Market 216

13.1     Market & Technology Background. 216

13.2     Emergency Communication: Technology Background. 221

13.2.1          Tetra. 221

13.2.2          LTE.. 230

13.2.3          5G Emergency Communication.. 232

13.3     Emergency Communication Market: Business Opportunities. 233

13.3.1          Managed Services for Shared/Core Services. 233

13.3.2          Migration from “Simple” to “Integrated” Networks. 233

13.3.3          Emergency Communication Market Prospects. 234

13.4     Emergency Communication Market Drivers. 235

13.5     Emergency Communication Market Inhibitors. 236

13.6     Global Emergency Communication Market – 2017-2024. 236

13.6.1          Emergency Communication Market – 2017-2024. 236

13.6.2          Market Dynamics – 2017-2024. 238

13.6.3          Market Breakdown – 2017-2024. 239

14      Explosives Trace Detection (ETD) Market 240

14.1     Market & Technology Background. 240

14.1.1          ETD Technologies. 240

14.1.2          ETD Market Background. 241

14.2     Explosives Trace Detection (ETD): HLS & PS Applications. 244

14.2.1          Explosives Detected by Explosives Trace Detection.. 244

14.2.2          Explosives Trace Detection Configuration. 246

14.2.3          ETD Applications. 246

14.3     Explosives Trace Detection (ETD): Business Opportunities & Challenges  248

14.4     Explosives Trace Detection (ETD) Industry: SWOT Analysis. 249

14.4.1          Strengths. 249

14.4.2          Weaknesses. 249

14.4.3          Opportunities. 250

14.4.4          Threats. 251

14.5     Explosives Trace Detection (ETD) Market Drivers. 251

14.6     Explosives Trace Detection (ETD) Market Inhibitors. 252

14.7     Global Explosives Trace Detection (ETD) Market – 2017-2024. 253

14.7.1          Explosives Trace Detection (ETD) Market – 2017-2024. 253

14.7.2          Market Dynamics – 2017-2024. 254

14.7.3          Market Breakdown – 2017-2024. 255

15      Homeland Security & Public Safety Information Technologies (w/o Intel & Cyber) Market 256

15.1     Scope. 256

15.2     Major Findings and Conclusions. 256

15.3     Market Background. 257

15.3.1          Homeland Security & Public Safety: Data Center Systems. 257

15.3.1.1       Overview.. 257

15.3.1.2       Counter Terror and Public Safety: Data Center Services. 258

15.3.1.3       Counter Terror and Public Safety: Support Services. 258

15.3.1.4       Counter Terror and Public Safety: Technical Consulting Services  258

15.3.1.5       Outsourcing Services. 259

15.3.1.6       Application Services. 259

15.3.2          Homeland Security and Public Safety: Enterprise Software. 259

15.3.3          Homeland Security and Public Safety: IT Services. 260

15.3.4          Homeland Security and Public Safety Agencies: Cloud Storage & Computing. 261

15.4     Market Drivers. 262

15.5     Market Inhibitors. 263

15.6     Global Information Technologies (w/o Intel & Cyber) Homeland Security & Public Safety Market – 2017-2024. 264

15.6.1          Information Technologies (w/o Intel & Cyber) Market – 2017-2024  264

15.6.2          Market Dynamics – 2017-2024. 265

15.6.3          Market Breakdown – 2017-2024. 266

16      Intelligence Community ICT Market 267

16.1     Intelligence Services Information Technologies & Market Background. 267

16.1.1          Geospatial Intelligence (GEOINT) Information Technology. 267

16.1.2          Imagery Intelligence (IMINT) Information Technology. 267

16.1.3          Measurement and Signature Intelligence (MASINT) Information Technology. 267

16.1.4          Open-Source Intelligence (OSINT) Information Technology. 268

16.1.5          Signals Intelligence (SIGINT) Information Technology. 269

16.1.5.1       Communications Intelligence COMINT Information Technology  269

16.1.5.2       ELINT Electronic Intelligence Information Technology. 270

16.1.6          Foreign Instrumentation Signals Intelligence (FISINT) Information Technology. 271

16.1.7          Financial Intelligence (FININT) Information Technology. 271

16.1.8          Cryptanalysis Information Technology. 272

16.1.9          Traffic Analysis. 272

16.2     Global Intelligence Community ICT Market – 2017-2024. 273

16.2.1          Intelligence Community ICT Market – 2017-2024. 273

16.2.2          Market Dynamics – 2017-2024. 274

16.2.3          Market Breakdown – 2017-2024. 275

17      Intrusion Detection Systems Homeland Security & Public Safety Market 276

17.1     Market & Technology Background. 276

17.1.1          Passive Infrared (PIR) Motion Detection.. 276

17.1.2          Access Control Systems. 279

17.2     Intrusion Detection Systems: Business Opportunities & Challenges. 279

17.2.1          Challenges. 279

17.2.2          Business Opportunities. 280

17.3     Intrusion Detection Systems Industry: SWOT Analysis. 281

17.3.1          Strengths. 281

17.3.2          Weaknesses. 281

17.3.3          Opportunities. 281

17.3.4          Threats. 282

17.4     Intrusion Detection Systems Market Drivers. 283

17.5     Intrusion Detection Systems Market Inhibitors. 283

17.6     Global Intrusion Detection Systems Homeland Security & Public Safety Market – 2017-2024. 284

17.6.1          Intrusion Detection Systems Market – 2017-2024. 284

17.6.2          Market Dynamics – 2017-2024. 285

17.6.3          Market Breakdown – 2017-2024. 286

18      Metal Detectors Market 287

18.1     Market & Technology Background. 287

18.1.1          Hand-Held Metal Detectors. 287

18.1.1.1       The Market 287

18.1.1.2       Principles of Operation.. 287

18.1.1.3       Technology & Operational Essentials. 288

18.1.1.4       Hand-Held Metal Detectors – Technology Trends. 288

18.1.2          Metal Detection Portals. 289

18.1.2.1       The Market 289

18.1.2.2       Metal Detection Portals Technology. 290

18.2     Metal Detectors: Business Opportunities & Challenges. 292

18.3     Metal Detectors Industry: SWOT Analysis. 293

18.3.1          Strengths. 293

18.3.2          Weaknesses. 293

18.3.3          Opportunities. 293

18.3.4          Threats. 294

18.4     Metal Detectors Market Drivers. 294

18.5     Metal Detectors Market Inhibitors. 295

18.6     Global Metal Detectors Market – 2017-2024. 296

18.6.1          Metal Detectors Market – 2017-2024. 296

18.6.2          Market Dynamics – 2017-2024. 297

18.6.3          Market Breakdown – 2017-2024. 298

19      Non-Lethal Weapons Market 299

19.1     Non-Lethal Weapons Technology Background. 299

19.2     Less-Lethal Weapons: Market Background. 303

19.3     Non-Lethal Weapons: Business Opportunities & Challenges. 306

19.4     Non-Lethal Weapons Industry: SWOT Analysis. 306

19.4.1          Strengths. 306

19.4.2          Weaknesses. 308

19.4.3          Opportunities. 309

19.4.4          Threats. 309

19.5     Non-Lethal Weapons Market Drivers. 311

19.6     Non-Lethal Weapons Market Inhibitors. 312

19.7     Global Non-Lethal Weapons Market – 2017-2024. 314

19.7.1          Non-Lethal Weapons Market – 2017-2024. 314

19.7.2          Market Dynamics – 2017-2024. 315

19.7.3          Market Breakdown – 2017-2024. 316

20      Personal (Ballistic & CBRNE) Protective Gear Market 317

20.1     Market & Technology Background. 317

20.1.1          Personal Body Armor 317

20.1.2          Respiratory Protective Equipment 319

20.1.3          CBRN and Hazmat Personal Protective Gear 321

20.2     Personal (Ballistic & CBRNE) Protective Gear Industry: SWOT Analysis  324

20.2.1          Strengths. 324

20.2.2          Weaknesses. 324

20.2.3          Opportunities. 325

20.2.4          Threats. 325

20.3     Personal (Ballistic & CBRNE) Protective Gear Market Drivers. 326

20.4     Personal (Ballistic & CBRNE) Protective Gear Market Inhibitors. 327

20.5     Global Personal (Ballistic & CBRNE) Protective Gear Market – 2017-2024  328

20.5.1          Personal (Ballistic & CBRNE) Protective Gear Market – 2017-2024  328

20.5.2          Market Dynamics – 2017-2024. 329

20.5.3          Market Breakdown – 2017-2024. 330

21      Standoff Explosives & Weapons Detection Market 331

21.1     Market & Technology Background. 331

21.2     Standoff Explosives & Weapons Detection: Business Opportunities & Challenges. 340

21.3     Standoff Person-Borne and Vehicle-Borne Explosives & Weapons Detection Industry: SWOT Analysis. 341

21.4     Standoff Explosives & Weapons Detection: Market Drivers. 343

21.5     Standoff Explosives & Weapons Detection: Market Inhibitors. 344

21.6     Global Standoff Explosives & Weapons Detection Market – 2017-2024  345

21.6.1          Standoff Explosives & Weapons Detection Market – 2017-2024. 345

21.6.2          Market Dynamics – 2017-2024. 346

21.6.3          Market Breakdown – 2017-2024. 347

22      Tomographic Explosive Detection Systems & BHS Market 348

22.1     Explosive Detection Systems: Technology Background. 348

22.1.1          Pros & Cons of Bulk Threat Detection Systems. 348

22.1.2          Explosive Detection Systems: Throughput 348

22.1.3          EDS Principle of Operation.. 349

22.1.4          Hybrid Tomographic EDS & 2D X-Ray Screening. 350

22.1.5          EDS Certification.. 350

22.1.6          EDS Throughput vs. Price. 351

22.1.7          Aviation Security: EDS Checked Luggage Screening. 351

22.2     Aviation Security: EDS Market Background. 355

22.3     Explosive Detection Systems (EDS) Industry: SWOT Analysis. 356

22.3.1          Strengths. 356

22.3.2          Weaknesses. 356

22.3.3          Opportunities. 357

22.3.4          Threats. 358

22.4     EDS & BHS Market Drivers. 359

22.5     EDS & BHS Market Inhibitors. 360

22.6     Global Tomographic Explosive Detection Systems & BHS Market – 2017-2024  361

22.6.1          Tomographic Explosive Detection Systems & BHS Market – 2017-2024  361

22.6.2          Market Dynamics – 2017-2024. 362

22.6.3          Market Breakdown – 2017-2024. 363

23      Video Analytics Homeland Security & Public Safety Market 364

23.1     Market & Technology Background. 364

23.2     Video Analytics: HLS & PS Applications. 368

23.3     Video Analytics: Business Opportunities. 370

23.4     Video Analytics Industry: SWOT Analysis. 372

23.4.1          Strengths. 372

23.4.2          Weaknesses. 373

23.4.3          Opportunities. 374

23.4.4          Threats. 375

23.4.5          Video Analytics Market Drivers. 377

23.4.6          Video Analytics Market Inhibitors. 381

23.5     Global Video Analytics Homeland Security & Public Safety Market – 2017-2024. 382

23.5.1          Video Analytics Market – 2017-2024. 382

23.5.2          Market Dynamics – 2017-2024. 383

23.5.3          Market Breakdown – 2017-2024. 384

24      Video Security Surveillance (w/o Analytics) Market 385

24.1     Market & Technology Background. 385

24.2     Video Surveillance: HLS & PS Applications. 392

24.3     Video Surveillance: Business Opportunities & Challenges. 394

24.4     Video Surveillance Industry: SWOT Analysis. 395

24.4.1          Strengths. 395

24.4.2          Weaknesses. 396

24.4.3          Opportunities. 396

24.4.4          Threats. 397

24.5     Video Surveillance Market Drivers. 397

24.6     Video Surveillance Market Inhibitors. 398

24.7     Global Video Security Surveillance (w/o Analytics) Market – 2017-2024  399

24.7.1          Video Surveillance (w/o Analytics) Market – 2017-2024. 399

24.7.2          Market Dynamics – 2017-2024. 400

24.7.3          Market Breakdown – 2017-2024. 401

25      X-Ray Security Screening Market 402

25.1     Major Findings. 402

25.2     Major Conclusions. 404

25.3     Market Dynamics & Opportunities. 405

25.4     X-ray Screening Systems: Market Drivers. 406

25.5     X-ray Screening Systems: Market Inhibitors. 407

25.6     X-ray Security Industry: Business Opportunities & Challenges. 408

25.7     X-ray Screening Systems Industry: SWOT Analysis. 409

25.7.1          Strengths. 409

25.7.2          Weaknesses. 410

25.7.3          Opportunities. 410

25.7.4          Threats. 411

25.8     Barriers to Entry, Supplier Power, Buyer Power & Barriers to Substitution   412

25.9     X-ray Security Screening Systems Technologies. 413

25.9.1          X-ray Systems – Characteristics. 413

25.9.2          X-ray Screening Systems – Principles of Operation.. 414

25.9.3          Innocuous Materials Interference. 415

25.9.4          Threat Image Projection (TIP) 416

25.9.5          Automated Target Detection.. 416

25.10  Current X-ray Baggage, Cargo, People, Container & Vehicle Screening Technologies. 417

25.10.1       Major Technologies. 417

25.10.2       2D X-ray, EDS and ETD Technologies – Pros and Cons. 418

25.11  Global X-Ray Security Screening Market – 2017-2024. 419

25.11.1       X-Ray Screening Market – 2017-2024. 419

25.11.2       Market Dynamics – 2017-2024. 420

25.11.3       Market Breakdown – 2017-2024. 421

Tables

Table 1 – Global Homeland Security & Public Safety Technology Markets [$M] – 2017-2024  24

Table 2 – Automated Border Control Market: SWOT Analysis. 51

Table 3 – Automated Border Control Market – Barriers to New Entry, Supplier Power, Buyer Power, Barriers to Substitution and Competitive Rivalry. 52

Table 4 – Global Automatic Border Control (ABC) Market Size [$M] by Region – 2017-2024  53

Table 5 – Global Automatic Border Control (ABC) Market AGRs [%] by Region – 2017-2024  54

Table 6 – Global Homeland Security & Public Safety, Big Data & Artificial Intelligence Market Size [$M] by Region – 2017-2024. 70

Table 7 – Global Homeland Security & Public Safety, Big Data & Artificial Intelligence Market AGRs [%] by Region – 2017-2024. 71

Table 8 – U.S. Bio-Response Status Evaluation.. 86

Table 9 – Bio-Agents & Infectious Disease Detection Market: Business Opportunities  87

Table 10 – Global Bio-Agents & Infectious Disease Mitigation Market Size [$M] by Region – 2017-2024. 94

Table 11 – Global Bio-Agents & Infectious Disease Mitigation Market AGRs [%] by Region – 2017-2024. 95

Table 12 – Biometrics Market: Business Opportunities. 106

Table 13 – Global Biometrics Homeland Security & Public Safety Market Size [$M] by Region – 2017-2024. 113

Table 14 – Global Biometrics Homeland Security & Public Safety Market AGRs [%] by Region – 2017-2024. 114

Table 15 – Border & Perimeter Barriers Market: SWOT Analysis. 121

Table 16 – Border & Perimeter Barriers Market – Barriers to New Entry, Supplier Power, Buyer Power, Barriers to Substitution and Competitive Rivalry. 122

Table 17 – Global Border & Perimeter Security Barriers Market [$M] by Region – 2017-2024  123

Table 18 – Global Border & Perimeter Security Barriers Market AGRs [%] by Region – 2017-2024. 124

Table 19 – HLS & PS C3I Business Opportunities. 133

Table 20 – Global Homeland Security & Public Safety C2/C4ISR Systems Market Size [$M] by Region – 2017-2024. 138

Table 21 – Global Homeland Security & Public Safety C2/C4ISR Systems Market AGRs [%] by Region – 2017-2024. 139

Table 22 – Nuclear Figure Terror Detection Roadmap. 142

Table 23 – Global Chemical, Hazmat & Nuclear Detection Market Size [$M] by Region – 2017-2024. 155

Table 24 – Global Chemical, Hazmat & Nuclear Detection Market AGRs [%] by Region – 2017-2024. 156

Table 25 – Global Counter-IED Technologies Market Size [$M] by Region – 2017-2024  169

Table 26 – Global Counter-IED Technologies Market AGRs [%] by Region – 2017-2024  170

Table 27 – Global Cybersecurity Market Size [$M] by Region – 2017-2024. 186

Table 28 – Global Cybersecurity Market AGRs [%] by Region – 2017-2024. 187

Table 29 – Global Decontamination of CBRN & Hazmat Incidents Market Size [$M] by Region – 2017-2024. 199

Table 30 – Global Decontamination of CBRN & Hazmat Incidents Market AGRs [%] by Region – 2017-2024. 200

Table 31 – Electronic Fencing Market: Business Opportunities. 208

Table 32 – Global Electronic Fencing Homeland Security & Public Safety Market Size [$M] by Region – 2017-2024. 213

Table 33 – Global Electronic Fencing Homeland Security & Public Safety Market AGRs [%] by Region – 2017-2024. 214

Table 34 – Communication Systems & Devices Market: Business Opportunities. 234

Table 35 – Global Emergency Communication Homeland Security & Public Safety Market Size [$M] by Region – 2017-2024. 237

Table 36 – Global Emergency Communication Homeland Security & Public Safety Market AGRs [%] by Region – 2017-2024. 238

Table 37 – Explosives Trace Detection (ETD) Market: Business Opportunities. 248

Table 38 – Global Explosives Trace Detection (ETD) Market Size [$M] by Region – 2017-2024  253

Table 39 – Global Explosives Trace Detection (ETD) Market AGRs [%] by Region – 2017-2024. 254

Table 40 – Global Information Technologies (w/o Intel & Cyber) Homeland Security & Public Safety Market Size [$M] by Region – 2017-2024. 264

Table 41 – Global Information Technologies (w/o Intel & Cyber) Homeland Security & Public Safety Market AGRs [%] by Region – 2017-2024. 265

Table 42 – Global Intelligence Community ICT Market Size [$M] by Region – 2017-2024  273

Table 43 – Global Intelligence Community ICT Market AGRs [%] by Region – 2017-2024  274

Table 44 – Intrusion Detection Systems Market: Business Opportunities. 280

Table 45 – Global Intrusion Detection Systems Homeland Security & Public Safety Market Size [$M] by Region – 2017-2024. 284

Table 46 – Global Intrusion Detection Systems Homeland Security & Public Safety Market AGRs [%] by Region – 2017-2024. 285

Table 47 – Metal Detectors Market: Business Opportunities. 292

Table 48 – Global Metal Detectors Market Size [$M] by Region – 2017-2024. 296

Table 49 – Global Metal Detectors Market AGRs [%] by Region – 2017-2024. 297

Table 50 – Non-Lethal Weapons Counter-Personnel Means. 301

Table 51 – Electromagnetic NLW Technologies. 302

Table 52 – Mechanical & Kinetic, Acoustic, Ancillary and Chemical NLW Technologies  302

Table 53 – Non-Lethal Weapons Market: Business Opportunities. 306

Table 54 – Global Non-Lethal Weapons Market Size [$M] by Region – 2017-2024. 314

Table 55 – Global Non-Lethal Weapons Market AGRs [%] by Region – 2017-2024. 315

Table 56 – Global Personal (Ballistic & CBRNE) Protective Gear Market Size [$M] by Region – 2017-2024. 328

Table 57 – Global Personal (Ballistic & CBRNE) Protective Gear Market AGRs [%] by Region – 2017-2024. 329

Table 58 – Comparison of Open Space Explosives & Weapons Detection Technologies  338

Table 59 – Global Standoff Explosives & Weapons Detection Market Size [$M] by Region – 2017-2024. 345

Table 60 – Global Standoff Explosives & Weapons Detection Market AGRs [%] by Region – 2017-2024. 346

Table 61 – Explosive Detection Systems vs. Other Luggage Screening Technologies  348

Table 62 – Global Tomographic Explosive Detection Systems & BHS Market Size [$M] by Region – 2017-2024. 362

Table 63 – Global Tomographic Explosive Detection Systems & BHS Market AGRs [%] by Region – 2017-2024. 363

Table 64 – Video Analytics Market: Business Opportunities. 371

Table 65 – Global Video Analytics Homeland Security & Public Safety Market Size [$M] by Region – 2017-2024. 382

Table 66 – Global Video Analytics Homeland Security & Public Safety Market AGRs [%] by Region – 2017-2024. 383

Table 67 – Video Surveillance Market: Business Opportunities. 394

Table 68 – Global Video Security Surveillance (w/o Analytics) Market Size [$M] by Region – 2017-2024. 399

Table 69 – Global Video Security Surveillance (w/o Analytics) Market AGRs [%] by Region – 2017-2024. 400

Table 70 – X-ray Screening Market: Business Opportunities. 408

Table 71 – Explosives, Drugs, and Common X-ray “Interruption” Materials. 415

Table 72 – EDS, ETD and 2D X-ray Technologies – Pros and Cons. 419

Table 73 – Global X-Ray Security Screening Market Size [$M] by Region – 2017-2024  420

Table 74 – Global X-Ray Security Screening Market AGRs [%] by Region – 2017-2024  421

Figures

Figure 1 – Global Homeland Security & Public Safety Technology Markets [$M]– 2017-2024  25

Figure 2 – Technology Homeland Security & Public Safety Markets Ranked by 2017 Market Size [$B] 27

Figure 3 – Technology Homeland Security & Public Safety Markets Ranked by 2024 Market Size [$B] 28

Figure 4 – Technology Homeland Security & Public Safety Markets Ranked by 2018-2024 CAGR [%] 29

Figure 5 – Technology Homeland Security & Public Safety Markets Ranked by 2019-2024 Cumulative Market [$B] 30

Figure 6 – ICT-Intensive Technologies Markets Ranked by 2017 Market Size [$B] 31

Figure 7 – Hardware-Intensive Technologies Markets Ranked by 2017 Market Size [$B] 31

Figure 8 – ICT Intensive Technologies Markets Ranked by 2018-2024 CAGRs [%] 32

Figure 9 – Hardware-Intensive Technologies Markets Ranked by 2018-2024 CAGRs [%] 32

Figure 10 – Airport Automated Border Control Concept 35

Figure 11 – Automatic Border Control Process. 36

Figure 12 – Automatic Border Control Enables Identity Management Throughout a Border Checkpoint 37

Figure 13 – Automatic Border Control (ABC) Installations. 42

Figure 14 – Automatic Border Control (ABC) Block Diagram.. 43

Figure 15 – Automated Immigration Control at Narita Airport 45

Figure 16 – Automated Border Control Process. 47

Figure 17 – Face Recognition Based Automated Border Control 47

Figure 18 – Global Automatic Border Control (ABC) Market Size [$M] by Region – 2017-2024  54

Figure 19 – Regional Automatic Border Control (ABC) Market Shares [%] – 2017-2024  55

Figure 20 – HLS & PS Big Data Lifecycle & Ecosystem. 56

Figure 21 – Joined Access & Delivery Infrastructure (FADI) 57

Figure 22 – How an Artificial Intelligence Neural Network Processes Data. 61

Figure 23 – Global Homeland Security & Public Safety, Big Data & Artificial Intelligence Market Size [$M] by Region – 2017-2024. 71

Figure 24 – Regional Homeland Security & Public Safety, Big Data & Artificial Intelligence Market Shares [%] – 2017-2024. 72

Figure 25 – U.S. Bio-Security and Safety Agencies & Processes Roadmap. 74

Figure 26 – BEADS: Biodetection Enabling Analyte Delivery System.. 75

Figure 27 – Cross-Section of Cascade Impactor: PIXE International Corporation.. 77

Figure 28 – National Biosurveillance Components. 79

Figure 29 – Bio-Detection Strategy. 80

Figure 30 – Bio-Detection Modalities. 81

Figure 31 – The Global Bio-Detection Surveillance and Situational Awareness: Areas of Responsibility. 85

Figure 32 – Global Bio-Agents & Infectious Disease Mitigation Market Size [$M] by Region – 2017-2024. 94

Figure 33 – Regional Bio-Agents & Infectious Disease Mitigation Market Shares [%] – 2017-2024. 96

Figure 34 – Performance of Four Biometric Security Systems. 97

Figure 35 – Operation of a Generic Biometric System.. 98

Figure 36 – Performance Criteria for Biometrics Security Technologies. 99

Figure 37 – Biometrics-Based System Concept 104

Figure 38 – Global Biometrics Homeland Security & Public Safety Market Size [$M] by Region – 2017-2024. 114

Figure 39 – Regional Biometrics Homeland Security & Public Safety Market Shares [%] – 2017-2024. 115

Figure 40 – Perimeter Security by Sector 116

Figure 41 – U.S.– Mexican Pre-Wall (Jan. 2019) Fence Map. 117

Figure 42 – Global Border & Perimeter Security Barriers Market [$M] by Region – 2017-2024  124

Figure 43 – Regional Border & Perimeter Barriers Homeland Security & Public Safety Market Shares [%] – 2017-2024. 125

Figure 44 – A Border Security Command, Control & Communication System.. 130

Figure 45 – Perimeter Security C3I System Topology. 131

Figure 46 – A Seaport Security C3I System Block Diagram.. 132

Figure 47 – Global Homeland Security & Public Safety C2/C4ISR Systems Market Size [$M] by Region – 2017-2024. 139

Figure 48 – Regional Homeland Security & Public Safety C2/C4ISR Systems Market Shares [%] – 2017-2024. 140

Figure 49 – Nuclear-Radiological Threats Weapon Sophistication vs. Consequence  144

Figure 50 – A Simulation of the Impact of the Explosion of a 5000 Curie Co60 Dirty Bomb in Downtown Manhattan.. 145

Figure 51 – The Global Nuclear-Radiological Terror Mitigation Infrastructure. 146

Figure 52 – The Three-Tiered Port of Entry Nuclear Threat Screening Architecture. 147

Figure 53 – Global Chemical, Hazmat & Nuclear Detection Market Size [$M] by Region – 2017-2024. 156

Figure 54 – Regional Chemical, Hazmat & Nuclear Detection Market Shares [%] – 2017-2024  157

Figure 55 – IED Ready for Detonation.. 159

Figure 56 – IED Food Chain and Its Relevant Time Frame. 160

Figure 57 – Counter-IED – Mixed Mode Approach.. 162

Figure 58 – Global Counter-IED Technologies Market Size [$M] by Region – 2017-2024  169

Figure 59 – Regional Counter-IED Technologies Market Shares [%] – 2017-2024. 171

Figure 60 – U.S. National Cybersecurity and Communications Integration Center Branches  173

Figure 61 – Cybersecurity Lifecycle. 175

Figure 62 – The European “Computer Emergency Response Teams & Command Centre” (CERTs.CERT/CCs) 177

Figure 63 – Global Cybersecurity Market Size [$M] by Region – 2017-2024. 187

Figure 64 – Regional Cybersecurity Market Shares [%] – 2017-2024. 188

Figure 65 – Comparison in Weight of Pathogens Between BW Agents & CW Agents [mg] 189

Figure 66 – Casualty Decontamination-Corridor Layout Sample. 190

Figure 67 – Decontamination Core Technologies Overview.. 191

Figure 68 – The Decontamination Cycle. 192

Figure 69 – Decontamination Strategy: From Sample Collection to Decontamination Clearance. 193

Figure 70 – Basic Phases of Response and Recovery to a CBRN & HAZMAT Incident 194

Figure 71 – The Bio Attack Response Timeline. 196

Figure 72 – Global Decontamination of CBRN & Hazmat Incidents Market Size [$M] by Region – 2017-2024. 200

Figure 73 – Regional Decontamination of CBRN & Hazmat Incidents Market Shares [%] – 2017-2024. 201

Figure 74 – U.S.-Mexico Barrier at Tijuana Pedestrian Border Crossing. 202

Figure 75 – Diagram of Physical Security Fence Functions. 206

Figure 76 – U.S. DOD Security and Antiterrorism UFC Fence Application.. 207

Figure 77 – Global Electronic Fencing Homeland Security & Public Safety Market Size [$M] by Region – 2017-2024. 213

Figure 78 – Regional Electronic Fencing Homeland Security & Public Safety Market Shares [%] – 2017-2024. 215

Figure 79 – Emergency Communication Technology Development 217

Figure 80 – C3I Communication Interoperability Roadmap. 218

Figure 81 – Present and Pipeline Emergency Communication: Technologies. 222

Figure 82 – A City Emergency Communication Topology. 225

Figure 83 – City Communication Network. 226

Figure 84 – Wireless Communication Point-to-Multipoint 227

Figure 85 – Public Safety Communication: Obstacles to Interoperability. 230

Figure 86 – Public Safety Powered by LTE.. 231

Figure 87 – Samsung’s Public Safety LTE Solution.. 232

Figure 88 – Global Emergency Communication Homeland Security & Public Safety Market Size [$M] by Region – 2017-2024. 237

Figure 89 – Regional Emergency Communication Homeland Security & Public Safety Market Shares [%] – 2017-2024. 239

Figure 90 – Explosive Trace Detection: Principle of Operation.. 240

Figure 91 – ETD Operational Workflow.. 241

Figure 92 – ETD Baggage Sensor 243

Figure 93 – Explosive Materials Classification. 244

Figure 94 – The Most Commonly Used Explosives Classification.. 245

Figure 95 – Explosives Trace Detection Configuration: Hand Held ETD, Tabletop ETD, Vehicle Screening ETD, Boarding Card Screening ETD.. 246

Figure 96 – Global Explosives Trace Detection (ETD) Market Size [$M] by Region – 2017-2024. 254

Figure 97 – Regional Explosives Trace Detection (ETD) Market Shares [%] – 2017-2024  255

Figure 98 – Global Information Technologies (w/o Intel & Cyber) Homeland Security & Public Safety Market Size [$M] by Region – 2017-2024. 265

Figure 99 – Regional Information Technologies (w/o Intel & Cyber) Homeland Security & Public Safety Market Shares [%] – 2017-2024. 266

Figure 100 – Global Intelligence Community ICT Market Size [$M] by Region – 2017-2024  274

Figure 101 – Regional Intelligence Community ICT Market Shares [%] – 2017-2024  275

Figure 102 – Multi-Modal Intrusion Detectors. 277

Figure 103 – Example of Intrusion Detection System Architecture. 278

Figure 104 – Global Intrusion Detection Systems Homeland Security & Public Safety Market Size [$M] by Region – 2017-2024. 285

Figure 105 – Regional Intrusion Detection Systems Homeland Security & Public Safety Market Shares [%] – 2017-2024. 286

Figure 106 – Metal Detection Portals Technologies. 291

Figure 107 – Global Metal Detectors Market Size [$M] by Region – 2017-2024. 297

Figure 108 – Regional Metal Detectors Market Shares [%] – 2017-2024. 298

Figure 109 – Near Term Counter-Personnel NLW… 299

Figure 110 – Less-Lethal Weapons Clinical Effects. 300

Figure 111 – Mid-Term Counter-Personnel Non-Lethal Weapons. 300

Figure 112 – Far-Term Counter-Personnel Non-Lethal Weapons. 302

Figure 113 – Active Denial System.. 305

Figure 114 – Global Non-Lethal Weapons Market Size [$M] by Region – 2017-2024  315

Figure 115 – Regional Non-Lethal Weapons Market Shares [%] – 2017-2024. 316

Figure 116 – Personal Body Armor 318

Figure 117 – Respiratory Protective Equipment Segments. 320

Figure 118 – CBRN Personal Protective Gear 321

Figure 119 – Global Personal (Ballistic & CBRNE) Protective Gear Market Size [$M] by Region – 2017-2024. 329

Figure 120 – Regional Personal (Ballistic & CBRNE) Protective Gear Market Shares [%] – 2017-2024. 330

Figure 121 – Suicide Attack Sequence. 333

Figure 122 – Evacuation Distance by Threat and Explosive Mass. 337

Figure 123 – Spectrum of Evolving Standoff People Screening Technologies. 339

Figure 124 – Standoff Person-Borne and Vehicle-Borne Explosives & Weapons Detection SWOT Analysis. 342

Figure 125 – Global Standoff Explosives & Weapons Detection Market Size [$M] by Region – 2017-2024. 346

Figure 126 – Regional Standoff Explosives & Weapons Detection Market Shares [%] – 2017-2024. 347

Figure 127 – Whole-Object EDS Scheme. 349

Figure 128 – Tomographic EDS Principle of Operation.. 350

Figure 129 – Aviation Security: “100% EDS” Screening Flow Scheme. 352

Figure 130 – Aviation Security: Checked Luggage EDS Screening Configuration. 353

Figure 131 – Coherent X-Ray Scheme. 354

Figure 132 – Global Tomographic Explosive Detection Systems & BHS Market Size [$M] by Region – 2017-2024. 362

Figure 133 – Regional Tomographic Explosive Detection Systems & BHS Market Shares [%] – 2017-2024. 363

Figure 134 – Video Analytics System: Block Diagram.. 364

Figure 135 – Standoff Biometric People Screening Using Video Analytics. 365

Figure 136 – Video Analytics Architecture. 366

Figure 137 – Global Video Analytics Homeland Security & Public Safety Market Size [$M] by Region – 2017-2024. 383

Figure 138 – Regional Video Analytics Homeland Security & Public Safety Market Shares [%] – 2017-2024. 384

Figure 139 – Video Surveillance Technologies Timeline. 385

Figure 140 – A Wireless Video Surveillance System.. 390

Figure 141 – Global Video Security Surveillance (w/o Analytics) Market Size [$M] by Region – 2017-2024. 400

Figure 142 – Regional Video Security Surveillance (w/o Analytics) Market Shares [%] – 2017-2024. 401

Figure 143 – Airport Security: Hand-Held Baggage & People X-ray Screening. 403

Figure 144 – X-ray Security Systems Market: Barriers to Entry, Supplier Power, Buyer Power and Barriers to Substitution. 412

Figure 145 – X-ray Conveyor-Based Screening Systems – Principles of Operation.. 414

Figure 146 – AIT X-ray People Screening Instruction Billboard. 417

Figure 147 – Major Explosives Detection Technologies: Bulk vs. Trace. 418

Figure 148 – Global X-Ray Security Screening Market Size [$M] by Region – 2017-2024  420

Figure 149 – Regional X-Ray Security Screening Market Shares [%] – 2017-2024. 421

Questions about this report?

Contact Sales: 1-571-527-1010 or Analysts: 1-202-455-0966

  • Have a question about Public Safety & Homeland Security Technologies Market - 2019-2024
    Please fill out all fields in the form below and click "Submit" to send your question.
    Our representative will review your question and contact you with an answer as soon as possible.
  • 2+2=
  • This field is for validation purposes and should be left unchanged.
1
Interested in this report? Need more information?

You may also like…

X
Powered By