Download TOC as PDF3 Volumes:
Safe City Market and Technologies – 2022-2026 – Volume 1
Safe City Market and Technologies – 2022-2026 – Volume 2
Safe City Market and Technologies – 2022-2026 – Volume 3
Safe City Market and Technologies – 2021-2026 – Volume 1
1 Executive Summary………………………………………………. 11
1.1 Key Findings & Conclusions……………………………….. 11
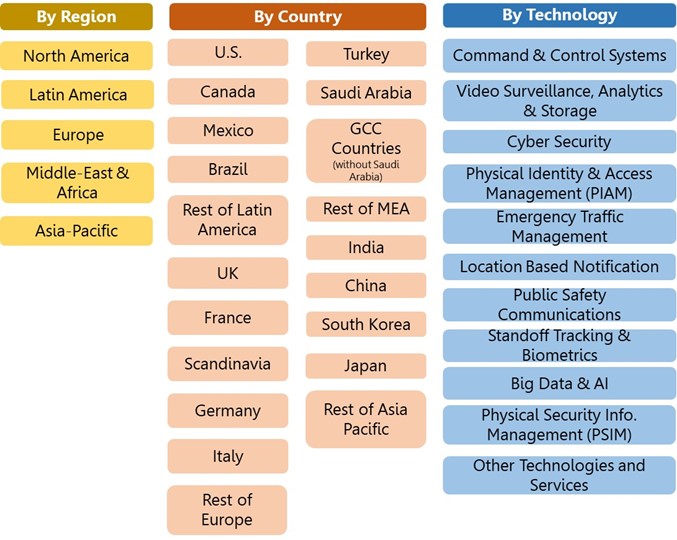
1.2 Global Safe City Market Research Vectors…………….. 21
1.3 Global Safe City Market – 2019-2026……………………. 22
1.3.1 Technology Safe City Markets……………………….. 22
1.3.2 Regional Safe City Markets…………………………… 23
1.3.3 National Safe City Markets……………………………. 25
2 COVID-19 Impact on the Safe City Market…………………. 27
2.1 Summary……………………………………………………….. 27
2.2 Example: COVID-19 Impact on the Global Air Passenger Traffic……………………………………………………………. 28
3 Safe City Market Drivers…………………………………………. 30
4 Safe City Market Inhibitors …………………………………….. 31
5 Safe City Market SWOT Analysis…………………………….. 33
5.1 Strengths……………………………………………………….. 33
5.2 Weaknesses…………………………………………………… 34
5.3 Opportunities…………………………………………………… 34
5.4 Threats………………………………………………………….. 36
6 Competitive Analysis: Market Barriers to New Entry, Supplier Power, Buyer Power, Barriers to Substitution and Competitive Rivalry…………………………………………. 39
7 Safe City Industry Value Chain……………………………….. 41
7.1 Background…………………………………………………….. 41
7.2 The Safe City Industry Primary Activities……………….. 42
7.3 Support Activities……………………………………………… 42
TECHNOLOGY MARKETS……………………………………………… 43
8 Global Safe City Technology Markets………………………. 43
8.1 Safe City Market Size by Technology– 2019-2026…… 43
8.2 Safe City Market Dynamics – 2019-2026……………….. 44
8.3 Global Market Breakdown – 2019-2026………………… 45
9 Command & Control Systems Safe City Market – 2019-2026……………………………………………………………………. 47
9.1 Command & Control Systems Market Size – 2019-2026 47
9.2 Command & Control Systems Safe City Market Dynamics – 2019-2026……………………………………… 47
9.3 Command & Control Systems Market Share – 2019-2026……………………………………………………………… 48
10 Video Surveillance, Analytics & Storage Safe City Market – 2019-2026………………………………………………………….. 49
10.1 Video Surveillance, Analytics & Storage Market Size – 2019-2026………………………………………………………. 49
10.2 Video Surveillance, Analytics & Storage Safe City Market Dynamics – 2019-2026……………………………. 50
10.3 Video Surveillance, Analytics & Storage Market Share – 2019-2026………………………………………………………. 50
11 Cyber Security Safe City Market – 2019-2026…………….. 51
11.1 Cyber Security Market Size – 2019-2026………………. 51
11.2 Cyber Security Safe City Market Dynamics – 2019-2026 51
11.3 Cyber Security Market Share – 2019-2026…………….. 52
12 Emergency Traffic Management Safe City Market – 2019-2026……………………………………………………………………. 53
12.1 Emergency Traffic Management Market Size – 2019-2026……………………………………………………………… 53
12.2 Emergency Traffic Management Safe City Market Dynamics – 2019-2026……………………………………… 53
12.3 Emergency Traffic Management Market Share – 2019-2026……………………………………………………………… 54
13 Location Based Emergency Notification Safe City Market – 2019-2026………………………………………………………….. 55
13.1 Location Based Emergency Notification Market Size – 2019-2026………………………………………………………. 55
13.2 Location Based Emergency Notification Safe City Market Dynamics – 2019-2026……………………………………… 56
13.3 Location Based Emergency Notification Market Share – 2019-2026………………………………………………………. 56
14 Physical Identity & Access Management (PIAM) Safe City Market – 2019-2026……………………………………………….. 57
14.1 Physical Identity & Access Management (PIAM) Market Size – 2019-2026…………………………………………….. 57
14.2 Physical Identity & Access Management (PIAM) Safe City Market Dynamics – 2019-2026……………………… 58
14.3 Physical Identity & Access Management (PIAM) Market Share – 2019-2026…………………………………………… 58
15 Physical Security Info. Management (PSIM) Safe City Market – 2019-2026……………………………………………….. 59
15.1 Physical Security Info. Management (PSIM) Market Size – 2019-2026……………………………………………………. 59
15.2 Physical Security Info. Management (PSIM) Safe City Market Dynamics – 2019-2026……………………………. 60
15.3 Physical Security Info. Management (PSIM) Market Share – 2019-2026…………………………………………… 60
16 Public Safety Communications Safe City Market – 2019-2026……………………………………………………………………. 61
16.1 Public Safety Communications Market Size – 2019-2026 61
16.2 Public Safety Communications Safe City Market Dynamics – 2019-2026……………………………………… 61
16.3 Public Safety Communications Market Share – 2019-2026……………………………………………………………… 62
17 Standoff Tracking & Biometrics Safe City Market – 2019-2026……………………………………………………………………. 63
17.1 Standoff Tracking & Biometrics Market Size – 2019-2026……………………………………………………………… 63
17.2 Standoff Tracking & Biometrics Safe City Market Dynamics – 2019-2026……………………………………… 63
17.3 Standoff Tracking & Biometrics Market Share – 2019-2026……………………………………………………………… 64
18 Big Data & AI Safe City Market – 2019-2026………………. 65
18.1 Big Data & AI Market Size – 2019-2026………………… 65
18.2 Big Data & AI Safe City Market Dynamics – 2019-2026 65
18.3 Big Data & AI Market Share – 2019-2026………………. 66
19 Other Safe City Technologies and Services Market – 2019-2026…………………………………………………………….. 67
19.1 Other Technologies and Services Market Size – 2019-2026……………………………………………………………… 67
19.2 Other Safe City Technologies and Services Global Market Dynamics – 2019-2026……………………………. 67
19.3 Other Safe City Technologies and Services Market Share – 2019-2026…………………………………………… 68
REGIONAL MARKETS…………………………………………………… 69
20 Regional Safe City Markets…………………………………….. 69
20.1 Regional Markets – 2019-2026……………………………. 69
20.2 Regional Safe City Markets Dynamics – 2019-2026…. 70
20.3 Global Market Share by Region – 2019-2026…………. 70
21 North America Safe City Market………………………………. 71
21.1 North America Market – 2019-2026……………………… 71
21.2 North America Safe City Market Dynamics – 2019-2026 71
21.3 North America Market Share – 2019-2026……………… 72
22 Latin America Safe City Market……………………………….. 73
22.1 Latin America Market – 2019-2026………………………. 73
22.2 Latin America Safe City Market Dynamics – 2019-2026 73
22.3 Latin America Market Share – 2019-2026……………… 74
23 Europe Safe City Market………………………………………… 75
23.1 Europe Market – 2019-2026……………………………….. 75
23.2 Europe Safe City Market Dynamics – 2019-2026…….. 75
23.3 Europe Market Share – 2019-2026………………………. 76
24 Middle East & Africa Safe City Market………………………. 77
24.1 Middle East & Africa Market – 2019-2026………………. 77
24.2 Middle East & Africa Safe City Market Dynamics – 2019-2026……………………………………………………………… 77
24.3 Middle East & Africa Market Share – 2019-2026……… 78
25 Asia Pacific Safe City Market………………………………….. 79
25.1 Asia Pacific Market – 2019-2026…………………………. 79
25.2 Asia Pacific Safe City Market Dynamics – 2019-2026. 79
25.3 Asia Pacific Market Share – 2019-2026…………………. 80
[Back to top]
Safe City Market and Technologies – 2022-2026 – Volume 2
NATIONAL MARKETS…………………………………………………….. 9
1 Global Safe City Market by Country…………………………… 9
1.1 Safe City Market Size by Country– 2019-2026…………. 9
1.2 National Safe City Markets Dynamics – 2019-2026….. 10
1.3 Global Market Breakdown by Country – 2019-2026…. 11
2 U.S. Safe City Market – 2019-2026……………………………. 13
2.1 U.S. Market Background……………………………………. 13
2.2 U.S. Market Size – 2019-2026…………………………….. 13
2.3 U.S. Safe City Market Dynamics – 2019-2026………… 13
2.4 U.S. Market Share – 2019-2026………………………….. 14
3 Canada Safe City Market – 2019-2026………………………. 15
3.1 Canada Market Background……………………………….. 15
3.2 Canada Market Size – 2019-2026………………………… 15
3.3 Canada Safe City Market Dynamics – 2019-2026……. 15
3.4 Canada Market Share – 2019-2026……………………… 16
4 Mexico Safe City Market – 2019-2026……………………….. 17
4.1 Mexico Market Background………………………………… 17
4.2 Mexico Market Size – 2019-2026…………………………. 17
4.3 Mexico Safe City Market Dynamics – 2019-2026…….. 17
4.4 Mexico Market Share – 2019-2026………………………. 18
5 Brazil Safe City Market – 2019-2026…………………………. 19
5.1 Brazil Market Background………………………………….. 19
5.2 Brazil Market Size – 2019-2026…………………………… 19
5.3 Brazil Safe City Market Dynamics – 2019-2026………. 19
5.4 Brazil Market Share – 2019-2026…………………………. 20
6 Rest of Latin America Safe City Market – 2019-2026…… 21
6.1 Rest of Latin America Market Background……………… 21
6.2 Rest of Latin America Market Size – 2019-2026……… 21
6.3 Rest of Latin America Safe City Market Dynamics – 2019-2026………………………………………………………. 21
6.4 Rest of Latin America Market Share – 2019-2026……. 22
7 UK Safe City Market – 2019-2026…………………………….. 23
7.1 UK Market Background……………………………………… 23
7.2 UK Market Size – 2019-2026………………………………. 23
7.3 UK Safe City Market Dynamics – 2019-2026………….. 23
7.4 UK Market Share – 2019-2026……………………………. 24
8 France Safe City Market – 2019-2026……………………….. 25
8.1 France Market Background………………………………… 25
8.2 France Market Size – 2019-2026…………………………. 25
8.3 France Safe City Market Dynamics – 2019-2026…….. 25
8.4 France Market Share – 2019-2026………………………. 26
9 Scandinavian Countries Safe City Market – 2019-2026.. 27
9.1 Scandinavian Countries Market Background………….. 27
9.2 Scandinavian Countries Market Size – 2019-2026…… 27
9.3 Scandinavian Countries Safe City Market Dynamics – 2019-2026………………………………………………………. 27
9.4 Scandinavian Countries Market Share – 2019-2026…. 28
10 Germany Safe City Market – 2019-2026…………………….. 29
10.1 Germany Market Background……………………………… 29
10.2 Germany Market Size – 2019-2026………………………. 29
10.3 Germany Safe City Market Dynamics – 2019-2026….. 29
10.4 Germany Market Share – 2019-2026……………………. 30
11 Italy Safe City Market – 2019-2026……………………………. 31
11.1 Italy Market Background…………………………………….. 31
11.2 Italy Market Size – 2019-2026…………………………….. 31
11.3 Italy Safe City Market Dynamics – 2019-2026…………. 31
11.4 Italy Market Share – 2019-2026…………………………… 32
12 Rest of Europe Safe City Market – 2019-2026…………….. 33
12.1 Rest of Europe Market Background……………………… 33
12.2 Rest of Europe Market Size – 2019-2026………………. 33
12.3 Rest of Europe Safe City Market Dynamics – 2019-2026 33
12.4 Rest of Europe Market Share – 2019-2026…………….. 34
13 Turkey Safe City Market – 2019-2026……………………….. 35
13.1 Turkey Market Background………………………………… 35
13.2 Turkey Market Size – 2019-2026…………………………. 35
13.3 Turkey Safe City Market Dynamics – 2019-2026…….. 35
13.4 Turkey Market Share – 2019-2026……………………….. 36
14 Saudi Arabia Safe City Market – 2019-2026……………….. 37
14.1 Saudi Arabia Market Background…………………………. 37
14.2 Saudi Arabia Market Size – 2019-2026…………………. 37
14.3 Saudi Arabia Safe City Market Dynamics – 2019-2026 37
14.4 Saudi Arabia Market Share – 2019-2026……………….. 38
15 GCC Countries* Safe City Market – 2019-2026…………… 39
15.1 GCC Countries* Market Background…………………….. 39
15.2 GCC Countries* Market Size – 2019-2026…………….. 39
15.3 GCC Countries* Safe City Market Dynamics – 2019-2026……………………………………………………………… 39
15.4 GCC Countries* Market Share – 2019-2026…………… 40
16 Rest of MEA Safe City Market – 2019-2026………………… 41
16.1 Rest of MEA Market Background…………………………. 41
16.2 Rest of MEA Market Size – 2019-2026………………….. 41
16.3 Rest of MEA Safe City Market Dynamics – 2019-2026 41
16.4 Rest of MEA Market Share – 2019-2026……………….. 42
17 India Safe City Market – 2019-2026………………………….. 43
17.1 India Market Background…………………………………… 43
17.2 India Market Size – 2019-2026……………………………. 43
17.3 India Safe City Market Dynamics – 2019-2026……….. 43
17.4 India Market Share – 2019-2026………………………….. 44
18 China Safe City Market – 2019-2026…………………………. 45
18.1 China Market Background………………………………….. 45
18.2 China Market Size – 2019-2026…………………………… 45
18.3 China Safe City Market Dynamics – 2019-2026………. 45
18.4 China Market Share – 2019-2026………………………… 46
19 South Korea Safe City Market – 2019-2026……………….. 47
19.1 South Korea Market Background…………………………. 47
19.2 South Korea Market Size – 2019-2026………………….. 47
19.3 South Korea Safe City Market Dynamics – 2019-2026 47
19.4 South Korea Market Share – 2019-2026……………….. 48
20 Japan Safe City Market – 2019-2026…………………………. 49
20.1 Japan Market Background………………………………….. 49
20.2 Japan Market Size – 2019-2026………………………….. 49
20.3 Japan Safe City Market Dynamics – 2019-2026………. 49
20.4 Japan Market Share – 2019-2026………………………… 50
21 Rest of Asia Pacific Safe City Market – 2019-2026……… 51
21.1 Rest of Asia Pacific Market Background………………… 51
21.2 Rest of Asia Pacific Market Size – 2019-2026…………. 51
21.3 Rest of Asia Pacific Safe City Market Dynamics – 2019-2026……………………………………………………………… 51
21.4 Rest of Asia Pacific Market Share – 2019-2026………. 52
[Back to top]
Safe City Market and Technologies – 2022-2026 – Volume 3
Table of Contents
VENDORS…………………………………………………………………… 16
1 Leading Vendors…………………………………………………… 16
1.1 3VR………………………………………………………………. 16
1.2 3xLOGIC………………………………………………………… 16
1.3 ABB………………………………………………………………. 17
1.4 Accenture……………………………………………………….. 17
1.5 Airbus Defence and Space…………………………………. 18
1.6 Alcatel-Lucent (Nokia Group)………………………………. 18
1.7 AT&T Inc………………………………………………………… 19
1.8 BAE Systems………………………………………………….. 19
1.9 Bosch Security Systems…………………………………….. 20
1.10 CEIA……………………………………………………………… 20
1.11 CelPlan………………………………………………………….. 21
1.12 China Security & Surveillance Inc………………………… 21
1.13 Cisco Systems…………………………………………………. 22
1.14 Ericsson…………………………………………………………. 22
1.15 ESRI……………………………………………………………… 23
1.16 Flir Systems……………………………………………………. 23
1.17 Hitachi…………………………………………………………… 24
1.18 Honeywell………………………………………………………. 24
1.19 Huawei………………………………………………………….. 25
1.20 IBM……………………………………………………………….. 25
1.21 MilliVision……………………………………………………….. 26
1.22 NEC Corporation……………………………………………… 26
1.23 NICE Systems…………………………………………………. 27
1.24 Northrop Grumman Corp……………………………………. 27
1.25 Raytheon……………………………………………………….. 28
1.26 Red X Defense………………………………………………… 28
1.27 Sony Corp………………………………………………………. 29
1.28 Thales Group………………………………………………….. 29
1.29 Thermo Electron Corporation……………………………… 30
1.30 Unisys……………………………………………………………. 30
1.31 Verint…………………………………………………………….. 31
1.32 Westminister…………………………………………………… 31
1.33 Zhejiang Dahua Technology……………………………….. 32
APPENDICES………………………………………………………………. 33
Appendix A: National Markets Background……………………… 33
North America……………………………………………………………… 33
2 U.S. Market…………………………………………………………… 33
2.1 U.S. Market Background……………………………………. 33
2.1.1 Facts & Figures 2020…………………………………… 33
2.1.2 U.S. Public Safety & Homeland Security: Introduction……………………………………………….. 33
2.2 U.S. Federal Homeland Security Related Organizations 36
2.2.1 Department of Homeland Security (DHS)…………. 37
2.2.2 Department of Homeland Security: Agencies and Units………………………………………………………… 38
2.2.3 DHS – Transportation Security Administration (TSA)………………………………………………………………. 41
2.2.4 DHS – U.S. Customs & Border Protection (CBP).. 43
2.2.5 DHS – Federal Emergency Management Agency (FEMA)…………………………………………………….. 43
2.2.6 DHS – U.S. Immigration & Customs Enforcement (ICE)………………………………………………………… 44
2.2.7 DHS – U.S. Coast Guard (USCG)…………………… 44
2.2.8 U.S. Secret Service (USSS)………………………….. 45
2.2.9 DHS – Science & Technology Directorate (S&T)… 45
2.2.10 DHS – Domestic Nuclear Detection Office (DNDO)………………………………………………………………. 46
2.2.11 DHS – U.S. Citizenship & Immigration Services (USCIS)……………………………………………………. 47
2.2.12 DHS – National Protection and Programs Directorate (NPPD)……………………………………… 48
2.2.13 Department of Defense (DOD)………………………. 48
2.2.14 Department of Justice (DOJ)…………………………. 49
2.2.15 Federal Bureau of Investigation (FBI)………………. 51
2.3 U.S. Police Forces……………………………………………. 52
2.4 U.S. Airports Security Statistics…………………………… 53
2.4.1 Air Passengers Checkpoint CCTV Support Program………………………………………………………………. 60
2.4.2 CCTV Assisted Secure Flight Program……………. 60
2.5 U.S. Land Border Security………………………………….. 61
2.5.1 Introduction……………………………………………….. 61
2.5.2 U.S. Land Border Security Components…………… 62
2.6 U.S. Critical Infrastructure Security………………………. 63
2.6.1 Major Findings……………………………………………. 63
2.6.2 Critical Infrastructure Security Tactics……………… 66
2.6.3 Critical Infrastructure Vulnerabilities………………… 67
2.6.4 Planning of Infrastructure Security………………….. 68
2.7 U.S. Maritime Security………………………………………. 68
2.7.1 Major Findings & Conclusions……………………….. 68
2.7.2 Maritime Security Infrastructure……………………… 70
2.7.3 Port Critical Infrastructure Operations……………… 72
2.7.4 The Container Security Initiative (CSI)…………….. 73
2.8 U.S. Land Transportation Security……………………….. 74
2.8.1 Scope………………………………………………………. 74
2.8.2 Land Transportation Security: Background……….. 75
2.8.3 Mass Transit Security………………………………….. 76
2.9 U.S. Energy Sector Security……………………………….. 76
2.9.1 Scope………………………………………………………. 76
2.9.2 U.S. Energy Sector Security: Background………… 77
2.10 U.S. Public Events Security………………………………… 78
2.10.1 Scope………………………………………………………. 78
2.10.2 U.S. Natural & Manmade Disaster Mitigation…….. 79
3 Canada Market……………………………………………………… 81
3.1 Canada Market Background……………………………….. 81
3.1.1 Facts & Figures 2020…………………………………… 81
3.1.2 Canada Geopolitical Overview………………………. 81
3.1.3 Crime in Canada………………………………………… 82
3.1.4 Canada’s Counter Terror & Law Enforcement Legislation………………………………………………… 82
3.1.5 Canada’s Homeland Security & Public Safety Agencies…………………………………………………… 83
3.1.6 Canada’s Police Forces……………………………….. 84
3.1.7 Canada’s Security Intelligence Services…………… 84
3.1.8 Canada’s Defense Forces…………………………….. 85
3.1.9 Canada: Airport Security Statistics………………….. 85
3.1.10 Canada Border Security……………………………….. 86
Latin America………………………………………………………………. 88
4 Mexico Market………………………………………………………. 88
4.1 Mexico Market Background………………………………… 88
4.1.1 Facts & Figures 2020…………………………………… 88
4.1.2 Mexico Geopolitical Overview………………………… 88
4.1.3 Mexico Homeland Security & Public Safety Industry………………………………………………………………. 89
4.1.4 Crime in Mexico…………………………………………. 92
4.1.5 Mexico’s Counter Terror Legislation & Law Enforcement……………………………………………… 93
4.1.6 Mexico’s Homeland Security & Public Safety Agencies…………………………………………………… 95
4.1.7 Mexico’s Police Forces………………………………… 95
4.1.8 Mexico’s Intelligence Services……………………….. 97
4.1.8.1 Center for Research and National Security…….. 97
4.1.8.2 Secretariat of National Defense…………………… 97
4.1.9 Mexico’s Defense Forces……………………………… 97
4.1.10 Mexico: Safe City Projects……………………………. 98
4.1.10.1 Mexico’s Urban Crime and Insurgency………….. 98
4.1.10.2 Security Policy…………………………………………. 99
4.1.11 Mexico: Airport Security Statistics…………………… 99
5 Brazil Market………………………………………………………. 102
5.1 Brazil Market Background…………………………………. 102
5.1.1 Facts & Figures 2020…………………………………. 102
5.1.2 Brazil Geopolitical Overview………………………… 102
5.1.3 Brazil Homeland Security & Public Safety Industry……………………………………………………………… 104
5.1.4 Crime in Brazil………………………………………….. 105
5.1.5 Terror in Brazil………………………………………….. 106
5.1.6 Brazil’s Counter Terror Legislation & Law Enforcement…………………………………………….. 107
5.1.7 Brazil’s Homeland Security & Public Safety Agencies…………………………………………………. 107
5.1.8 Brazil’s Police Forces…………………………………. 108
5.1.9 Brazil’s Intelligence Services……………………….. 108
5.1.9.1 ABIN……………………………………………………. 108
5.1.10 Brazil’s Defense Forces……………………………… 109
5.1.11 Brazil: Safe City Projects…………………………….. 109
5.1.12 Brazil: Airport Security Statistics…………………… 110
5.1.13 Brazil Border Security………………………………… 112
Europe……………………………………………………………………… 113
6 UK Market…………………………………………………………… 113
6.1 UK Market Background……………………………………. 113
6.1.1 Facts & Figures 2020…………………………………. 113
6.1.2 UK Geopolitical Overview……………………………. 113
6.1.3 The Brexit Effects……………………………………… 114
6.1.4 UK Homeland Security & Public Safety: Market Background……………………………………………… 115
6.1.5 UK National Security Risk Assessment………….. 117
6.1.6 Crime in the UK………………………………………… 118
6.1.7 Terror in the UK………………………………………… 118
6.1.7.1 UK Homeland Security and Public Safety Strategy…………………………………………………………… 119
6.1.7.2 Countering Terrorism Financing…………………. 120
6.1.7.3 UK Intelligence Agencies Funding………………. 121
6.1.8 The UK Homeland Security & Public Safety Agencies…………………………………………………. 122
6.1.9 The UK Police Forces………………………………… 122
6.1.10 UK Intelligence Services…………………………….. 124
6.1.10.1 Security Service – MI5……………………………… 124
6.1.10.2 National Domestic Extremism & Disorder Intelligence Unit (NDEDIU)……………………….. 125
6.1.10.3 National Crime Agency (NCA)……………………. 125
6.1.10.4 National Ballistics Intelligence Service (NABIS) 125
6.1.10.5 National Fraud Intelligence Bureau (NFIB)……. 125
6.1.10.6 MI6, Secret Intelligence Service…………………. 125
6.1.10.7 Defense Intelligence (DI)………………………….. 126
6.1.10.8 Government Communications Headquarters (GCHQ)………………………………………………… 126
6.1.10.9 The Joint Intelligence Organization……………… 127
6.1.10.10 The Parliament Intelligence and Security Committee…………………………………………….. 127
6.1.10.11 National Security Secretariat (NSS)…………….. 128
6.1.10.12 Office for Security and Counter-Terrorism (OSCT)…………………………………………………………… 128
6.1.10.13 UK Intelligence Agencies Budgets………………. 128
6.1.11 UK Defense Forces…………………………………… 128
6.1.12 UK: Safe City Projects………………………………… 129
6.1.12.1 Urban Security……………………………………….. 129
6.1.12.2 UK Security Policy…………………………………… 129
6.1.12.3 Urban Crime Data…………………………………… 130
6.1.12.4 UK Safe City Projects: Introduction……………… 130
6.1.13 UK: Airport Security Statistics………………………. 131
6.1.14 UK Border Security……………………………………. 132
6.1.14.1 Overview………………………………………………. 132
6.1.14.2 UK Home Office Border Force……………………. 133
6.1.14.3 The UK Immigration Legislation…………………. 134
7 Germany Market………………………………………………….. 135
7.1 Germany Market Background……………………………. 135
7.1.1 Facts & Figures 2020…………………………………. 135
7.1.2 Germany Geopolitical Overview……………………. 135
7.1.3 Germany: Economy, Immigration & Terror………. 135
7.1.4 Germany Homeland Security & Public Safety Industry…………………………………………………… 138
7.1.5 Crime in Germany…………………………………….. 138
7.1.6 Terror in Germany…………………………………….. 139
7.1.7 Germany’s Counter Terror Legislation & Law Enforcement…………………………………………….. 139
7.1.7.1 Germany Approach to Homeland Security and Public Safety………………………………………….. 141
7.1.8 Germany’s Homeland Security & Public Safety Agencies…………………………………………………. 142
7.1.9 Germany’s Police Forces……………………………. 143
7.1.9.1 BPOL – Federal Police……………………………… 143
7.1.9.2 GSG 9 – Special Operations & Counterterrorism Unit……………………………………………………… 143
7.1.9.3 ASSIK – Special Task Force Protection in Crisis Areas…………………………………………………… 144
7.1.9.4 ZKA – Customs Investigation Bureau…………… 144
7.1.9.5 ZUZ – Customs SWAT Unit……………………….. 144
7.1.9.6 Military Police…………………………………………. 145
7.1.9.7 State Police Forces…………………………………. 145
7.1.9.8 SEK – State Special Operations Command Part of Uniformed Police…………………………………….. 145
7.1.9.9 MEK – Mobile Task Force units, Part of Criminal Police…………………………………………………… 146
7.1.10 Germany’s Intelligence Services…………………… 146
7.1.10.1 Federal Intelligence Service (BND)……………… 146
7.1.10.2 Federal Office for the Protection of the Constitution (BfV)……………………………………. 147
7.1.10.3 Military Counterintelligence Service (MAD)…… 147
7.1.10.4 The State Office for the Protection of the Constitution…………………………………………… 148
7.1.11 Germany’s Defense Forces…………………………. 148
7.1.12 Germany’s Safe City………………………………….. 148
7.1.12.1 Urban Crime in Germany………………………….. 148
7.1.12.2 Germany: Safe City Projects……………………… 149
7.1.12.3 Safe City Project in Stuttgart……………………… 150
7.1.12.4 German Safe City Market Eco-System………… 150
7.1.13 Germany: Airport Security Statistics………………. 152
7.1.14 Germany Border Security……………………………. 153
7.1.14.1 German E-Passport…………………………………. 154
7.1.14.2 Automated Border Control (ABC) Gates………. 154
8 France Market…………………………………………………….. 157
8.1 France Market Background………………………………. 157
8.1.1 Facts & Figures 2020…………………………………. 157
8.1.2 France Geopolitical Overview………………………. 157
8.1.3 France Homeland Security & Public Safety Industry……………………………………………………………… 157
8.1.4 Crime in France………………………………………… 158
8.1.5 Terror in France………………………………………… 158
8.1.6 France’s Terror Threats & Counter Terror Strategy……………………………………………………………… 163
8.1.6.1 The New Realities of Terror………………………. 163
8.1.6.2 2015-2018 Counter Terror Policy Transformation…………………………………………………………… 164
8.1.6.3 Threat Levels…………………………………………. 165
8.1.7 French Anti-Terror Legislation……………………… 165
8.1.8 France’s Homeland Security & Public Safety Agencies…………………………………………………. 169
8.1.9 France’s Police Forces……………………………….. 169
8.1.9.1 The National Police…………………………………. 170
8.1.9.2 Research, Assistance, Intervention, Deterrence (RAID)………………………………………………….. 171
8.1.9.3 National Police Intervention Groups (GIPN)….. 171
8.1.9.4 Paris Police Prefecture…………………………….. 171
8.1.9.5 The Municipal Police……………………………….. 172
8.1.9.6 The National Gendarmerie………………………… 172
8.1.9.7 National Gendarmerie Intervention Group…….. 172
8.1.9.8 Police Forces Statistics…………………………….. 173
8.1.10 France’s Intelligence Services……………………… 173
8.1.10.1 Domestic Counter-terrorism & Counter-espionage Intelligence (DGSI)………………………………….. 173
8.1.10.2 Central Directorate of the Judicial Police (DCPJ)…………………………………………………………… 174
8.1.10.3 General Directorate for External Security (DGSE)…………………………………………………………… 175
8.1.10.4 Directorate of Protection and Defense Security (DPSD)…………………………………………………. 175
8.1.10.5 Directorate of Military Intelligence (DRM)……… 176
8.1.10.6 Anti-Terrorist Bureau (BLAT)……………………… 176
8.1.10.7 Inter-Departmental Coordination on Terrorism Matters…………………………………………………. 176
8.1.11 France’s Defense Forces……………………………. 177
8.1.12 France: Safe City Projects…………………………… 177
8.1.13 France: Airport Security Statistics…………………. 179
8.1.14 France Border Security………………………………. 180
8.1.14.1 France Immigration Data………………………….. 182
8.1.14.2 France Visa Policy………………………………….. 183
8.1.14.3 France E-Passport………………………………….. 183
8.1.14.4 France Immigration Legislation………………….. 184
9 Italy Market…………………………………………………………. 185
9.1 Italy Market Background…………………………………… 185
9.1.1 Facts & Figures 2020…………………………………. 185
9.1.2 Italy Geopolitical Overview………………………….. 185
9.1.3 Italy Security & Safety Industry…………………….. 186
9.1.4 Crime in Italy……………………………………………. 188
9.1.5 Terror in Italy……………………………………………. 189
9.1.6 Italy’s Counter Terror Legislation & Law Enforcement…………………………………………….. 189
9.1.7 Italy’s Homeland Security & Public Safety Agencies……………………………………………………………… 190
9.1.8 Italy’s Police Forces…………………………………… 191
9.1.9 Italy’s Intelligence Services…………………………. 193
9.1.9.1 Internal Information and Security Agency (AISI) 193
9.1.9.2 External Intelligence and Security Agency (AISE)…………………………………………………………… 193
9.1.9.3 Department of Information for Security (DIS)…. 194
9.1.9.4 Interministerial Committee for the Security of the Republic (CISR)……………………………………… 194
9.1.10 Italy: Airport Security Statistics…………………….. 195
9.1.11 Italy Border Security…………………………………… 196
10 Sweden Market……………………………………………………. 198
10.1 Sweden Market Background……………………………… 198
10.1.1 Facts & Figures 2020…………………………………. 198
10.1.2 Sweden Geopolitical Overview…………………….. 198
10.1.3 Sweden Homeland Security & Public Safety Industry……………………………………………………………… 198
10.1.4 Crime in Sweden………………………………………. 199
10.1.5 Terror in Sweden………………………………………. 199
10.1.6 Sweden’s Counter Terror Legislation & Law Enforcement…………………………………………….. 200
10.1.7 Sweden’s Homeland Security & Public Safety Agencies…………………………………………………. 200
10.1.8 Sweden’s Police Forces……………………………… 201
10.1.9 Sweden’s Defense Forces…………………………… 202
10.1.10 Sweden’s Intelligence Services…………………….. 202
10.1.11 Sweden: Safe City Projects…………………………. 202
10.1.12 Sweden: Airport Security Statistics………………… 203
11 Denmark Market………………………………………………….. 204
11.1 Denmark Market Background……………………………. 204
11.1.1 Facts & Figures 2020…………………………………. 204
11.1.2 Denmark Geopolitical Overview……………………. 204
11.1.3 Denmark Security & Public Safety Industry……… 204
11.1.4 Crime in Denmark……………………………………… 205
11.1.5 Terror in Denmark…………………………………….. 206
11.1.6 Denmark’s Counter Terror Legislation & Law Enforcement…………………………………………….. 206
11.1.7 Denmark’s Police Forces……………………………. 207
11.1.8 Denmark’s Intelligence Services…………………… 208
11.1.9 Denmark’s Defense Forces…………………………. 208
11.1.10 Denmark: Airport Security Statistics………………. 209
Middle East & Africa……………………………………………………. 210
12 Turkey Market…………………………………………………….. 210
12.1 Turkey Public Safety & Homeland Security Market Background…………………………………………………… 210
12.1.1 Facts & Figures 2020…………………………………. 210
12.1.2 Turkey Homeland Security & Public Safety Market……………………………………………………………… 210
12.1.3 Turkey COVID-19 Pandemic……………………….. 212
12.1.4 Crime in Turkey………………………………………… 212
12.1.5 Terror in Turkey………………………………………… 213
12.1.6 Turkey’s Counter Terror Legislation & Law Enforcement…………………………………………….. 214
12.1.7 Turkey’s Homeland Security & Public Safety Agencies…………………………………………………. 214
12.1.8 Turkey’s Police Forces……………………………….. 215
12.1.9 Turkey’s Intelligence Services……………………… 216
12.1.9.1 The National Intelligence Organization (MIT)…. 216
12.1.10 Turkey’s Defense Forces……………………………. 217
12.1.11 Turkey: Airport Security Statistics…………………. 218
12.1.12 Turkey Border Security………………………………. 219
13 Saudi Arabia Market…………………………………………….. 221
13.1 Saudi Arabia Market Background……………………….. 221
13.1.1 Facts & Figures 2020…………………………………. 221
13.1.2 Saudi Arabia Homeland Security & Public Safety Market……………………………………………………. 221
13.1.3 Saudi Arabia COVID-19 Pandemic……………….. 221
13.1.4 Crime in Saudi Arabia………………………………… 222
13.1.5 Saudi Arabia’s Counter Terror Legislation & Law Enforcement…………………………………………….. 222
13.1.6 Saudi Arabia’s Homeland Security & Public Safety Agencies…………………………………………………. 223
13.1.6.1 Ministry of Interior……………………………………. 226
13.1.6.2 Saudi National Guard………………………………. 227
13.1.6.3 Paramilitary Security Forces……………………… 228
13.1.7 Saudi Arabia’s Police Forces……………………….. 228
13.1.8 Saudi Arabia’s Intelligence Services……………… 229
13.1.8.1 General Intelligence Presidency (GIP)…………. 229
13.1.8.2 General Investigation Directorate (GID or Mabahith)……………………………………………… 229
13.1.9 Saudi Arabia’s Defense Forces…………………….. 230
13.1.9.1 Armed Services………………………………………. 230
13.1.9.2 Independent Forces………………………………… 231
13.1.10 Saudi Arabia’s Safe City Projects………………….. 231
13.1.10.1 Saudi Arabia – 34 Ongoing and Future Safe Cities Projects………………………………………………… 235
13.1.10.2 The Hajj Safe City Strategy……………………….. 235
13.1.11 Saudi Arabia: Airport Security Statistics…………. 236
13.1.12 Saudi Arabia Border Security……………………….. 236
14 UAE Market………………………………………………………… 237
14.1 UAE Market Background………………………………….. 237
14.1.1 Facts & Figures 2020…………………………………. 237
14.1.2 UAE Homeland Security & Public Safety Market. 237
14.1.3 UAE COVID-19 Pandemic…………………………… 242
14.1.4 Crime in the UAE………………………………………. 242
14.1.5 Terror in the UAE………………………………………. 243
14.1.6 UAE’s Counter Terror Legislation & Law Enforcement…………………………………………….. 243
14.1.7 UAE’s Homeland Security & Public Safety Agencies……………………………………………………………… 245
14.1.8 UAE Police Forces…………………………………….. 246
14.1.9 UAE’s Intelligence Services…………………………. 248
14.1.10 UAE’s Defense Forces……………………………….. 248
14.1.10.1 Military Contribution Abroad………………………. 248
14.1.11 UAE’s Safe City Projects…………………………….. 249
14.1.12 UAE: Airport Security Statistics…………………….. 251
14.1.13 UAE Border Security………………………………….. 251
15 Qatar Market……………………………………………………….. 252
15.1 Qatar Market Background………………………………… 252
15.1.1 Facts & Figures 2020…………………………………. 252
15.1.2 Qatar Homeland Security & Public Safety Market 252
15.1.3 Qatar COVID-19 Pandemic…………………………. 254
15.1.4 Crime in Qatar………………………………………….. 254
15.1.5 Terror in Qatar………………………………………….. 256
15.1.6 Qatar’s Counter Terror Legislation & Law Enforcement…………………………………………….. 256
15.1.7 Qatar’s Police Forces…………………………………. 257
15.1.8 Qatar’s Intelligence Services……………………….. 258
15.1.9 Qatar’s Defense Forces……………………………… 259
15.1.10 Qatar’s Safe City Projects…………………………… 260
15.1.11 Qatar: Airport Security Statistics…………………… 260
15.1.12 Qatar Border Security………………………………… 260
16 Kuwait Market…………………………………………………….. 262
16.1 Kuwait Market Background……………………………….. 262
16.1.1 Facts & Figures 2020…………………………………. 262
16.1.2 Kuwait Homeland Security & Public Safety Market……………………………………………………………… 262
16.1.3 COVID-19 pandemic in Kuwait…………………….. 263
16.1.4 Crime in Kuwait………………………………………… 263
16.1.5 Kuwait’s Counter Terror Legislation & Law Enforcement…………………………………………….. 264
16.1.6 Kuwait’s Homeland Security & Public Safety Agencies…………………………………………………. 264
16.1.7 Kuwait’s Police Forces……………………………….. 265
16.1.8 Kuwait’s Intelligence Services………………………. 265
16.1.9 Kuwait’s Defense Forces…………………………….. 266
16.1.10 Kuwait’s Safe City Projects………………………….. 267
16.1.11 Kuwait: Airport Security Statistics………………….. 268
16.1.12 Kuwait Border Security……………………………….. 268
Asia Pacific……………………………………………………………….. 269
17 India Market………………………………………………………… 269
17.1 India Market Background………………………………….. 269
17.1.1 Facts & Figures 2020…………………………………. 269
17.1.2 India Homeland Security & Public Safety Market 269
17.1.3 COVID-19 Pandemic in India……………………….. 271
17.1.4 Crime in India…………………………………………… 273
17.1.4.1 Crime in New Delhi………………………………….. 273
17.1.4.2 Crime in Mumbai…………………………………….. 273
17.1.4.3 Crime in Hyderabad………………………………… 274
17.1.5 Terror in India…………………………………………… 274
17.1.6 India’s Counter Terror Legislation & Law Enforcement…………………………………………….. 274
17.1.7 India’s Homeland Security & Public Safety Agencies……………………………………………………………… 275
17.1.8 India’s Police Forces………………………………….. 276
17.1.9 India’s Defense Market………………………………. 277
17.1.10 India’s Intelligence Services………………………… 280
17.1.10.1 Intelligence Bureau (IB)……………………………. 280
17.1.10.2 Research and Analysis Wing (RAW)…………… 281
17.1.11 India’s Defense Forces………………………………. 281
17.1.12 India’s Safe City Projects……………………………. 282
17.1.13 India: Airport Security Statistics……………………. 283
17.1.14 India Border Security…………………………………. 285
18 China Market………………………………………………………. 287
18.1 China Market Background………………………………… 287
18.1.1 Facts & Figures 2020…………………………………. 287
18.1.2 China Geopolitical Overview………………………… 288
18.1.3 China Economy………………………………………… 289
18.1.4 China: Security Threat Assessment………………. 292
18.1.5 China’s Security Industry…………………………….. 293
18.1.6 China Homeland Security & Public Safety Market……………………………………………………………… 296
18.1.7 Crime in China………………………………………….. 296
18.1.8 Terror in China…………………………………………. 298
18.1.9 China’s Counter Terror Legislation & Law Enforcement…………………………………………….. 299
18.1.10 China’s Homeland Security & Public Safety Agencies…………………………………………………. 301
18.2 National Security Commission of the Communist Party of China (CNSC)…………………………………………….. 302
18.3 The 610 Office……………………………………………….. 302
18.3.1 China’s Police Forces………………………………… 305
18.3.2 China’s Intelligence Services……………………….. 305
18.3.3 China’s Ministry of Public Security………………… 306
18.3.4 China’s Public Security Bureau…………………….. 307
18.3.5 China’s Ministry of State Security………………….. 307
18.3.6 China’s Defense Forces……………………………… 308
18.3.7 Natural Disasters in China…………………………… 312
18.3.8 China’s Safe City Projects…………………………… 313
18.3.8.1 China Public Security………………………………. 313
18.3.8.2 China Urbanization Plan…………………………… 314
18.3.8.3 China Safe Cities Market………………………….. 314
18.3.8.4 China’s 200 Largest Safe City Projects………… 315
18.3.9 China: Airport Security Statistics…………………… 317
18.3.10 China Border Security………………………………… 323
19 South Korea Market……………………………………………… 324
19.1 South Korea Market Background……………………….. 324
19.1.1 Facts & Figures 2020…………………………………. 324
19.1.2 South Korea Homeland Security & Public Safety Market……………………………………………………. 324
19.1.3 Crime in South Korea…………………………………. 325
19.1.4 Terror in South Korea………………………………… 326
19.1.5 South Korea’s Homeland Security & Public Safety Agencies…………………………………………………. 326
19.1.6 South Korea’s Police Forces……………………….. 327
19.1.7 South Korea’s Intelligence Services………………. 328
19.1.7.1 National Intelligence Service (NIS)……………… 328
19.1.8 South Korea’s Defense Forces…………………….. 328
19.1.9 South Korea’s Safe City Projects………………….. 329
19.1.10 South Korea: Airport Security Statistics………….. 330
19.1.11 South Korea Border Security……………………….. 331
20 Japan Market………………………………………………………. 332
20.1 Japan Market Background………………………………… 332
20.1.1 Facts & Figures 2020…………………………………. 332
20.1.2 Japan Homeland Security & Public Safety Market……………………………………………………………… 332
20.1.3 Crime in Japan…………………………………………. 333
20.1.4 Terror in Japan…………………………………………. 333
20.1.5 Japan’s Homeland Security & Public Safety Agencies…………………………………………………. 334
20.1.6 Japan’s Police Forces………………………………… 335
20.1.7 Japan’s Intelligence Services……………………….. 335
20.1.7.1 Public Security Intelligence Agency (PSIA)…… 335
20.1.7.2 Intelligence and Analysis Service……………….. 336
20.1.8 Japan’s Defense Forces……………………………… 336
20.1.9 Japan’s Safe City Projects…………………………… 337
20.1.10 Natural Disasters in Japan………………………….. 337
20.1.11 Japan: Airport Security Statistics…………………… 339
20.1.12 Japan Border Security………………………………… 341
21 Appendix B: Post Coronavirus Pandemic Global Security Concerns……………………………………………………………. 343
22 Appendix C: Global Risks 2020: A Regional Perceptive 347
23 Appendix D: Global Geopolitical Scenario: 2026 Outlook 351
24 Appendix E: Global Terror Threats………………………… 353
25 Appendix F: The Industry……………………………………… 358
25.1 Mergers & Acquisitions (M&A)…………………………… 358
25.2 Business Models & Strategies…………………………… 358
25.2.1 Variable Economic Conditions……………………… 358
25.2.2 Market Tiers…………………………………………….. 359
25.2.3 Defense Primes & Mega Corporations’ Inroads into the Market……………………………………………….. 359
25.2.4 Market Entry Strategies………………………………. 359
25.2.5 Market Entry Challenges…………………………….. 360
25.2.6 The Industry: Supply-Side & Demand-Side Analysis……………………………………………………………… 361
25.2.7 Price Elasticity………………………………………….. 364
25.2.8 Vendor – Government Relationship………………. 366
26 Appendix G: Safe City Industry Supply-Side & Demand-Side Analysis……………………………………………………… 370
26.1 Safe City Development and Procurement Process…. 371
26.1.1 Safe City Technology Development, Testing & Evaluation Process……………………………………. 371
26.2 Spiral Development, Procurement & Deployment of Safe City Systems…………………………………………………. 374
27 Appendix H: Security & Safety Product Standards…… 375
28 Appendix I: Abbreviations…………………………………….. 398
29 Research Methodology………………………………………… 410
29.1 Report Structure…………………………………………….. 410
29.2 Research Methodology……………………………………. 410
29.3 For Whom is this Report?…………………………………. 411
30 Disclaimer and Copyright……………………………………… 412