Top
HSRCSmart Borders, Immigration Enforcement & Border Security Markets in Europe – 2017-2022
Placeholder

Smart Borders, Immigration Enforcement & Border Security Markets in Europe - 2017-2022

Border Security Market 2015-2020 CAGR: 15.5%. Granulated by 40 Submarkets

  • May 2017 Edition
  • 289
  • 80
    • 4450 $
    • 5450 $
    • 6950 $
    • 10000 $

    Small Businesses, Startups & Academia - Up to 50% Off

Quantity
IBM
Amazon
Sandia National Lab
HITACHI
Thales
Smiths Detection
Nuctech
Korea Internet & Security Agency
L3Harris
Huawei
Leidos
NEC
Toshiba
Deloitte
MAG

Want to customize this report?

If you purchase this report, you are entitled to a 30% discount towards customizing it, to better fit your market research and strategic needs. Our Custom Research and Industry Insights Department will work with you to better understand your information gaps and strategic needs and will provide you with a tailor-made market research report within a short period of time.

Why Choose Us?

30+ Years of Experience
We are a multidisciplinary team of Transformational Technologies industry experts with over 30 years of experience.
Gold Standard
With over 950 private sector clients (73% repeat customers), including major defense and security vendors, and Forbes Global 2000 companies, HSRC earned the reputation as the industry’s Gold Standard for Transformational Technologies Market Reports.
Tailored Research Services
Provide you with clear, actionable recommendations designed to empower decision making and to help you exploit emerging opportunities in the Transformational Technologies industries.
Information Security
Your personal information is safe and secure.

From: $4,450

SKU: 8736 Category:

Description

Border Security Markets in Europe - 2016-2022
European Smart Borders, Immigration Enforcement & Border Security Markets
2010, 2015 & 2020

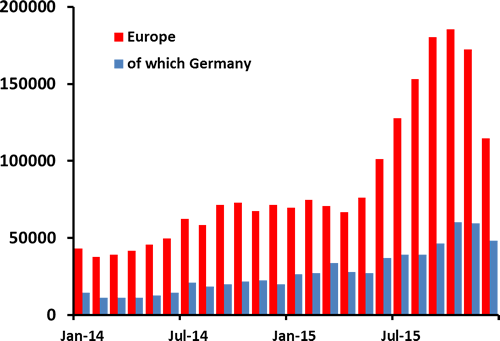
With 1.8 million asylum seekers (UN reports) crossing Western Europe’s external borders in 2015, the European border security agencies are facing challenges with a far greater reach than ever before. More than 1000 ISIS-trained jihadists returning to Europe every year, coupled with the surge of migrants to Europe are alarming concerns; as present capabilities of the European border, coast guard, intelligence services and immigration agencies simply cannot meet these challenges.

The EU-Turkey deal (if implemented) might lead to a significant decrease in the flow of refugees (by March-April 2016 the rate of migrants entering Greece declined by 90%). However, the agreement faces formidable practical, political and legal challenges (e.g., each and every one of the 22 EU parliaments has to endorse the treaty).

In the aftermath of the migration crisis and the Paris and Brussels terror attacks, a major overhaul of the Western European border security and immigration infrastructure, strategy, border security technology development and funding is already underway.

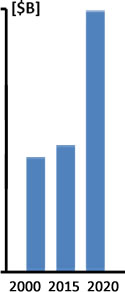
Following a 2010 to 2015 annual market growth of 10-13% the 2015 to 2020 annual border security market will surge by 104%.

The “European Smart Borders, Immigration Enforcement & Border Security Markets – 2016-2022” report is the most comprehensive review of the border security market available today. It provides a detailed and reasoned roadmap of this growing security market.

The European Smart Borders, Immigration Enforcement & Border Security Market is boosted by the following drivers:

  • The Western European border security, coast guards, immigration agencies and intelligence agencies are ill-equipped to counter the surge of refugees and 21st century jihadists who use sophisticated means to return to the continent.
  • The Schengen Area is comprised of 26 European countries that have abolished border control at their common borders. Several Schengen Area governments reinstated border checkpoints by 2015.
  • Europe cannot build a wall to keep out refugees and terrorists or enlist millions of border guards who would need to watch every inch of its over 10,000 land borders and 80,000 coastlines.
  • Europol estimates that up to 5,000 European jihadists have already returned to Western Europe after obtaining combat experience on the battlefields of the Middle East.
  • On 15 December 2015, the European Commission presented a proposal for a new agency that would replace and succeed Frontex, having a stronger role and mandate, and forming a “European Border and Coast Guard” along with national authorities for border management.
  • Of Europe’s approximately 50 countries, Russia has by far the longest coastline as well as the longest land border.
  • Western Europe, the largest economy in the world with a 2015 GDP of approximately $22 trillion (vs. the U.S. $17.5 trillion), can invest “whatever it takes” to protect its citizens from the looming jeopardies of mass migration and terrorism using advanced border security technologies.
  • The border security and immigration enforcement industry faces a considerable challenge in seeking to provide the necessary solutions to current and future threats. At the same time, this challenge presents multi-billion USD opportunities to the defense, ICT and security industries able to deliver effective functions, integrate systems, and maximize security and productivity per $ invested.
  • According to European intelligence services, ISIS has approximately 5000 original European blank passports which can be used by jihadists returning to the EU.
  • The EU and the rest of the European border security and immigration infrastructure enforcement market for products and services are served by local defense and security companies. Even with a preference for locally manufactured products, foreign products can usually strongly compete on the basis of cost-performance. They do not encounter any EU direct trade barriers or quotas. Non-tariff, indirect trade barriers may be the approval process of dual use goods, which include many security market products.

European Smart Borders, Immigration Enforcement & Border Security Markets - 2016-2022

2014-2015 Refugee Applications to Europe by Month
Source: The UN

This Europe Border Security report is a resource for executives with interests in the border security system market. It has been explicitly customized for the security industry and other decision-makers in order to identify business opportunities, developing technologies, market trends and risks, as well as to benchmark business plans.

* Customers who purchase a multi-readers license of the report will get the “Global Homeland Security & Public Safety Industry – 2016 Edition” report free of charge. Single-reader license customers will get a 50% discount for the Industry report.

Questions answered in this 289-page report + one* reports include:

  • What will the border security market size and trends be during 2016-2022?
  • Which are the submarkets that provide attractive business opportunities?
  • Who are the decision-makers?
  • What drives the immigration enforcement & border security agencies to purchase products and services?
  • What are the customers looking for?
  • What are the technology & services trends?
  • What is the market SWOT (Strengths, Weaknesses, Opportunities and Threats)?
  • What are the challenges to market penetration & growth?

With 289 pages, 31 tables and 49 figures, the “European Smart Borders, Immigration Enforcement & Border Security Markets – 2016-2022” report covers 12 countries and regions, 4 technologies and 3 revenue source submarkets, offering for each of them 2015 data and assessments, and 2016-2022 forecasts and analyses.

Why Buy this Report?

A. Border Security Market data is analyzed via 3 key orthogonal perspectives:

With a highly fragmented market we address the “money trail” – each dollar spent – via the following 3 viewpoints:

  • By 12 Country and Region Markets:
    1. UK
    2. France
    3. Holland & Belgium
    4. Sweden, Norway, Finland & Denmark
    5. Germany
    6. Austria & Switzerland
    7. Italy
    8. Spain
    9. Poland
    10. Hungary & Czech Republic
    11. Russia
    12. Rest of Europe
  • By 3 Revenue Sources including:
    1. Products Sales Revenues
    2. After Sale Revenues Including: Maintenance, Service, Upgrades & Refurbishment
    3. Other Revenues Including: Planning, Training, Consulting, Contracted Services & Government Funded R&D
  • By 4 Technologies:
    1. Automatic Border Control (ABC) Systems
    2. Border & Perimeter Barriers
    3. Visa Issuance IT Systems
    4. Smart Borders, Immigration Enforcement & Border Security Technologies

B. Detailed market analysis frameworks for each of the market sectors, including:

  1. Market drivers & inhibitors
  2. Business opportunities
  3. SWOT analysis
  4. Competitive analysis
  5. Business environment
  6. The 2015-2022 market segmented by 36 submarkets

C. The Europe Border Security report includes the following 5 appendices:

  1. Appendix A: European Homeland Security & Public Safety Related Product Standards
  2. Appendix B: The European Union Challenges and Outlook
  3. Appendix C: Europe Migration Crisis & Border Security
  4. Appendix D: Abbreviations

D. The border security market report addresses over 300 European Homeland Security and Public Safety standards (including links)

E. The supplementary (*) “Global Homeland Security & Public Safety Industry – 2016 Edition” report provides the following insights and analysis of the industry including:

  • The Global Industry 2016 status
  • Effects of Emerging Technologies on the Industry
  • The Market Trends
  • Vendor – Government Relationship
  • Geopolitical Outlook 2016-2022
  • The Industry Business Models & Strategies
  • Market Entry Challenges
  • The Industry: Supply-Side & Demand-Side Analysis
  • Market Entry Strategies
  • Price Elasticity
  • Past Mergers & Acquisitions (M&A) Events

F. The supplementary (*) “Global Homeland Security & Public Safety Industry – 2016 Edition” report provides a May 2016 updated extensive data (including company profile, recent annual revenues, key executives, homeland security and public safety products, and contact info.) of the leading 119 Homeland Security and Public Safety vendors including:

  1. 3M
  2. 3i-MIND
  3. 3VR
  4. 3xLOGIC
  5. ABB
  6. Accenture
  7. ACTi Corporation
  8. ADT Security Services
  9. AeroVironment Inc.
  10. Agent Video Intelligence
  11. Airbus Defence and Space
  12. Alcatel-Lucent (Nokia Group)
  13. ALPHAOPEN
  14. American Science & Engineering Inc.
  15. Anixter
  16. Aralia Systems
  17. AT&T Inc.
  18. Augusta Systems
  19. Austal
  20. Avigilon Corporation
  21. Aware
  22. Axis
  23. AxxonSoft
  24. Ayonix
  25. BAE Systems
  26. BioEnable Technologies Pvt Ltd
  27. BioLink Solutions
  28. Boeing
  29. Bollinger Shipyards, Inc
  30. Bosch Security Systems
  31. Bruker Corporation
  32. BT
  33. Camero
  34. Cassidian
  35. CelPlan
  36. China Security & Surveillance, Inc.
  37. Cisco Systems
  38. Citilog
  39. Cognitec Systems GmbH
  40. Computer Network Limited (CNL)
  41. Computer Sciences Corporation
  42. CrossMatch
  43. Diebold
  44. DRS Technologies Inc.
  45. DVTel
  46. Elbit Systems Ltd.
  47. Elsag Datamat
  48. Emerson Electric
  49. Ericsson
  50. ESRI
  51. FaceFirst
  52. Finmeccanica SpA
  53. Firetide
  54. Fulcrum Biometrics LLC
  55. G4S
  56. General Atomics Aeronautical Systems Inc.
  57. General Dynamics Corporation
  58. Getac Technology Corporation
  59. Hanwha Techwin
  60. Harris Corporation
  61. Hewlett Packard Enterprise
  62. Hexagon AB
  63. Honeywell International Inc.
  64. Huawei Technologies Co., Ltd
  65. IBM
  66. IndigoVision
  67. Intel Security
  68. IntuVision Inc
  69. iOmniscient
  70. IPConfigure
  71. IPS Intelligent Video Analytics
  72. Iris ID Systems, Inc.
  73. IriTech Inc.
  74. Israel Aerospace Industries Ltd.
  75. ISS
  76. L-3 Security & Detection Systems
  77. Leidos, Inc.
  78. Lockheed Martin Corporation
  79. MACROSCOP
  80. MDS
  81. Mer group
  82. Milestone Systems A/S
  83. Mirasys
  84. Motorola Solutions, Inc.
  85. National Instruments
  86. NEC Corporation
  87. NICE Systems
  88. Northrop Grumman Corporation
  89. Nuance Communications, Inc.
  90. ObjectVideo
  91. Panasonic Corporation
  92. Pelco
  93. Pivot3
  94. Proximex
  95. QinetiQ Limited
  96. Rapiscan Systems, Inc.
  97. Raytheon
  98. Rockwell Collins, Inc.
  99. Safran S.A.
  100. Salient Sciences
  101. Schneider Electric
  102. SeeTec
  103. Siemens
  104. Smart China (Holdings) Limited
  105. Smiths Detection Inc.
  106. Sony Corp.
  107. Speech Technology Center
  108. Suprema Inc.
  109. Synectics Plc
  110. Tandu Technologies & Security Systems Ltd
  111. Texas Instruments
  112. Textron Inc.
  113. Thales Group
  114. Total Recall
  115. Unisys Corporation
  116. Verint
  117. Vialogy LLC
  118. Vigilant Technology
  119. Zhejiang Dahua Technology

Table of Contents

Download TOC as PDF

1 Europe’s Terror & Migration Crisis: Key Findings
2 Europe’s Terror & Migration Crisis: Key Conclusions
3 European Immigration Enforcement Market – 2016-2022
3.1 Introduction
3.2 Major Findings
3.3 Key Conclusions
3.4 Major Challenges
3.5 Europe’s 2015 Refugee Crisis
3.6 Immigration Enforcement Market Background
3.7 The EU Internal Borders
3.8 Schengen Visas
3.9 Schengen Information System
3.1 Frontex
3.11 The External Borders Fund
3.12 The Pr?m Treaty
3.13 SWOT Analysis
3.13.1 Strengths
3.13.2 Weaknesses
3.13.3 Opportunities
3.14 Threats
3.15 European Immigration Enforcement Market – 2015-2022
4 European Smart Borders & Border Security Market – 2016-2022
4.1 Scope
4.2 The European Borders Security
4.2.1 Introduction
4.2.2 The Schengen Area
4.2.3 European Integrated Border Management (IBM)
4.2.4 The EU Smart Borders Initiative
4.2.5 The Schengen Zone: Passenger Name Record (PNR) System Outlook
4.2.6 The 2014-2015 European Migration Surge
4.2.7 Temporary Reintroduction of Border Control
4.3 European Smart & Secure Border Market
4.3.1 Europe Smart Borders Projects
4.3.2 Visas Requirements
4.3.2.1 Introduction
4.3.2.2 Post Visa Liberalization Monitoring Mechanism
4.3.2.3 Schengen Evaluation Mechanism
4.3.2.4 FRONTEX Procurement Process
4.4 Major Findings
4.5 Major Conclusions
4.6 Market Background
4.7 The Defense Industry vs. the Smart Borders & Border Security Market
4.8 European Smart Borders, Immigration Enforcement & Border Security Market: SWOT Analysis
4.8.1 Strengths
4.8.2 Weaknesses
4.8.3 Opportunities
4.8.4 Threats
4.9 Business Models & Strategies
4.9.1 Variable Economic Conditions
4.9.2 Smart Borders, Immigration Enforcement & Border Security Market Tiers
4.9.3 Border Security Market Business Opportunities & Challenges
4.9.4 Smart Borders, Immigration Enforcement & Border Security Market Competitive Analysis
5 European Automatic Border Control (ABC) Systems Market – 2016-2022
5.1 Automatic Border Control (ABC) Technologies and Market Background
5.1.1 The European Automatic Border Control Market Background
5.2 The European Automated Border Control: ABC4EU Project
5.2.1 ABC4EU Project: Scope
5.2.2 ABC4EU Project Test & Validation:
5.2.3 The ABC4EU Project Proposal
5.2.4 ABC4EU Project Activities
5.2.5 The 2015 European Project Status
5.2.6 The ABC4EU Project Impacts
5.2.7 Biometric Automatic Border Control (ABC) Advantages
5.3 Automated Border Control Technologies
5.3.1 Airport Automated Border Control Market Background
5.3.2 Function of Automated Border Control
5.4 European Automated Border Control Systems Standards
5.5 European Automated Border Control Legislation
5.6 Automatic Border Control Systems Industry: SWOT Analysis
5.6.1 Strengths
5.6.2 Weaknesses
5.6.3 Opportunities
5.6.4 Threats
5.7 European Automatic Border Control (ABC) Systems Market – 2015-2022
6 European Border & Perimeter Barriers Market – 2016-2022
6.1 European Border & Perimeter Barriers Technology and Market Background
6.2 European Border Barriers
6.2.1 Hungarian Border Barrier
6.2.2 Greek Border Barrier
6.2.3 Austria Border Barrier
6.2.4 Bulgarian Border Barrier
6.2.5 Macedonian Border Barrier
6.2.6 Slovenian Border Barrier
6.2.7 Northern Ireland Border Barrier
6.2.8 Estonia Border Barrier
6.2.9 Spain Border Barriers
6.2.9.1 Ceuta Border Fence
6.2.9.2 Melilla Border Fence
6.2.10 Gibraltar Border Fence
6.2.11 Russia-Ukraine Barrier
6.3 European Border & Perimeter Barriers Market – 2015-2022
7 European Visa Issuance IT Market – 2016-2022
7.1 Scope
7.2 European Visa Issuance IT Technology & Market Background
7.2.1 The 2015 Asylum Database
7.3 The European Visa Information (Technology) System (VIS)
7.4 The Schengen Area Visa
7.4.1 Schengen Area Visa States
7.4.2 On the Road to EU membership / Candidate Countries
7.4.3 Potential candidates
7.4.4 Visa Exemptions
7.4.5 Who Needs a Schengen Visa?
7.4.6 Schengen Visa Types
7.4.6.1 Uniform Schengen Visas (USV)
7.4.6.2 Limited Territorial Validity Visas (LTV)
7.4.6.3 National Visas
7.4.7 Schengen Visa Fee
7.4.8 Schengen VISA Statistics 2014
7.5 Russian Federation Visa IT
7.6 European Visa Issuance IT Market – 2015-2022
8 European Smart Borders, Immigration Enforcement & Border Security Market – 2015-2022
8.1 Smart Borders, Immigration Enforcement & Border Security Market by Country – 2015-2022
8.1.1 2015 Market Size & 2016-2022 Market Forecast
8.1.2 Market Dynamics by Country – 2016-2022
8.1.3 Market Breakdown by Country – 2015-2022
8.2 Market by Revenue Source – 2015-2022
8.2.1 2015 Market Size & 2016-2022 Market Forecast
8.2.2 Market Dynamics by Revenue Source – 2016-2022
8.2.3 Market Breakdown by Revenue Source – 2015-2022
8.3 UK Smart Borders, Immigration Enforcement & Border Security Market – 2015-2022
8.4 France Smart Borders, Immigration Enforcement & Border Security Market – 2015-2022
8.5 Belgium Smart Borders, Immigration Enforcement & Border Security Market – 2015-2022
8.6 Germany Smart Borders, Immigration Enforcement & Border Security Market – 2015-2022
8.7 Austria & Switzerland: Smart Borders, Immigration Enforcement & Border Security Market – 2015-2022
8.8 Italy Smart Borders, Immigration Enforcement & Border Security Market – 2015-2022
8.9 Spain Smart Borders, Immigration Enforcement & Border Security Market – 2015-2022
8.1 Poland Smart Borders, Immigration Enforcement & Border Security Market – 2015-2022
8.11 Hungary & Czech Republic: Smart Borders, Immigration Enforcement & Border Security Market – 2015-2022
8.12 Russia Smart Borders, Immigration Enforcement & Border Security Market – 2015-2022
8.13 Rest of Europe: Smart Borders, Immigration Enforcement & Border Security Market – 2015-2022
9 Appendix A: European Homeland Security & Public Safety Related Product Standards
9.1 European Committee for Standardization (CEN)
9.2 European Homeland Security and Public Safety Standards
9.3 EU Buildings & Perimeter Security Standards & Specifications
10 Appendix B: The European Union Challenges and Outlook
10.1 Summary
10.2 The EU Economy
10.3 Anti-EU Trends
10.4 The EU Frail Leadership and Poor Strategic Vision
10.5 Migration and Refugee Crisis
10.6 European Security Worries
10.7 Terrorism
10.8 EU Future Scenarios
11 Appendix C: Europe Migration Crisis & Border Security
11.1 Introduction
11.2 EU Migration: Background
11.3 The European Borders Security
11.3.1 Introduction
11.3.2 The Schengen Area
11.3.3 The European Integrated Border Management System (IBM)
11.3.4 The EU Smart Borders Initiative
11.3.5 The Schengen Zone: Passenger Name Record (PNR) System Outlook
11.3.6 Temporary Reintroduction of Border Control
11.4 European Smart & Secure Border Market
12 Appendix D: Abbreviations
13 Scope, Methodology & Disclaimer
13.1 Research Scope
13.2 Research Methodology
14 Disclaimer & Copyright

Tables

Table 1 European Population, Muslim-Population, GDP, GDP/Capita and Defense-Budget 2014 Data by 17 Countries
Table 2 European Police Forces, 1st Responders, Airports & Air-Passengers Statistics by Country
Table 3 2015 Mediterranean Sea Arrivals by Country
Table 4 European Immigration Enforcement Market [$M] and AGR [%] – 2015-2022
Table 5 Border Security Market: Business Opportunities Sectors
Table 6 Border Security Market – Competitive Analysis
Table 7 European Automatic Border Control (ABC) Systems Market [$M] and AGR [%] – 2015-2022
Table 8 European Border & Perimeter Barriers Market [$M] and AGR [%] – 2015-2022
Table 9 Countries Nationals Who Need a Schengen Visa
Table 10 Uniform Schengen Visa (including MEV) Statistics 2014
Table 11 Visa Application by Third Country – 2014
Table 12 European Visa Issuance IT Market [$M] and AGR [%] – 2015-2022
Table 13 European Border Security & Immigration Enforcement Security Market* [$M] by Country – 2015-2022
Table 14 European Smart Borders, Immigration Enforcement & Border Security Market* AGRs [%] by Country – 2016-2022
Table 15 European Smart Borders, Immigration Enforcement & Border Security Market* Shares [%] by Country – 2015-2022
Table 16 European Border Security & Immigration Enforcement Security Market [$M] by Revenue Source (Sales, Aftersale and Other Revenues) – 2015-2022
Table 17 European Smart Borders, Immigration Enforcement & Border Security Market AGRs [%] by Revenue Source – 2016-2022
Table 18 European Smart Borders, Immigration Enforcement & Border Security Market Share [%] by Revenue Source – 2015-2022
Table 19 UK Smart Borders, Immigration Enforcement & Border Security Market [$M] by Revenue Source – 2015-2022
Table 20 France Smart Borders, Immigration Enforcement & Border Security Market [$M] by Revenue Source – 2015-2022
Table 21 Belgium Smart Borders, Immigration Enforcement & Border Security Market [$M] by Revenue Source – 2015-2022
Table 22 Germany Smart Borders, Immigration Enforcement & Border Security Market [$M] by Revenue Source – 2015-2022
Table 23 Austria & Switzerland: Smart Borders, Immigration Enforcement & Border Security Market [$M] by Revenue Source – 2015-2022
Table 24 Italy Smart Borders, Immigration Enforcement & Border Security Market [$M] by Revenue Source – 2015-2022
Table 25 Spain Smart Borders, Immigration Enforcement & Border Security Market [$M] by Revenue Source – 2015-2022
Table 26 Poland Smart Borders, Immigration Enforcement & Border Security Market [$M] by Revenue Source – 2015-2022
Table 27 Hungary & Czech Republic: Smart Borders, Immigration Enforcement & Border Security Market [$M] by Revenue Source – 2015-2022
Table 28 Russia Smart Borders, Immigration Enforcement & Border Security Market [$M] by Revenue Source – 2015-2022
Table 29 Rest of Europe: Smart Borders, Immigration Enforcement & Border Security Market [$M] by Revenue Source – 2015-2022
Table 30 European Homeland Security and Public Safety Standards
Table 31  Membership in the EU, Eurozone, and Schengen Area

Figures

Figure 1 Europe Three-Key Challenges
Figure 2 Number of European ISIS-Da’esh Fighters by Country
Figure 3 2015 Refugee Applications to Europe by Month
Figure 4 2015 Migrant Applications to Europe by Country of Origin
Figure 5 Main Routes of Migration to Europe
Figure 6 European Asylum-Seeker Decisions by Country
Figure 7 Refugee Acceptance by Country 2015
Figure 8 Asylum Claims per 100.000 Local Populations 2015
Figure 9 EU Defense Expenditure [%] Drop – 2007-2014 [Constant 2005 Euros]
Figure 10 Number of European ISIS Fighters by Country
Figure 11 European Illegal Border-Crossers 2015 by Main Nationalities
Figure 12 Video Analytics Modes Used For Border Crossing Surveillance
Figure 13 Border Fence
Figure 14 Land Border Migration
Figure 15 Future Asylum Seekers European Border Control System Architecture
Figure 16 Asylum Claims in Europe 2015
Figure 17 Asylum Claims per 100.000 Local Populations 2015
Figure 18 Top 10 Origins of Asylum Seeking Migrants Jan-Oct. 2015
Figure 19 Numbers of Refugees EU Member States are Requested to Take
Figure 20 Asylum Applications Granted By European Countries 2014
Figure 21 European Refugee Routes 2014 & 2015
Figure 22 Mediterranean Refugees Deaths by Route 2014 & 2015
Figure 23 Syrian Refugees in the Middle East and Europe (November 2015)
Figure 24 Main European Migration Routes and Asylum Seekers Statistics
Figure 25 Fragility and Instability in Europe Neighborhood MEA Countries
Figure 26 Europe Inflows of Threats
Figure 27 The Frontex Organization
Figure 28 The Frontex Border Map
Figure 29 Details of a Passport Stamp Confirming Border Crossing
Figure 30 European Immigration Enforcement Market [$M] – 2015-2022
Figure 31 European Borders
Figure 32 The 2015 Schengen Map
Figure 33 The Advanced Passenger Analysis (APA) System
Figure 34 Main Migrant Routes to Germany
Figure 35 Migrant Arrivals by Sea and Land Borders in 2015
Figure 36 Automatic Border Control (ABC) Airport Facility
Figure 37 An Automatic Border Control (ABC) Kiosk
Figure 38 FRONTEX Procurement Categories by Market Share [%]
Figure 39 Border Security, Layers of Security
Figure 40 Border Security Threat Detection Scheme
Figure 41 The EU Airport Automated Border Control Concept
Figure 42 Automatic Border Control Enable Identity Management throughout a Border Checkpoint
Figure 43 Automatic Border Control (ABC) Installations
Figure 44 Automatic Border Control (ABC) Block Diagram
Figure 45 Automated Border Control Process
Figure 46 Face Recognition Based Automated Border Control
Figure 47 European Automatic Border Control (ABC) Systems Market [$M] – 2015-2022
Figure 48 Border Barrier Architecture
Figure 49 The Greek Border Barrier
Figure 50 Estonia-Russia Border
Figure 51 European Border & Perimeter Barriers Market [$M] – 2015-2022
Figure 52 The ABC Visa IT Reader
Figure 53 The Schengen Area Visa Member States
Figure 54 Global European Visa Status
Figure 55 European Visa Issuance IT Market [$M] – 2015-2022
Figure 56 European Border Security & Immigration Enforcement Security Market [$M] by Country – 2015-2022
Figure 57 European Border Security & Immigration Enforcement Security Market Shares [%] by Country – 2015-2022
Figure 58 European Border Security & Immigration Enforcement Security Market [$M] by Revenue Source (Sales, Aftersale and Other Revenues) – 2015-2022
Figure 59 European Smart Borders, Immigration Enforcement & Border Security Market Share [%] by Revenue Source – 2015-2022
Figure 60 The European Union: Member States and Candidate Countries
Figure 61 EU Countries Currency Status- 2016
Figure 62 European 2015-2016 GDP Growth Forecast [%] By Country
Figure 63 Europe GDP per Capita By Country
Figure 64 2015 Refugee Applications to Europe by Month
Figure 65 2015 Migrant Applications to Europe by Country of Origin
Figure 66 Main Routes of Migration
Figure 67 European Asylum-Seeker Decisions by Country
Figure 68 Refugee Acceptance by Country 2015
Figure 69 Asylum Claims per 100.000 Local Populations 2015
Figure 70 Fragility and Instability in Europe Neighborhood MEA Countries
Figure 71 Europe Inflows of Threats
Figure 72 European Borders
Figure 73 The 2016 Schengen Border Map
Figure 74 The Advanced Passenger Analysis (APA) System
Figure 75  Migrant Arrivals by Sea and Land Borders in 2015

Questions about this report?

Contact Sales: 1-571-527-1010 or Analysts: 1-202-455-0966

  • Have a question about Smart Borders, Immigration Enforcement & Border Security Markets in Europe - 2017-2022
    Please fill out all fields in the form below and click "Submit" to send your question.
    Our representative will review your question and contact you with an answer as soon as possible.
  • 2+2=
  • This field is for validation purposes and should be left unchanged.
1
Interested in this report? Need more information?

You may also like…

X
Powered By