| 1 |
Executive Summary |
| 1.1 |
Major Findings |
| 1.2 |
Major Conclusions |
| 1.3 |
Luggage Screening Technologies |
| 1.4 |
Global Tomographic Explosives Detection Systems Market – 2014-2020 |
| 1.4.1 |
Explosive Detection System Related Sub-Markets |
| 1.4.2 |
Global Tomographic Explosives Detection Systems Market by Vertical Market |
| 1.4.3 |
Global Tomographic Explosives Detection Systems Market by Country |
| |
TECHNOLOGIES |
| 2 |
Current Explosive Detection Technologies |
| 2.1 |
Explosive Materials Classification |
| 2.2 |
Explosives Detection Technologies |
| 2.2.1 |
Major Explosives Detection Technologies |
| 2.2.2 |
Current Luggage, Carry-on Bags & Parcel Screening Technologies |
| 2.3 |
Bulk Screening Technologies |
| 2.3.1 |
Bulk Screening Technologies: Pros and Cons |
| 2.3.2 |
EDS Throughput |
| 2.3.3 |
Bulk Screening Technologies: Price Comparison |
| 2.4 |
X-ray Technology |
| 2.4.1 |
2D X-ray Screening: Pros and Cons |
| 2.4.2 |
Innocuous Materials Interference |
| 2.5 |
Explosive Detection Systems Technology and Certification |
| 2.5.1 |
Tomographic Principle of Operation |
| 2.5.2 |
Dual Energy EDS |
| 2.6 |
“Tomographic” X-Ray Diffraction Explosives Detection Technologies and Application |
| 2.6.1 |
Introduction |
| 2.6.2 |
Principle of Operation |
| 2.6.3 |
Automated Level 2-3 Localized Scanning Screening |
| 2.6.4 |
Localized Inspection Using X-Ray Diffraction Technology |
| 2.6.5 |
Hybrid Tomographic Explosive Detection System & 2D X-ray Screening |
| 2.6.6 |
Explosive Detection System Certification |
| 2.6.7 |
Explosive Detection System Throughput vs. Price |
| 3 |
EDS Based Aviation Security Screening |
| 3.1 |
Scope |
| 3.2 |
Checked Luggage Screening |
| 3.2.1 |
EDS based Screening Systems Deployment Strategy |
| 3.2.2 |
Coherent X-ray Scatter Based Multi-Level Screening |
| 3.2.3 |
Checked Luggage Covert Testing Procedures |
| 4 |
EDS Technology Outlook – 2014-2020 |
| 4.1 |
Advanced Coherent X-ray Scattering EDS |
| 4.2 |
Stationary EDS |
| 4.3 |
Liquid and Homemade Explosives Detection |
| 4.4 |
MagViz Distinguishes Potential-Threat Liquids |
| 4.5 |
Superconducting Quantum Interference Device (SQUID) |
| 4.6 |
Quasi Tomographic EDS – 3D X-ray |
| |
INDUSTRY |
| 5 |
Explosive Detection Systems (EDS) Industry: SWOT Analysis |
| 5.1 |
Strengths |
| 5.2 |
Weaknesses |
| 5.3 |
Opportunities |
| 5.4 |
Threats |
| 6 |
EDS Industry Competitive Analysis |
| 7 |
EDS Business & Technological Opportunities and Challenges |
| 7.1 |
Business Opportunity #1 |
| 7.2 |
Business Opportunity #2 |
| 7.3 |
Business Opportunity #3 |
| 7.4 |
Business Opportunity #4 |
| 7.5 |
Business Opportunity #5 |
| 7.6 |
Business Opportunity #6 |
| 7.7 |
Business Opportunity #7 |
| |
GLOBAL MARKET |
| 8 |
Market Drivers |
| 9 |
Market Inhibitors |
| 10 |
Global Tomographic Explosives Detection Systems Market – 2014-2020 |
| 10.1 |
EDS Vertical Markets |
| 10.1.1 |
EDS Related Sub-Markets |
| 10.1.2 |
Market Forecast – 2014-2020 |
| 10.1.3 |
Market Dynamics – 2014-2020 |
| 10.1.4 |
Market Breakdown – 2014-2020 |
| 10.2 |
Global Tomographic Explosives Detection Systems Vertical Markets |
| 10.2.1 |
Global EDS Equipment Market – 2014-2020 |
| 10.2.2 |
Global EDS Installation Market – 2014-2020 |
| 10.2.3 |
Global Baggage Handling Systems Market – 2014-2020 |
| 10.3 |
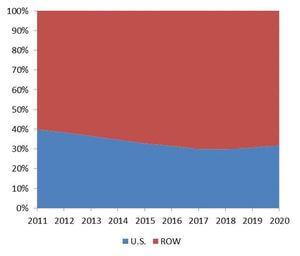
Global Tomographic Explosives Detection Systems Market by Country |
| 10.3.1 |
Consolidated Market – 2014-2020 |
| 10.3.2 |
Market Dynamics – 2014-2020 |
| 10.3.3 |
Market Breakdown – 2014-2020 |
| |
NATIONAL MARKETS |
| 11 |
U.S. Tomographic Explosives Detection Systems Market – 2014-2020 |
| 11.1 |
U.S. Federal HLS Organizations |
| 11.2 |
U.S. Aviation Security Market Background |
| 11.2.1 |
The Transportation Security Administration |
| 11.2.2 |
Screening Partnership Program |
| 11.2.3 |
Screening Training and Other Programs |
| 11.2.4 |
Passengers Checkpoint Support Program |
| 11.2.5 |
Electronic Baggage Screen Program (EBSP) |
| 11.2.6 |
Replacing Cost of Aging EDS Machines |
| 11.2.7 |
TSA- Airport Cost Share Issue |
| 11.2.8 |
Life Cycle cost |
| 11.2.9 |
Screening Technology Maintenance & Utilities Program |
| 11.2.10 |
Aviation Regulation and Other Enforcement Programs |
| 11.2.11 |
Airport Management, IT and Support Program |
| 11.2.12 |
Air Cargo Security Program |
| 11.2.13 |
Secure Flight Program |
| 11.2.14 |
Transportation Security Support Programs |
| 11.3 |
Passenger Baggage Screening Data [M] by 514 U.S. Airports |
| 11.4 |
2011-2013 Market Data |
| 11.5 |
U.S. Tomographic Explosives Detection Systems Market |
| 11.5.1 |
Market Forecast – 2014-2020 |
| 11.5.2 |
Market Dynamics – 2014-2020 |
| 11.5.3 |
Market Breakdown – 2014-2020 |
| 11.6 |
U.S. Tomographic Explosives Detection Systems Vertical Markets |
| 11.6.1 |
U.S. EDS Equipment Market – 2014-2020 |
| 11.6.2 |
U.S. EDS Installation Market – 2014-2020 |
| 11.6.3 |
U.S. Baggage Handling Systems Market – 2014-2020 |
| 12 |
Canada Tomographic Explosives Detection Systems Market – 2014-2020 |
| 12.1 |
Geopolitical Background |
| 12.1.1 |
Facts & Figures |
| 12.1.2 |
Canadian Economy |
| 12.1.3 |
Canada Security Market |
| 12.2 |
Canada Counterterrorism & Law Enforcement |
| 12.3 |
Canada HLS & Public Safety Agencies |
| 12.4 |
Canada Aviation Security |
| 12.4.1 |
Air Travelers Security Charge |
| 12.4.2 |
Air Cargo Screening |
| 12.4.3 |
Passenger Baggage-Luggage Screening by Airports |
| 12.5 |
Canada Tomographic Explosives Detection Systems Market |
| 12.5.1 |
Market Forecast – 2014-2020 |
| 12.5.2 |
Market Dynamics – 2014-2020 |
| 12.5.3 |
Market Breakdown – 2014-2020 |
| 12.6 |
Canada Tomographic Explosives Detection Systems Vertical Markets |
| 12.6.1 |
Canada EDS Equipment Market – 2014-2020 |
| 12.6.2 |
Canada EDS Installation Market – 2014-2020 |
| 12.6.3 |
Canada Baggage Handling Systems Market – 2014-2020 |
| 13 |
Mexico & Brazil Tomographic Explosives Detection Systems Market – 2014-2020 |
| 13.1 |
Mexico Market Background |
| 13.1.1 |
Facts & Figures |
| 13.1.2 |
Mexico Security Market |
| 13.1.3 |
Mexico Security Industry |
| 13.1.4 |
Terror & Crime in Mexico |
| 13.1.4.1 |
Terror in Mexico |
| 13.1.4.2 |
Crime in Mexico |
| 13.1.5 |
Mexico HLS & Public Safety Agencies |
| 13.1.6 |
Passenger Baggage-Luggage Screening by Airports |
| 13.2 |
Brazil Market Background |
| 13.2.1 |
Facts & Figures |
| 13.2.2 |
Brazil Geopolitical Analysis |
| 13.2.3 |
Security Market |
| 13.2.4 |
Terror & Crime in Brazil |
| 13.2.4.1 |
Crime |
| 13.2.4.2 |
Counterterrorism-Related Activities |
| 13.2.5 |
Legislation & Law Enforcement |
| 13.2.6 |
Brazil HLS & Public Safety Agencies |
| 13.2.7 |
Brazil Aviation Security Market Background |
| 13.2.8 |
Passenger Baggage-Luggage Screening by Airports |
| 13.3 |
Mexico and Brazil Tomographic Explosives Detection Systems Market |
| 13.3.1 |
Market Forecast – 2014-2020 |
| 13.3.2 |
Market Dynamics – 2014-2020 |
| 13.3.3 |
Market Breakdown – 2014-2020 |
| 13.4 |
Mexico and Brazil Tomographic Explosives Detection Systems Vertical Markets |
| 13.4.1 |
Mexico and Brazil EDS Equipment Market – 2014-2020 |
| 13.4.2 |
Mexico and Brazil EDS Installation Market – 2014-2020 |
| 13.4.3 |
Mexico and Brazil Baggage Handling Systems Market – 2014-2020 |
| 14 |
U.K., Germany, France, Spain & Italy Tomographic Explosives Detection Systems Market – 2014-2020 |
| 14.1 |
U.K. Tomographic EDS & BHS Market Background |
| 14.1.1 |
Facts & Figures |
| 14.1.2 |
Economy |
| 14.1.3 |
U.K. Security Market |
| 14.1.4 |
U.K. Security Industry |
| 14.1.5 |
Terror & Crime in the U.K. |
| 14.1.5.1 |
Countering International Terrorism |
| 14.1.6 |
Legislation & Law Enforcement |
| 14.1.7 |
U.K. HLS & Public Safety Agencies |
| 14.1.8 |
U.K. Aviation Security Market Background |
| 14.1.8.1 |
Passengers baggage-Luggage Screening by Airports |
| 14.2 |
Germany Tomographic EDS & BHS Background |
| 14.2.1 |
Facts & Figures |
| 14.2.2 |
Germany Short Range Geopolitical Outlook |
| 14.2.3 |
Economy |
| 14.2.4 |
Security Market |
| 14.2.5 |
Security Industry |
| 14.2.6 |
Terror & Crime in Germany |
| 14.2.7 |
Germany HLS & Public Safety Agencies |
| 14.2.8 |
Germany Aviation Security Market Background |
| 14.2.8.1 |
Passenger baggage-Luggage Screening by Airports |
| 14.3 |
France Tomographic EDS & BHS Market Background |
| 14.3.1 |
Facts & Figures |
| 14.3.2 |
Economy |
| 14.3.3 |
Security Market |
| 14.3.4 |
HLS Market |
| 14.3.5 |
France Security Industry Companies |
| 14.3.6 |
Terror & Crime in France |
| 14.3.7 |
Legislation & Law Enforcement |
| 14.3.8 |
France HLS & Public Safety Agencies |
| 14.3.9 |
France Aviation Security Market Background |
| 14.3.9.1 |
Passenger baggage-Luggage Screening by Airports |
| 14.4 |
Spain Tomographic EDS & BHS Market Background |
| 14.4.1 |
Facts & Figures |
| 14.4.2 |
Economy |
| 14.4.3 |
Spain Security Market |
| 14.4.4 |
Terror & Crime in Spain |
| 14.4.4.1 |
Terror in Spain |
| 14.4.4.2 |
2012 Terrorist Incidents |
| 14.4.5 |
Legislation & Law Enforcement |
| 14.4.6 |
Spain HLS & Public Safety Agencies |
| 14.4.7 |
Spain Aviation Security Market Background |
| 14.4.8 |
Passenger baggage-Luggage Screening by Airports |
| 14.5 |
Italy Tomographic EDS & BHS Market Background |
| 14.5.1 |
Facts & Figures |
| 14.5.1.1 |
Economy |
| 14.5.2 |
Security Market |
| 14.5.3 |
Security Industry |
| 14.5.4 |
Terror & Crime in Italy |
| 14.5.5 |
Legislation & Law Enforcement |
| 14.5.6 |
Italy HLS & Public Safety Agencies |
| 14.5.7 |
Italy Aviation Security Market Background |
| 14.5.7.1 |
Passenger baggage-Luggage Screening by Airports |
| 14.6 |
U.K., Germany, France, Spain and Italy Tomographic Explosives Detection Systems Market |
| 14.6.1 |
Market Forecast – 2014-2020 |
| 14.6.2 |
Market Dynamics – 2014-2020 |
| 14.6.3 |
Market Breakdown – 2014-2020 |
| 14.7 |
U.K., Germany, France, Spain and Italy Tomographic Explosives Detection Systems Vertical Markets |
| 14.7.1 |
U.K., Germany, France, Spain and Italy EDS Equipment Market – 2014-2020 |
| 14.7.2 |
U.K., Germany, France, Spain and Italy EDS Installation Market – 2014-2020 |
| 14.7.3 |
U.K., Germany, France, Spain and Italy Baggage Handling Systems Market – 2014-2020 |
| 15 |
Turkey, Israel, Saudi Arabia, UAE and Qatar Tomographic Explosives Detection Systems Market – 2014-2020 |
| 15.1 |
Turkey |
| 15.1.1 |
Facts & Figures |
| 15.1.2 |
Turkey’s Security Market |
| 15.1.3 |
Turkey’s Security Industry |
| 15.1.4 |
Terror & Crime in Turkey |
| 15.1.5 |
2012 Terrorist Incidents |
| 15.1.6 |
Legislation & Law Enforcement |
| 15.1.7 |
Turkey HLS & Public Safety Agencies |
| 15.1.8 |
Turkey Aviation Security Market Background |
| 15.1.8.1 |
Passenger Baggage-Luggage Screening by Airports |
| 15.2 |
Israel Tomographic EDS & BHS Market Background |
| 15.2.1 |
Passenger Baggage-Luggage Screening by Airports |
| 15.3 |
Qatar Market Background |
| 15.3.1 |
Qatar Passenger Baggage-Luggage Screening by Airports |
| 15.4 |
Saudi Arabia Market Background |
| 15.4.1 |
Economy |
| 15.4.2 |
Terror in Saudi Arabia |
| 15.4.2.1 |
2012 Terrorist Incidents |
| 15.4.3 |
Legislation & Law Enforcement |
| 15.4.4 |
Saudi Arabia HLS & Public Safety Agencies |
| 15.4.5 |
Saudi Arabia Aviation Security Market Background |
| 15.4.6 |
Passenger Baggage-Luggage Screening by Airports |
| 15.5 |
UAE X-ray Security Screening Market – 2014-2020 |
| 15.5.1 |
Facts & Figures |
| 15.5.2 |
Economy |
| 15.5.3 |
U.A.E. Security Market |
| 15.5.4 |
Counterterrorism |
| 15.5.5 |
Legislation & Law Enforcement |
| 15.5.6 |
U.A.E. HLS Agencies |
| 15.5.7 |
UAE Aviation Security Market Background |
| 15.5.8 |
Dubai Airports Expansion Plan 2020 |
| 15.5.9 |
Augmented Baggage Scanning Machines |
| 15.5.10 |
Passenger Baggage-Luggage Screening by Airports |
| 15.6 |
Turkey, Israel, Saudi Arabia, UAE and Qatar Tomographic Explosives Detection Systems Market |
| 15.6.1 |
Market Forecast – 2014-2020 |
| 15.6.2 |
Market Dynamics – 2014-2020 |
| 15.6.3 |
Market Breakdown – 2014-2020 |
| 15.7 |
Turkey, Israel, Saudi Arabia, UAE and Qatar Tomographic Explosives Detection Systems Vertical Markets |
| 15.7.1 |
Turkey, Israel, Saudi Arabia, UAE and Qatar EDS Equipment Market – 2014-2020 |
| 15.7.2 |
Turkey, Israel, Saudi Arabia, UAE and Qatar EDS Installation Market – 2014-2020 |
| 15.7.3 |
Turkey, Israel, Saudi Arabia, UAE and Qatar Baggage Handling Systems Market – 2014-2020 |
| 16 |
China Tomographic Explosives Detection Systems Market – 2014-2020 |
| 16.1 |
Geopolitical Background |
| 16.1.1 |
Facts & Figures |
| 16.1.2 |
Economy |
| 16.1.3 |
China Security Market |
| 16.1.4 |
Terror |
| 16.2 |
China HLS & Public Safety Agencies |
| 16.2.1 |
China Ministry of State Security |
| 16.3 |
China Aviation Security Market Background |
| 16.3.1 |
Passenger baggage-Luggage Screening by Airports |
| 16.4 |
China Tomographic Explosives Detection Systems Market |
| 16.4.1 |
Market Forecast – 2014-2020 |
| 16.4.2 |
Market Dynamics – 2014-2020 |
| 16.4.3 |
Market Breakdown – 2014-2020 |
| 16.5 |
China Tomographic Explosives Detection Systems Vertical Markets |
| 16.5.1 |
China EDS Equipment Market – 2014-2020 |
| 16.5.2 |
China EDS Installation Market – 2014-2020 |
| 16.5.3 |
China Baggage Handling Systems Market – 2014-2020 |
| 17 |
Japan Tomographic Explosives Detection Systems Market – 2014-2020 |
| 17.1 |
Facts & Figures |
| 17.2 |
Economy |
| 17.3 |
Security Market |
| 17.4 |
Japan Security Industry |
| 17.5 |
Japan HLS & Public Safety Agencies |
| 17.6 |
Japan Aviation Security Market Background |
| 17.6.1 |
Passenger Baggage-Luggage Screening by Airports |
| 17.7 |
Japan Tomographic Explosives Detection Systems Market |
| 17.7.1 |
Market Forecast – 2014-2020 |
| 17.7.2 |
Market Dynamics – 2014-2020 |
| 17.7.3 |
Market Breakdown – 2014-2020 |
| 17.8 |
Japan Tomographic Explosives Detection Systems Vertical Markets |
| 17.8.1 |
Japan EDS Equipment Market – 2014-2020 |
| 17.8.2 |
Japan EDS Installation Market – 2014-2020 |
| 17.8.3 |
Japan Baggage Handling Systems Market – 2014-2020 |
| 18 |
India, South Korea, Indonesia and Australia Tomographic Explosives Detection Systems Market – 2014-2020 |
| 18.1 |
Australia EDS & BHS Market Background |
| 18.1.1 |
Geopolitical Background |
| 18.1.2 |
Economy |
| 18.1.3 |
Terror in Australia |
| 18.1.4 |
Australia HLS & Public Safety Agencies |
| 18.1.5 |
Australia Passenger baggage-Luggage Screening by Airports |
| 18.2 |
India EDS & BHS Market Background |
| 18.2.1 |
Geopolitical Background |
| 18.2.2 |
India Short Range Geopolitical Outlook |
| 18.2.3 |
Economy |
| 18.2.4 |
Security Industry |
| 18.2.5 |
Security Market |
| 18.2.6 |
Terror in India |
| 18.2.7 |
Legislation & Law Enforcement |
| 18.2.8 |
India HLS & Public Safety Agencies |
| 18.3 |
India Aviation Security Market Background |
| 18.4 |
Indonesia EDS & BHS Market Background |
| 18.4.1 |
Facts & Figures |
| 18.4.2 |
Economy |
| 18.4.3 |
Security Market |
| 18.4.4 |
Counterterrorism |
| 18.4.5 |
2012 Terrorist Incidents |
| 18.4.6 |
Legislation & Law Enforcement |
| 18.4.7 |
Indonesia HLS & Public Safety Agencies |
| 18.4.8 |
Indonesia Passenger baggage-Luggage Screening by Airports |
| 18.5 |
South Korea EDS & BHS Market Background |
| 18.5.1 |
Facts & Figures |
| 18.5.2 |
Economy |
| 18.5.3 |
South Korea Security Market |
| 18.5.4 |
Counterterrorism in South Korea |
| 18.5.5 |
South Korea HLS & Public Safety Agencies |
| 18.5.6 |
South Korea Aviation Security Market Background |
| 18.6 |
India, South Korea, Indonesia and Australia Tomographic Explosives Detection Systems Market |
| 18.6.1 |
Market Forecast – 2014-2020 |
| 18.6.2 |
Market Dynamics – 2014-2020 |
| 18.6.3 |
Market Breakdown – 2014-2020 |
| 18.7 |
India, South Korea, Indonesia and Australia Tomographic Explosives Detection Systems Vertical Markets |
| 18.7.1 |
India, South Korea, Indonesia and Australia EDS Equipment Market – 2014-2020 |
| 18.7.2 |
India, South Korea, Indonesia and Australia EDS Installation Market – 2014-2020 |
| 18.7.3 |
India, South Korea, Indonesia and Australia Baggage Handling Systems Market – 2014-2020 |
| 19 |
R.O.W. Tomographic Explosives Detection Systems Market – 2014-2020 |
| 19.1 |
R.O.W. Tomographic Explosives Detection Systems Market |
| 19.1.1 |
Market Forecast – 2014-2020 |
| 19.1.2 |
Market Dynamics – 2014-2020 |
| 19.1.3 |
Market Breakdown – 2014-2020 |
| 19.2 |
R.O.W. Tomographic Explosives Detection Systems Vertical Markets |
| 19.2.1 |
R.O.W. EDS Equipment Market – 2014-2020 |
| 19.2.2 |
R.O.W. EDS Installation Market – 2014-2020 |
| 19.2.3 |
R.O.W. Baggage Handling Systems Market – 2014-2020 |
| |
VERTICAL MARKETS |
| 20 |
Global EDS Equipment Market – 2014-2020 |
| 20.1 |
Market by Country |
| 20.2 |
Market Dynamics – 2014-2020 |
| 20.3 |
Market Breakdown – 2014-2020 |
| 21 |
Global EDS Installation Market – 2014-2020 |
| 21.1 |
Market by Country |
| 21.2 |
Market Dynamics – 2014-2020 |
| 21.2.1 |
Market Breakdown – 2014-2020 |
| 22 |
Global Baggage Handling Systems Market – 2014-2020 |
| 22.1 |
Market by Country |
| 22.2 |
Market Dynamics – 2014-2020 |
| 22.3 |
Market Breakdown – 2014-2020 |
| |
PRODUCTS |
| 23 |
EDS, Costs and Prices |
| 23.1 |
EDS Prices |
| 23.2 |
Installation Cost |
| 23.3 |
Refurbishment & Upgrade Cost |
| 23.4 |
Building and Checked Luggage Handling System Modification Market |
| 23.5 |
EDS Service Market |
| 23.6 |
Baggage Handling Systems (BHS) Service Market |
| 23.7 |
Infrastructure Modification Costs for EDS Replacement |
| 24 |
EDS Products Performance and Pricing Comparison Data |
| 24.1 |
Analogic – EDS Products Performance and Pricing Comparison Data |
| 24.2 |
Morpho Detection – EDS Products Performance and Pricing Comparison Data |
| 24.3 |
L-3 – EDS Products Performance and Pricing Comparison Data |
| 24.4 |
Reveal – Tomographic EDS: Products Performance and Pricing Comparison Data |
| 25 |
EDS Pricing Trends – 2011-2020 |
| |
VENDORS |
| 26 |
Leading Vendors |
| 26.1 |
Analogic Corporation |
| 26.1.1 |
Company Profile |
| 26.1.2 |
Tomographic Explosives Detection Systems |
| 26.1.2.1 |
eXaminer SX |
| 26.1.2.2 |
eXaminer 3DX |
| 26.1.2.3 |
eXaminer 3DX-ES |
| 26.1.2.4 |
eXaminer XLB. |
| 26.1.2.5 |
OnGuard Cobra |
| 26.1.2.6 |
OnGuard DualUse |
| 26.2 |
Eurologix Security Ltd |
| 26.2.1 |
Company Profile |
| 26.2.2 |
3D Explosives Detection Systems |
| 26.3 |
L-3 Communications Security & Detection Systems |
| 26.3.1 |
Company Profile |
| 26.3.2 |
Tomographic Explosives Detection Systems |
| 26.3.3 |
eXaminer SX |
| 26.3.4 |
eXaminer 3DX |
| 26.3.5 |
eXaminer 3DX-ES |
| 26.3.6 |
eXaminer XLB. |
| 26.3.7 |
eXaminer 3DX Upgrades and Options |
| 26.3.8 |
MVT-HR |
| 26.4 |
Morpho Detection Inc. |
| 26.4.1 |
Company Profile |
| 26.4.2 |
CTX Tomographic Explosives Detection Systems |
| 26.4.2.1 |
CTX 2500 |
| 26.4.2.2 |
CTX 5500 DS |
| 26.4.2.3 |
CTX 5800 DS |
| 26.4.2.4 |
CTX 9400 DSi |
| 26.4.2.5 |
CTX 9800 DSi |
| 26.4.3 |
XRD 3500 Diffraction Screening Technology |
| 26.4.4 |
Dual Modality: EDS & X-ray Diffraction System |
| 26.4.5 |
EDS Options and Accessories |
| 26.4.5.1 |
MUXv1 and MUXv2 |
| 26.4.5.2 |
Operator Testing Equipment |
| 26.5 |
Nuctech Co. Ltd |
| 26.5.1 |
Company Profile |
| 26.5.2 |
Tomographic Explosives Detection Systems |
| 26.5.2.1 |
XT2080 |
| 26.5.2.2 |
XT2080AD |
| 26.5.2.3 |
XT2100 |
| 26.6 |
Rapiscan Security Products, Inc. |
| 26.6.1 |
Company Profile |
| 26.6.2 |
Tomographic Explosives Detection Systems |
| 26.6.2.1 |
Rapiscan RTT 110 |
| 26.6.2.2 |
Rapiscan RTT 80 |
| 26.7 |
Reveal Imaging Technologies, Inc |
| 26.7.1 |
Company Profile |
| 26.7.2 |
Tomographic Explosives Detection Systems |
| 26.7.2.1 |
CT-80DR |
| 26.7.2.2 |
CT-80XL |
| 26.7.2.3 |
Reveal CT-800 |
| 26.7.2.4 |
ArrayCT 6040, ArrayCT 7555 |
| 26.7.2.5 |
Reveal Mobile EDS |
| |
APPENDICES |
| 27 |
Appendix A: Glossary |
| 28 |
Appendix B: Checked Luggage EDS & ETD Screening Configurations |
| 28.1.1 |
Scope |
| 28.1.2 |
Configuration 1: High-Volume In-Line EDS |
| 28.1.3 |
Configuration 2: Medium-Volume In-Line EDS |
| 28.1.4 |
Configuration 3: Mini In-line EDS |
| 28.1.5 |
Configuration 4: Stand-Alone EDS |
| 28.1.6 |
Configuration 5: Stand-Alone ETD (w/o EDS) |
| 28.1.7 |
Alarm Resolution |
| 28.2 |
Carry-on X-Ray and EDS Bag Screening |
| 29 |
Appendix C: Air Cargo Screening |
| 29.1.1 |
Background |
| 29.1.2 |
Cargo Security Policy |
| 30 |
The Report Research Methodology |
| 30.1 |
Report Structure |
| 30.2 |
Assumptions |
| 30.3 |
Research Methodology |
| 30.4 |
Who Is This Report For? |
| 30.5 |
Research Methods |
| 30.6 |
Terms of Reference |
| 31 |
Disclaimer & Copyright |