Top
HSRCU.S. Homeland Defense & Counter-Terror Intelligence Market 2011-2014
Placeholder

U.S. Homeland Defense & Counter-Terror Intelligence Market 2011-2014

2011-2014 Market: $89 Billion, 35 Submarkets

  • Q4 2010
  • 100
  • 97
    • 2450 $
    • 3450 $
    • 5950 $
    • 6000 $

    Small Businesses, Startups & Academia - Up to 50% Off

Quantity
IBM
Amazon
Sandia National Lab
HITACHI
Thales
Smiths Detection
Nuctech
Korea Internet & Security Agency
L3Harris
Huawei
Leidos
NEC
Toshiba
Deloitte
MAG

Want to customize this report?

If you purchase this report, you are entitled to a 30% discount towards customizing it, to better fit your market research and strategic needs. Our Custom Research and Industry Insights Department will work with you to better understand your information gaps and strategic needs and will provide you with a tailor-made market research report within a short period of time.

Why Choose Us?

30+ Years of Experience
We are a multidisciplinary team of Transformational Technologies industry experts with over 30 years of experience.
Gold Standard
With over 950 private sector clients (73% repeat customers), including major defense and security vendors, and Forbes Global 2000 companies, HSRC earned the reputation as the industry’s Gold Standard for Transformational Technologies Market Reports.
Tailored Research Services
Provide you with clear, actionable recommendations designed to empower decision making and to help you exploit emerging opportunities in the Transformational Technologies industries.
Information Security
Your personal information is safe and secure.

From: $2,450

SKU: 2879 Category:

Description

HSRC’s newest release, U.S. Homeland Defense & Counter-Terror Intelligence Market 2011 2014, is the most comprehensive review of the world’s largest HLD and counter-terror intelligence market available today.


The report granular analysis covers more than 35 sub-markets
.
It offers for each sub-market: 2009-2010 description, analysis, funding and market size data, as well as 2011-2014 forecasts data and analysis.

The report forecasts that:

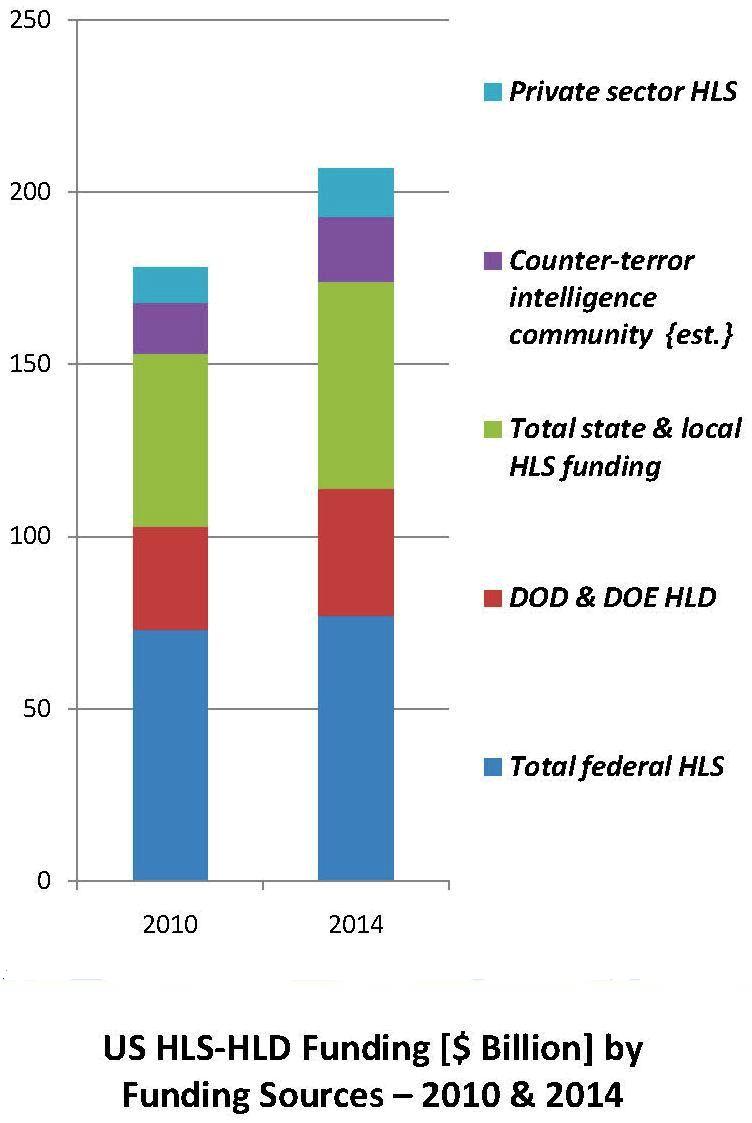
  • The U.S. HLD funding (including the DOD and the DOE) will grow at a CAGR of at least 3.6% from $30 billion in 2010 to $34.6 billion by 2014.
  • The HLS related counter-terror intelligence community funding will grow at a CAGR of at least 3.5% from $14.1 billion in 2010 to $16.2 billion by 2014.
  • The U.S. HLD market will grow from $14 billion in 2010 to $16.3 billion by 2014.
  • The HLS related counter-terror intelligence community market will grow from $6 billion in 2010 to $7.2 billion by 2014.
  • The U.S. armed forces and intelligence community will continue to play a vital role in securing the US through military missions overseas and by executing homeland defense (HLD), civil support (CS) missions and supporting emergency preparedness (EP) planning activities. Most of the CS and EP missions will be directed by the DHS. In case of a catastrophic event, under a presidential directive, the DOD and DOE will use their HLD assets (e.g., NORTHCOM) to support the locals and act as the lead agency.
  • An effective coordination among the 185 federal HLS, HLD and counter terror intelligence agencies and thousands of state, and local authorities will remain a mammoth undertaking. While the limited coordination is forecast to continue to plaque the creation of a cost- effective HLS-HLD meta-system, it will create a larger HLS-HLD market.

With more than 100 pages, 38 tables, 59 figures, including detailed information of over 35 sub-markets specific information regarding current and future business opportunities, this report provides essential market intelligence on approximately 45% of the global HLD and counter terror intelligence market.

Table of Contents

Download TOC as PDF
1 Executive Summary
1.1 Key Findings and Conclusions
1.2 US HLD and Counter-Terror Intelligence Funding Overview
1.3 US HLD and Counter-Terror Intelligence Market Overview
2 Introduction
2.1 Scope
2.2 The Report Scenario
2.3 Terms of Reference
3 US HLS-HLD Organization
3.1 US Federal HLS-HLD Structure
3.2 Interplay Between HLD, Intelligence Community and HLS Agencies
4 Homeland Defense (HLD) Market
4.1 Introduction
4.2 HLD Market Drivers
4.3 HLD Market Inhibitors
4.4 HLD Market SWOT Analysis
4.5 HLD Market Competitive Analysis
4.6 HLD Market Dynamics
4.7 DOD HLD Missions and Organizations
4.8 The Northern Command (NORTHCOM)
4.8.1 Northern Command’s HLD Missions
4.8.2 NORTHCOM’s Civil Support Missions
4.8.3 DOD’s Structure for Interagency Coordination of HLD & Civil Support Missions
4.8.4 HLD Strategic Concept
4.8.5 2011-2014 HLD Market Background
4.8.6 Enabling DOD HLD Capabilities
4.9 HLS-HLD National Response Plan
4.1 HLS-HLD CBRNE Consequence Management
4.10.1 HLD Airspace Alert Operations
4.11 DOD & DOE HLD Nuclear Weapons Security Programs & Markets
4.11.1 Air Force Nuclear Weapons Security: Military Personnel Program & Market – 2011-2014
4.11.2 Air Force Nuclear Weapons Security: Weapons Procurement Program & Market – 2011-2014
4.11.3 Air Force Nuclear Weapons Security: Operations & Equipment Maintenance Program & Market – 2011-2014
4.11.4 Air Force Nuclear Weapons Security: Construction Program & Market – 2011-2014
4.11.5 Air Force Nuclear Weapons Security: Other Programs & Markets – 2011-2014
4.11.6 Navy Nuclear Weapons Security: Operations & Systems Maintenance Program & Market – 2011-2014
4.11.7 Navy Nuclear Weapons Security: Construction Program & Market – 2011-2014
4.11.8 Navy Nuclear Weapons Security: Navy & Marine Corps Manpower Program & Market – 2011-2014
4.11.9 Navy Nuclear Weapons Security: Other Programs & Markets – 2011-2014
4.11.10 Navy Nuclear Weapons Security: Weapons Procurement Program & Market – 2011-2014
4.11.11 OST Nuclear Weapons Security: Mission Capacity Program & Market – 2011-2014
4.11.12 OST Nuclear Weapons Security: Program Management Program & Market – 2011-2014
4.11.13 OST Nuclear Weapons Security: Security Infrastructure Program & Market – 2011-2014
4.11.14 OST Nuclear Weapons Security: Security & Safety Capability Program & Market – 2011-2014
4.11.15 Pantex Nuclear Weapons Security: Security Personnel Program & Market – 2011-2014
4.11.16 Pantex Nuclear Weapons Security: Physical Security Program & Market – 2011-2014
4.11.17  Pantex Nuclear Weapons Security: Other Program & Market – 2011-2014
4.12 The US HLD Consolidated Spending and Market – 2011-2014
5 HLS Related Intelligence Community (IC) Market 2011-2014
5.1 Counter-Terror IC Market Drivers
5.2 Counter-Terror IC Market Inhibitors
5.3 Counter-Terror IC Market SWOT Analysis
5.4 Counter-Terror IC Market Competitive Analysis
5.5 Counter-Terror IC Market Dynamics
5.6 The US HLS Related Intelligence Community
5.6.1 The Office of the Director of National Intelligence
5.7 HLS Related IC Perimeter Security Market – 2011-2014
5.8 HLS related IC Information Technology Market – 2011-2014
5.8.1 HLS Related Intelligence Community IT
5.8.2 HLS related Managerial & Meta Systems Operation IT
5.8.3 IC Information Handling and Haring IT
5.8.4 HLS Related Information Technology Market – 2011-2010
5.9 Contracted HLS Related IC Professional Personnel Market -2011-2014
5.1 Contracted Guarding/Security Personnel Market – 2011-2014
5.11 Communication Equipment and Services Market – 2011-2014
5.12 Security Clearance Services Market – 2011-2014
5.13 Employee and Visitors Screening Market – 2011-2014
5.14 Contracted Services Market – 2011-2014
5.15 Business Opportunities and Challenges
5.16 Market Overview
5.17 Sub- Market Business Opportunities
5.18 Intelligence Contractors
5.19 Counter-Terror Intelligence Market – 2011-2014

Tables

Table 1 US HLS-HLD Outlay [$ Billion] by Funding Source – 2009-2014
Table 2 US HLS-HLD Outlay [% of Total HLS-HLD] by Funding Source – 2009-2014
Table 3 US HLS-HLD Market [$ Billion] by Sector – 2009-2014
Table 4 US HLS-HLD Market Share [%] by “Demand Side” Sector – 2009-2014
Table 5 Evolution of HLD Market Dynamics – 2010-2014
Table 6 DOD’s Structure for Interagency Coordination for HLD and Civil Support Missions
Table 7 HLS-HLD CBRN Terror Related Plans
Table 8 HLS-HLD Decontamination Personnel Capabilities for a Nuclear Detonation in a Major Metropolitan City
Table 9 Air Force Nuclear Weapons Security: Military Personnel Program Funding & Market – 2009-2014
Table 10 Air Force Nuclear Weapons Security: Weapons Procurement Program Funding & Market – 2009-2014
Table 11 Air Force Nuclear Weapons Security: Operations & Equipment Maintenance Program Funding & Market – 2009-2014
Table 12 Air Force Nuclear Weapons Security: Construction Program Funding & Market – 2009-2014
Table 13 Air Force Nuclear Weapons Security: Other Programs Funding & Market – 2009-2014
Table 14 Navy Nuclear Weapons Security: Operations & Systems Maintenance Program Funding & Market – 2009-2014
Table 15 Navy Nuclear Weapons Security: Construction Program Funding & Market -2009-2014
Table 16 Navy Nuclear Weapons Security: Navy & Marine Corps Manpower Program Funding & Market – 2009-2014
Table 17 Navy Nuclear Weapons Security: Other Programs Funding & Market – 2009-2014
Table 18 Navy Nuclear Weapons Security: Weapons Procurement Program Funding & Market – 2009-2014
Table 19 OST Nuclear Weapons Security: Mission Capacity Program Funding & Market – 2009-2014
Table 20 OST Nuclear Weapons Security: Program Management Program Funding & Market – 2009-2014
Table 21 OST Nuclear Weapons Security: Security Infrastructure Program Funding & Market – 2009-2014
Table 22 OST Nuclear Weapons Security: Security & Safety Capability Program Funding & Market – 2009-2014
Table 23 Pantex Nuclear Weapons Security: Security Personnel Program Funding & Market – 2009-2014
Table 24 Pantex Nuclear Weapons Security: Physical Security Program Funding & Market – 2009-2014
Table 25 Pantex Nuclear Weapons Security: Other Programs Funding & Market – 2009-2014
Table 26 US, HLD Outlay and Market [$ Billion] – 2009-2014
Table 27 Evolution of CT Intelligence Community Market Dynamics – 2010-2014
Table 28 HLS Related IC Perimeter Security Systems Market – 2009-2014
Table 29 HLS Related IC Information Technology Market – 2009-2014
Table 30 Contracted Professional Personnel Market – 2009-2014
Table 31 Contracted Guarding/Security Personnel Market – 2009-2014
Table 32 Communication Equipment and Services Market – 2009-2014
Table 33 Security Clearance Services Market – 2009-2014
Table 34 Employee and Visitors Screening Market – 2009-2014
Table 35 Contracted Services Market – 2009-2014
Table 36 CT Intelligence Sub-Market Business Opportunities
Table 37 Intelligence Contractors by Size and Activity
Table 38  US HLS Related Intelligence Funding and Market [$M] – 2009-2014

Figures

Figure 1 US HLS-HLD Spending [$ Billion] by Funding Sources – 2010 & 2014
Figure 2 US HLS-HLD Market [$ Billion] by Funding Sources – 2010 & 2014
Figure 3 US HLS-HLD Outlay [$ Billion] by Key Funding Source – 2009-2014
Figure 4 US HLS-HLD Outlay [$ Billion] by Detailed Funding Source – 2009 & 2014
Figure 5 US HLS-HLD Outlay [%] by Detailed Funding Source – 2009 & 2014
Figure 6 US HLS-HLD Market [$ Billion] by Key “Demand Side” Sectors – 2009-2014
Figure 7 US HLS-HLD Market [$ Billion] by “Demand Side” Sector – 2009 & 2014
Figure 8 US HLS-HLD Market Share [%] by “Demand Side” Sector – 2009 & 2014
Figure 9 US Federal HLS-HLD Structure-2010
Figure 10 HLS / HLD Responsibilities
Figure 11 DOD Homeland Security Paradigm
Figure 12 HLD Market SWOT Analysis
Figure 13 HLD Market Competitiveness Analysis
Figure 14 DOD’s Internal HLD Process for Responding to Requests-for-Assistance
Figure 15 DOD Resources HLD Application
Figure 16 NORTHCOM Organizational Chart
Figure 17 NORTHCOM’s Area of Responsibility
Figure 18 Homeland Defense and Civil Support Roadmap
Figure 19 Civil Support Hierarchy
Figure 20 DOD’s Structure for Interagency Coordination for HLD and Civil Support Missions
Figure 21 Strategic Concept of Layered HLD
Figure 22 Response Timeline for CBRN Terror Consequence Management
Figure 23 Locations of the Eighteen Airspace Alert Sites
Figure 24 Air Force Nuclear Weapons Security: Military Personnel Program Funding & Market – 2009-2014
Figure 25 Air Force Nuclear Weapons Security: Weapons Procurement Program Funding & Market – 2009-2014
Figure 26 Air Force Nuclear Weapons Security: Operations & Equipment Maintenance Program Funding & Market-2009-2014
Figure 27 Air Force Nuclear Weapons Security: Construction Program Funding & Market – 2009-2014
Figure 28 Air Force Nuclear Weapons Security: Other Programs Funding & Market -2009-2014
Figure 29 Navy Nuclear Weapons Security: Operations & Systems Maintenance Program Funding & Market – 2009-2014
Figure 30 Navy Nuclear Weapons Security: Construction Program Funding & Market -2009-2014
Figure 31 Navy Nuclear Weapons Security: Navy & Marine Corps Manpower Program Funding & Market – 2009-2014
Figure 32 Navy Nuclear Weapons Security: Other Programs Funding & Market – 2009-2014
Figure 33 Navy Nuclear Weapons Security: Weapons Procurement Program Funding & Market – 2009-2014
Figure 34 OST Nuclear Weapons Security: Mission Capacity Program Funding & Market – 2009-2014
Figure 35 OST Nuclear Weapons Security: Program Management Program Funding & Market – 2009-2014
Figure 36 OST Nuclear Weapons Security: Security Infrastructure Program Funding & Market – 2009-2014
Figure 37 OST Nuclear Weapons Security: Security & Safety Capability Program Funding & Market – 2009-2014
Figure 38 Pantex Nuclear Weapons Security: Security Personnel Program Funding & Market – 2009-2014
Figure 39 Pantex Nuclear Weapons Security: Physical Security Program Funding & Market – 2009-2014
Figure 40 Pantex Nuclear Weapons Security: Other Programs Funding & Market – 2009-2014
Figure 41 US, HLD Outlay and Market [$Billion] – 2009-2014
Figure 42 HLS Related Intelligence Community Market SWOT Analysis
Figure 43 CT Intelligence Community Market Competitive Analysis
Figure 44 The Intelligence Cycle
Figure 45 US National Intelligence Service Organization Chart
Figure 46 The Office of the Director of National Intelligence Organization Chart
Figure 47 HLS Related IC Perimeter Security Systems Market – 2009-2014
Figure 48 The DHS Intelligence Organization
Figure 49 Information Technology Market – 2009-2014
Figure 50 Contracted Professional Personnel Market – 2009-2014
Figure 51 Contracted Guarding/Security Personnel Market – 2009-2014
Figure 52 Communication Equipment and Services Market – 2009-2014
Figure 53 Security Clearance Services Market – 2009-2014
Figure 54 Employee and Visitors Screening Market – 2009-2014
Figure 55 Contracted Services Market – 2009-2014
Figure 56 Intelligence & Warning – Market Challenges, Drivers, Inhibitors and Technology Challenges
Figure 57 Intelligence Contractors by Company Size
Figure 58 Intelligence Contractors by Activity
Figure 59  Estimated US HLS related Intelligence Funding & Market [$Million] – 2009-2014

Questions about this report?

Contact Sales: 1-571-527-1010 or Analysts: 1-202-455-0966

  • Have a question about U.S. Homeland Defense & Counter-Terror Intelligence Market 2011-2014
    Please fill out all fields in the form below and click "Submit" to send your question.
    Our representative will review your question and contact you with an answer as soon as possible.
  • 2+2=
  • This field is for validation purposes and should be left unchanged.
1
Interested in this report? Need more information?
X
Powered By