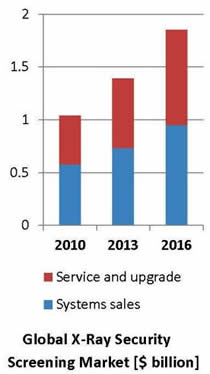
| Figure 1 |
Cabin Bags Screening In the Ensemble of Airport Security Means |
| Figure 2 |
Global X-ray Security Screening Systems Sales and Service Market Structure [%] by Application: 2010&2016 |
| Figure 3 |
Global X-ray Security Screening Systems Sales and Service Market Structure [%] by Country: 2010&2016 |
| Figure 4 |
Airport Explosives Threats Vectors |
| Figure 5 |
X-ray Security Screening Market SWOT Analysis |
| Figure 6 |
X-ray Security Screening Market Competitive Analysis |
| Figure 7 |
Explosive Materials Classification |
| Figure 8 |
Major Security Screening Technologies: Bulk vs. Trace |
| Figure 9 |
X-ray Conveyor-Based Screening Systems Principles of Operation |
| Figure 10 |
Conventional X-ray |
| Figure 11 |
Dual Energy X-ray |
| Figure 12 |
Material Differentiation by Dual Energy X-ray |
| Figure 13 |
Dual Energy Z Map |
| Figure 14 |
Quasi Dual Energy X-ray |
| Figure 15 |
Variable View X-ray Option |
| Figure 16 |
Backscatter Cargo Screening X-ray |
| Figure 17 |
Coherent X-ray Scheme |
| Figure 18 |
Global X-ray Security Screening Systems Sales and Service Market Fragmentation [%] – 2010 & 2016 |
| Figure 19 |
Global X-ray Security Screening Systems Sales and Service Market [$ Million] by Application – 2010-2016 |
| Figure 20 |
Global X-ray Security Screening Systems Sales and Service Market Structure [%] by Application: 2010&2016 |
| Figure 21 |
Global X-ray Security Screening Systems Sales [$ Million] – 2010-2016 |
| Figure 22 |
Global X-ray Security Screening Systems Service and Upgrade Market [$Million] – 2010-2016 |
| Figure 23 |
Global Aviation Security X-ray Security Screening Market [$M] – 2010-2016 |
| Figure 24 |
Global Aviation Security X-ray Systems and Service Market Structure [%] – 2010 & 2016 |
| Figure 25 |
Global Secured Facilities X-ray Security Screening Market [$M] – 2010-2016 |
| Figure 26 |
Global Secured Facilities X-ray Systems and Service Market Structure [%] – 2010&2016 |
| Figure 27 |
Global Other Applications X-ray Security Screening Market [$M] – 2010-2016 |
| Figure 28 |
Global Other Applications X-ray Systems and Service Market Structure [%] – 2010&2016 |
| Figure 29 |
Global X-ray Security Screening Systems Sales and Service Market [$ Million] by Country – 2010-2016 |
| Figure 30 |
Global X-ray Security Screening Systems Sales and Service Market Structure [%] by Country: 2010&2016 |
| Figure 31 |
Global X-ray Security Screening Systems Sales [$ Million] by Country – 2010-2016 |
| Figure 32 |
Global X-ray Security Screening Systems Sales Structure [%] by Country: 2010 & 2016 |
| Figure 33 |
Global X-ray Security Screening Systems Service and Upgrade Market [$ Million] by Country – 2010-2016 |
| Figure 34 |
Global X-ray Security Screening Systems Service and Upgrade Market Structure [%] by Country: 2010&2016 |
| Figure 35 |
U.S. X-ray Security Screening Systems Sales and Service Market [$ Million] – 2010-2016 |
| Figure 36 |
U.S. X-ray Security Screening Systems Sales and Service Market Structure [%] by Sub-market: 2010 & 2016 |
| Figure 37 |
U.S. X-ray Security Screening Systems Sales and Service Market Fragmentation [%] – 2010 & 2016 |
| Figure 38 |
U.S. X-ray Security Screening Systems Sales [$ Million] – 2010-2016 |
| Figure 39 |
U.S. X-ray Security Screening Systems Service and Upgrade Market [$ Million] – 2010-2016 |
| Figure 40 |
U.S. Air Cargo X-ray Security Screening Market [$M] – 2010-2016 |
| Figure 41 |
U.S. Air Cargo X-ray Systems and Service Market Structure [%] – 2010 & 2016 |
| Figure 42 |
U.S. Airport Cabin Baggage X-ray Screening Market [$M] – 2010-2016 |
| Figure 43 |
U.S. Airport Cabin Baggage X-ray Systems and Service Market Structure [%] – 2010 & 2016 |
| Figure 44 |
Secured Facilities X-ray Security Screening Market [$M] – 2010 -2016 |
| Figure 45 |
Secured Facilities X-ray Screening Systems and Service Market Structure [%] – 2010 & 2016 |
| Figure 46 |
U.S. Postal Items X-ray Screening Market [$M] Outlook – 2010-2016 |
| Figure 47 |
Postal Items X-ray Systems and Service Market [%] Structure – 2010 & 2016 |
| Figure 48 |
U.S. Supply Chain Cargo X-ray Security Screening Market [$M] – 2010-2016 |
| Figure 49 |
U.S. Supply Chain Cargo X-ray Screening Systems and Service Market Structure [%] – 2010 & 2016 |
| Figure 50 |
U.S. People Screening AIT X-ray Security Screening Market [$M] – 2010-2016 |
| Figure 51 |
U.S. People Screening AIT X-ray Security Screening Market Structure [%] – 2010 & 2016 |
| Figure 52 |
UK, Germany, France, Italy and Spain X-ray Security Screening Market (incl. Systems Sales, Service and Upgrade) Structure [%] – 2010 & 2016 |
| Figure 53 |
UK, Germany, France, Italy and Spain X-ray Security Screening Market (incl. Systems Sales, Service and Upgrade) [$ Million] by Application – 2010-2016 |
| Figure 54 |
UK, Germany, France, Italy and Spain X-ray Security Screening System Sales [$ Million] – 2010-2016 |
| Figure 55 |
UK, Germany, France, Italy and Spain X-ray Security Screening Systems Service and Upgrade Market [$ Million] – 2010-2016 |
| Figure 56 |
UK, Germany, France, Italy and Spain Aviation Security X-ray Security Screening Market [$M] – 2010-2016 |
| Figure 57 |
UK, Germany, France, Italy and Spain Aviation Security X-ray Security Screening Market Structure[%] – 2010&2016 |
| Figure 58 |
UK, Germany, France, Italy and Spain Secured Facilities X-ray Security Screening Market [$M] – 2010-2016 |
| Figure 59 |
UK, Germany, France, Italy and Spain Secured Facilities X-ray Security Screening Market Structure[%] – 2010&2016 |
| Figure 60 |
UK, Germany, France, Italy and Spain Other Applications X-ray Security Screening Market [$M] – 2010-2016 |
| Figure 61 |
UK, Germany, France, Italy and Spain Other Applications X-ray Security Screening Market Structure [%] – 2010&2016 |
| Figure 62 |
Turkey, Israel, Saudi Arabia and UAE X-ray Security Screening Market (incl. Systems Sales, Service and Upgrade) Structure [%] – 2010 & 2016 |
| Figure 63 |
Turkey, Israel, Saudi Arabia and UAE X-ray Security Screening Market (incl. Systems Sales, Service and Upgrade) [$ Million] by Application – 2010-2016 |
| Figure 64 |
Turkey, Israel, Saudi Arabia and UAE X-ray Security Screening System Sales [$ Million] – 2010-2016 |
| Figure 65 |
Turkey, Israel, Saudi Arabia and UAE X-ray Security Screening Systems Service and Upgrade Market [$Million] – 2010-2016 |
| Figure 66 |
Turkey, Israel, Saudi Arabia and UAE Aviation Security X-ray Security Screening Market [$M] – 2010-2016 |
| Figure 67 |
Turkey, Israel, Saudi Arabia and UAE Aviation Security X-ray Security Screening Market Structure[%] – 2010&2016 |
| Figure 68 |
Turkey, Israel, Saudi Arabia and UAE Secured Facilities X-ray Security Screening Market [$M] – 2010-2016 |
| Figure 69 |
Turkey, Israel, Saudi Arabia and UAE Secured Facilities X-ray Security Screening Market Structure[%] – 2010&2016 |
| Figure 70 |
Turkey, Israel, Saudi Arabia and UAE Other Applications X-ray Security Screening Market [$M] -2010-2016 |
| Figure 71 |
Turkey, Israel, Saudi Arabia and UAE Other Applications X-ray Security Screening Market Structure[%] – 2010&2016 |
| Figure 72 |
China and India X-ray Security Screening Market (incl. Systems Sales, Service and Upgrade)Structure [%] – 2010&2016 |
| Figure 73 |
China and India X-ray Security Screening Market (incl. Systems Sales, Service and Upgrade) [$Million] by Application – 2010-2016 |
| Figure 74 |
China and India X-ray Security Screening System Sales [$ Million] – 2010-2016 |
| Figure 75 |
China and India X-ray Security Screening Systems Service and Upgrade Market [$ Million] – 2010-2016 |
| Figure 76 |
China and India Aviation Security X-ray Security Screening Market [$M] – 2010-2016 |
| Figure 77 |
China and India Aviation Security X-ray Security Screening Market Structure [%] – 2010 & 2016 |
| Figure 78 |
China and India Secured Facilities X-ray Security Screening Market [$M] – 2010-2016 |
| Figure 79 |
China and India Secured Facilities X-ray Security Screening Market Structure [%] – 2010 & 2016 |
| Figure 80 |
China and India Other Applications X-ray Security Screening Market [$M] – 2010-2016 |
| Figure 81 |
China and India Other Applications X-ray Security Screening Market Structure [%] – 2010 & 2016 |
| Figure 82 |
Japan, Korea, Australia, Malaysia and Singapore X-ray Security Screening Market (incl. Systems Sales, Service and Upgrade) Structure [%] – 2010 & 2016 |
| Figure 83 |
Japan, Korea, Australia, Malaysia and Singapore X-ray Security Screening Market (incl. Systems Sales, Service and Upgrade) [$ Million] by Application – 2010-2016 |
| Figure 84 |
Japan, Korea, Australia, Malaysia and Singapore X-ray Security Screening System Sales [$ Million] – 2010-2016 |
| Figure 85 |
Japan, Korea, Australia, Malaysia and Singapore X-ray Security Screening Systems Service and Upgrade Market [$ Million] – 2010-2016 |
| Figure 86 |
Japan, Korea, Australia, Malaysia and Singapore Aviation Security X-ray Security Screening
Market [$M] – 2010-2016 |
| Figure 87 |
Japan, Korea, Australia, Malaysia and Singapore Aviation Security X-ray Security Screening Market Structure [%] – 2010 & 2016 |
| Figure 88 |
Japan, Korea, Australia, Malaysia and Singapore Secured Facilities X-ray Security Screening Market [$M] – 2010-2016 |
| Figure 89 |
Japan, Korea, Australia, Malaysia and Singapore Secured Facilities X-ray Security Screening Market Structure [%] – 2010 & 2016 |
| Figure 90 |
Japan, Korea, Australia, Malaysia and Singapore Other Applications X-ray Security Screening Market [$M] – 2010-2016 |
| Figure 91 |
Japan, Korea, Australia, Malaysia and Singapore Other Applications X-ray Security Screening Market Structure [%] – 2010 & 2016 |
| Figure 92 |
Brazil, Argentina and Mexico X-ray Security Screening Market (incl. Systems Sales, Service and Upgrade) Structure [%] – 2010 & 2016 |
| Figure 93 |
Brazil, Argentina and Mexico X-ray Security Screening Market (incl. Systems Sales, Service and Upgrade) [$ Million] by Application – 2010-2016 |
| Figure 94 |
Brazil, Argentina and Mexico X-ray Security Screening System Sales [$ Million] – 2010-2016 |
| Figure 95 |
Brazil, Argentina and Mexico X-ray Security Screening Systems Service and Upgrade Market [$ Million] – 2010-2016 |
| Figure 96 |
Brazil, Argentina and Mexico Aviation Security X-ray Security Screening Market [$M] – 2010-2016 |
| Figure 97 |
Brazil, Argentina and Mexico Aviation Security X-ray Security Screening Market Structure [%]-2010&2016 |
| Figure 98 |
Brazil, Argentina and Mexico Secured Facilities X-ray Security Screening Market [$M] – 2010-2016 |
| Figure 99 |
Brazil, Argentina and Mexico Secured Facilities X-ray Security Screening Market Structure [%] – 2010 & 2016 |
| Figure 100 |
Brazil, Argentina and Mexico Other Applications X-ray Security Screening Market [$M] – 2010-2016 |
| Figure 101 |
Brazil, Argentina and Mexico Other Applications X-ray Security Screening Market Structure [%] – 2010&2016 |
| Figure 102 |
ROW X-ray Security Screening Market (incl. Systems Sales, Service and Upgrade) Structure [%] – 2010&2016 |
| Figure 103 |
ROW X-ray Security Screening Market (incl. Systems Sales, Service and Upgrade) [$ Million] by Application – 2010-2016 |
| Figure 104 |
ROW X-ray Security Screening System Sales [$ Million] – 2010-2016 |
| Figure 105 |
ROW X-ray Security Screening Systems Service and Upgrade Market [$ Million] – 2010-2016 |
| Figure 106 |
ROW Aviation Security X-ray Security Screening Market [$M] – 2010-2016 |
| Figure 107 |
ROW Aviation Security X-ray Security Screening Market Structure [%] – 2010 & 2016 |
| Figure 108 |
ROW Secured Facilities X-ray Security Screening Market [$M] – 2010-2016 |
| Figure 109 |
ROW Secured Facilities X-ray Security Screening Market Structure [%] – 2010 & 2016 |
| Figure 110 |
ROW Other Applications X-ray Security Screening Market [$M] – 2010-2016 |
| Figure 111 |
ROW Other Applications X-ray Security Screening Market Structure [%] – 2010 & 2016 |
| Figure 112 |
Fused Modality Multi Threat (Explosives & Nuclear) Screening System |
| Figure 113 |
3D Stereoscopic X-ray Camera and Images |
| Figure 114 |
3D Stereoscopic X-ray Luggage Inspection Scheme |
| Figure 115 |
DHS S&T Explosives Division Functions |
| Figure 116 |
TSA RDT&E Strategic Vision |
| Figure 117 |
The 2D X-ray Performance Criteria |
| Figure 118 |
Remote Cargo Tele-Screening |
