Top
HSRCGlobal Maritime Security Technologies & Markets – 2010-2014
Placeholder

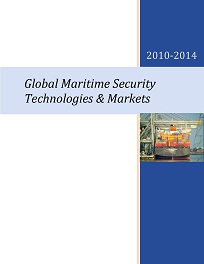
Global Maritime Security Technologies & Markets - 2010-2014

From $69 billion in 2010 to $85 billion by 2014.

  • Q3 2009
  • 222
  • 135
    • 2450 $
    • 3450 $
    • 5950 $
    • 6000 $

    Small Businesses, Startups & Academia - Up to 50% Off

Quantity
IBM
Amazon
Sandia National Lab
HITACHI
Thales
Smiths Detection
Nuctech
Korea Internet & Security Agency
L3Harris
Huawei
Leidos
NEC
Toshiba
Deloitte
MAG

Want to customize this report?

If you purchase this report, you are entitled to a 30% discount towards customizing it, to better fit your market research and strategic needs. Our Custom Research and Industry Insights Department will work with you to better understand your information gaps and strategic needs and will provide you with a tailor-made market research report within a short period of time.

Why Choose Us?

30+ Years of Experience
We are a multidisciplinary team of Transformational Technologies industry experts with over 30 years of experience.
Gold Standard
With over 950 private sector clients (73% repeat customers), including major defense and security vendors, and Forbes Global 2000 companies, HSRC earned the reputation as the industry’s Gold Standard for Transformational Technologies Market Reports.
Tailored Research Services
Provide you with clear, actionable recommendations designed to empower decision making and to help you exploit emerging opportunities in the Transformational Technologies industries.
Information Security
Your personal information is safe and secure.

From: $2,450

SKU: 1234 Category:

Description

Global Maritime Security Technologies & Markets - 2010-2014

The shipping industry has been rocked by the global recession, with the top shippers losing billions of dollars in 2009. The reverberations of this plunge can be felt throughout the maritime industry, particularly in the area of maritime security, which has dropped 8.3% in the past year.

Nonetheless, Homeland Security Research Corporation believes that, over the next five years, the global maritime security market will stage a comeback, growing a CAGR of 7%. Port security, counter-terrorism, regulatory compliance, container and people screening, as well as liquefied natural gas port and tanker security are but a few of the motivating factors behind HSRC’s forecast.

In this report HSRC provides exclusive insights and analysis into this resurgent market:

  • End Customers – (e.g., port authorities, shipping companies, government agencies, Coast Guards, LNG facilities, law enforcement agencies)
  • Products and Technology – (e. g., container-screening systems, nuclear-radiological people-screening technologies, biometric ID port perimeter security, C3I infrastructure, satellite-based maritime tracking)
  • Commercial Sectors – (e.g., systems, service and upgrade markets)
  • Business Opportunities by Threats & Vulnerabilities – (e.g. WMD, explosives, deep water security perimeter security)
  • Geography
  • Market Drivers & Inhibitors

Table of Contents

Download TOC as PDF
1. Introduction and Scope
1.1. Scope
1.1.1. Terms of Reference
2. Executive Summary
2.1. Major Findings
2.2. Major Conclusions
2.3. The Maritime Security Market Forecast: 2010-2014
2.3.1. Market Overview & Forecast: 2008-2014
2.3.2. Systems and Systems Upgrade Market Forecast: 2008-2014
2.3.3. Post-warranty Service Market Forecast: 2008-2014
3. The Maritime Industry
3.1. The Global Maritime Industry
3.2. The U.S. Maritime Industry
4. The Effects of the Maritime Industry Slowdown on the Maritime Security Market
4.1. The Economy Downturn Impacts on Maritime Security Sub-Markets
5. Maritime Security Background
6. Maritime Security Legislation
6.1. Scope
6.2. International Ship and Port Facility Security (ISPS) Code
6.3. The Port, Maritime, and Rail Security Act of 2001 (S. 1214)
6.4. Container Security Initiative (CSI)
6.5. Customs-Trade Partnership Against Terrorism (C-TPAT)
6.6. United States 24-hour Advance Manifest Rule
6.7. World Customs Organization
6.8. G8 Activity
6.9. Automatic Identification Systems (AISs) Regulation
6.1. EU Legislation
6.10.1. Ship and Port Facility Security: Regulation (EC) No 725/2004 on Enhancing Ship and Port Facility Security
6.10.2. Port Security Directive: Directive 2005/65/EC on Enhancing Port Security
6.11. Maritime RFID Standards and Regulations
6.11.1. RFID Air Interface Standards
6.11.2. Standards for Electronic Seals
6.11.3. The Framework of Standards for Electronic-Seals and “E-containers”
6.11.4. Existing and Future RFID License Plate Standard
7. Maritime Security Business Opportunities and Challenges
7.1. Technology Needs and Challenges
8. Maritime Security Market Competitiveness Analysis
9. Maritime Security Sub-Markets Forecast: 2009-2014
9.1. LNG Tankers & LNG Ports Security Market & Technologies: 2009-2014
9.1.1. The LNG Industry
9.1.2. Market Analysis
9.1.3. Competitiveness Analysis
9.1.4. Market Forecast: 2009-2014
9.2. Satellite Based Maritime Tracking, Market & Technologies: 2009-2014
9.2.1. Technology Analysis
9.2.2. Wide Area Communications and Tracking Technology
9.2.3. SkyBitz Global Locating System
9.2.4. PAR Cargo*Mate
9.2.5. TRI-MEX “Black Box”
9.2.6. Container Tracking Systems
9.2.7. Modularity vs. Turnkey Approach
9.2.8. Competitiveness Analysis
9.2.9. Market Forecast: 2009-2014
9.3. Maritime Awareness Global Network (MAGNET) Market & Technologies: 2009-2014
9.3.1. Technology and Market Analysis
9.3.2. Competitiveness Analysis
9.3.3. Market Forecast: 2009-2014
9.4. Maritime Nuc/Rad Screening Market and Technologies: 2009-2014
9.4.1. Market Analysis
9.4.2. Competitiveness Analysis
9.4.3. Market Forecast: 2009-2014
9.5. Piracy Mitigation Market and Technology: 2009-2014
9.5.1. Market and Technology Analysis
9.5.2. Ship Security Teams
9.5.3. Ship Tracking and Alarm System – “Purple Finder”
9.5.4. Ship “Perimeter Security” Technologies
9.5.5. Competitiveness Analysis
9.5.6. Market Forecast: 2009-2014
9.6. Secured Containers Market and Technologies: 2009-2014
9.6.1. Technologies and the Future Market
9.6.2. Main Conclusions
9.6.3. Smart Containers
9.6.4. Electronic Seals (Active and Passive) and Readers
9.6.5. RFID Devices
9.6.6. Smart Containers – Intrusion Detection Sensors
9.6.7. Cargo Security Sensors
9.6.8. Smart Container: Market Analysis
9.6.9. Integration of Economic and Regulatory Drivers
9.6.10. Competitiveness Analysis
9.6.11. Market Forecast: 2009-2014
9.7. Command, Control, Communication & Intelligence (C-3I) Market & Technologies: 2009-2014
9.7.1. Market Analysis
9.7.2. Competitiveness Analysis
9.7.3. Market Forecast: 2009-2014
9.8. Coast Guards HLS Markets and Technologies: 2009-2010
9.8.1. Coast Guard Missions
9.8.2. The Coast Guard’s Role in Homeland Security
9.8.3. National Coast Guards – Scope
9.8.4. U.S. Coast Guard
9.8.5. Canadian Coast Guard
9.8.6. U.K. Coast Guard
9.8.7. Swedish Coast Guard
9.8.8. French Coast Guard
9.8.9. German Coast Guard
9.8.10. Italian Coast Guard
9.8.11. Turkish Coast Guard
9.8.12. Indian Coast Guard
9.8.13. Pakistani Coast Guard
9.8.14. Chinese Coast Guard
9.8.15. Japanese Coast Guard
9.8.16. Singaporean Coast Guard
9.8.17. Australian Coast Guard
9.8.18. New Zealand Coast Guard
9.8.19. Competitiveness Analysis
9.8.20. Market Forecast: 2009-2014
9.9. Container Screening Portals Technologies and Markets: 2009-2014.
9.9.1. Background
9.9.2. Table the US “100% Container Screening” Activity
9.9.3. Table Comparison of Container Explosives Screening Technologies
9.9.4. X-Ray systems
9.9.5. Gamma Ray Systems
9.9.6. Linac X-Ray Systems
9.9.7. Neutron Activation Systems
9.9.8. Technology Outlook: 2009-2014
9.9.9. Nuc/Rad Screening Portals
9.9.10. Market Drivers
9.9.11. Market Inhibitors
9.9.12. Competitiveness Analysis
9.9.13. Market Forecast: 2009-2014
9.10. Port Perimeter Security Technologies and Markets: 2008-2009.
9.10.1. Market Analysis
9.10.2. Port Perimeter Security – Strategic Context
9.10.3. Port Perimeter Security Market Challenges
9.10.4. Port Perimeter Security: C3I Systems
9.10.5. Market Drivers
9.10.6. Market Inhibitors
9.10.7. Port Perimeter Security Sub- Market Growth Sectors
9.10.8. Competitiveness Analysis
9.10.9. Market Forecast: 2009-2014
9.11. Sea-Ports People-Screening Technologies and Markets: 2009-2014
9.11.1. Market Analysis
9.11.2. Technology Outlook-2009-2014
9.11.3. Maritime – Transportation Worker Identification Credential (TWIC)
9.11.4. Biometric Identification
9.11.5. Competitiveness Analysis
9.11.6. Market Forecast: 2009-2014
9.12. Ship Automatic Identification Technologies and Markets-2009-2014
9.12.1. Market Analysis
9.12.2. Long Range Identification and Tracking (LRIT)
9.12.3. Short Range Tracking
9.12.4. Competitiveness Analysis
9.12.5.  Market Forecast: 2009-2014
9.13. Other Global Maritime Security Markets
10. Maritime Security Market Dynamics
11. Global Maritime Security Market Outlook: 2010-2014
11.1. Market Drivers
11.2. Market Inhibitors
11.3. Maritime Security Global Market Forecast: 2010-2014
11.4. USA & Canada Maritime Security Market Forecast: 2010-2014
11.5. The South American Maritime Security Market Forecast: 2010-2014
11.6. The European Maritime Security Market Forecast: 2010-2014
11.7. The Middle East Maritime Security Market Forecast: 2010-2014
11.8. China, India, S. Korea, Taiwan, Japan Maritime Security Markets Forecast: 2010-2014
11.9. The Pacific Region Maritime Security Market Forecast: 2010-2014
11.1. Rest of World (ROW) Maritime Security Market Forecast: 2010-2014

Tables

Table 1 Maritime Security Market [$ Million] by Systems, Upgrade and Service – 2008-2014
Table 2 Maritime Security Systems & Upgrade Market [$ Million] by Sub-Markets – 2008-2014
Table 3 Maritime Security Systems & Upgrade Market Structure [%] by Sub-Markets – 2008-2014
Table 4 Maritime Security Service Market [$ Million] – 2008-2014
Table 5 The World 25 Largest Container Ports
Table 6 Economic Downturn Impacts on Maritime Security Sub-markets
Table 7 Security “24-hour rule” Surcharge Rate of Leading Forwarders and Carriers
Table 8 RFID Frequency Summary for Supply Chain and Security Applications
Table 9 Maritime Security Sub- Market Growth Sectors
Table 10 Global LNG Tankers & Ports Security Market [$M] – 2008-2014
Table 11 Global Satellite-Based Maritime Tracking Market [$M] – 2008-2014
Table 12 Global Maritime Awareness Global Network (MAGNET) Market [$M] – 2008-2014
Table 13 Global Maritime Nuc/Rad Screening Market [$M] – 2008-2014
Table 14 Global Piracy Mitigation Market [$M] – 2008-2014
Table 15 Smart Container Market Drivers & Inhibitors
Table 16 Maritime RFID Seals – Carrier Frequencies and Corresponding Applications
Table 17 Factors Influencing Evolution of the Secured Container Market
Table 18 The Dynamics of Smart Container Markets – Major Potential Secured Container Market Scenarios
Table 19 Global Secured Containers Market [$M] – 2008-2014
Table 20 Global Command, Control, Communication & Intelligence (C-3I) Market [$M] – 2008-2014
Table 21 Coast Guard HLS and Non-HLS Missions
Table 22 USCG 2008-2014 HLS Programs and Initiatives
Table 23 Global Coast Guard HLS Missions Market [$M] – 2008-2014
Table 24 Container Screening – Technologies Comparison
Table 25 Port Perimeter Security Sub- Markets Growth Sectors
Table 26 Global Port Perimeter Security Market [$M] – 2008-2014
Table 27 TWIC Enrollment Centers
Table 28 Global Biometric Market Shares by Technology – 2008
Table 29 Global Seaport People-Screening Market [$M] – 2008-2014
Table 30 Global Ship Automatic Identification System Market [$M] – 2008-2014
Table 31 Other Global Maritime Security Markets [$M] – 2008-2014
Table 32 Evolution of Maritime Security Market Dynamics – 2010-2014
Table 33 Global Maritime Security Market (Sales, Upgrade and Service) Forecast [$Billion] – 2008-2014
Table 34 Global Maritime Security Market Forecast by Geographical Regions [$Million] – 2008 & 2014
Table 35 Maritime Security Regional Markets as [%] of Global Maritime Security Market – 2008 & 2014
Table 36 USA & Canada Maritime Security Market (Sales, Upgrade and Service) Forecast – 2008-2014
Table 37 South American Maritime Security Market (Sales, Upgrade and Service) Forecast – 2008-2014
Table 38 European Maritime Security Market (Sales, Upgrade and Service) Forecast – 2008-2014
Table 39 Middle East Maritime Security Market (Sales, Upgrade and Service) Forecast – 2008-2014
Table 40 China, India, S. Korea, Taiwan and Japan Maritime Security Market (Sales, Upgrade and Service) Forecast – 2008-2014
Table 41 Pacific Region Maritime Security Market (Sales, Upgrade and Service) Forecast – 2008-2014
Table 42  R.O.W. Maritime Security Market (Sales, Upgrade and Service) Forecast – 2008-2014

Figures

Figure 1 Maritime Security Market, Drivers, Barriers and Government Influence
Figure 2 Maritime Security Market [$ Million] by Systems, Upgrades and Service – 2008-2014
Figure 3 Maritime Security Market Share [%] by Systems & Upgrade and Service – 2009 & 2014
Figure 4 Maritime Security Systems & Upgrade Market [$ Million] by Sub-Markets Outlook – 2008-2014
Figure 5 Maritime Security Systems & Upgrade Market Share [%] by Sub-Markets – 2008-2014
Figure 6 Maritime Security Service Market [$ Million] Outlook – 2008-2014
Figure 7 Maritime Security Service Market Share in the Total (Systems, Upgrade and Service) Market – 2009 & 2014
Figure 8 Maritime Security Mixed Mode Approach
Figure 9 Illustrative Electronic-seal Reading in Maritime Supply Chain
Figure 10 Decision Superiority in the Maritime Security Domain
Figure 11 Maritime Supply Chain vs. Security Legislation
Figure 12 Typical Container Booking / Bill of Landing Cycle: Before and After 24-hours Advance Notification
Figure 13 Countries Who Committed to Implement the WCO Customs Security Practices
Figure 14 Maritime Security Market Competitiveness Analysis
Figure 15 LNG Infrastructure Investments: The Past 20 Years vs. the Next 6 Years
Figure 16 Global LNG Tankers & Port Fact Sheet
Figure 17 LNG Tankers & Ports Security Market Competitiveness Analysis
Figure 18 Global LNG Tankers & Ports Security Systems and Upgrade Market [$M] – 2008-2014
Figure 19 Satellite Imagery of the Strait of Hormuz
Figure 20 Overview of Satellite-Based Long Distance Tracking Systems
Figure 21 Satellite-Based Maritime Tracking Market Competitiveness Analysis
Figure 22 Global Satellite-Based Maritime Tracking Market [$M] – 2008-2014
Figure 23 LNG Tankers & Ports Security Market Competitiveness Analysis
Figure 24 Global Maritime Awareness Global Network (MAGNET) Market [$M] – 2008-2014
Figure 25 Nuc/Rad Screening Portals Market Competitiveness Analysis
Figure 26 Global Maritime Nuc/Rad Screening Market [$M] – 2008-2014
Figure 27 Map of Contemporary Pirate Activity
Figure 28 Piracy Mitigation Market Competitiveness Analysis
Figure 29 Global Piracy Mitigation Market [$M] – 2008-2014
Figure 30 Container Security Devices
Figure 31 Smart Container Technologies
Figure 32 Marine Asset Tag Tracking System
Figure 33 Active RFID Tag
Figure 34 Passive RFID Tag
Figure 35 A Secured Container Including RFID, Electronic-seal and Geo-Location Architecture
Figure 36 Internal Intrusion Technologies Within Smart Container Sector
Figure 37 Secured Containers Market Competitiveness Analysis
Figure 38 Global Secured Containers Market [$M] – 2008-2014
Figure 39 A C³I Center Operations Command Post
Figure 40 C³I Data Fusion and Automated Tools for Command Center Operations
Figure 41 C3I Market Competitiveness Analysis
Figure 42 Global Command, Control, Communication & Intelligence (C-3I) Market [$M] – 2008-2014
Figure 43 Variety of Technical Means Used by Coast Guards
Figure 44 US Coast Guard Funding by Missions
Figure 45 Coast Guard Deep Water Maritime Security Platforms
Figure 46 Coast Guards Market Competitiveness Analysis
Figure 47 Global Coast Guard HLS Missions Market – 2008-2014
Figure 48 Container Screening Technologies
Figure 49 Dual Energy X-Ray
Figure 50 Material Differentiation by Dual Energy X-Ray
Figure 51 Dual View X-Ray – Principles of Operation
Figure 52 Gamma Source Container/Vehicle Screening
Figure 53 LINAC X-Ray Container/Vehicle Screening
Figure 54 Dual View Linac Container/ Vehicle Imaging System
Figure 55 Pulsed Fast Neutron Activation Container/Vehicle Screening
Figure 56 Pulsed Fast Neutron Activation Container/Vehicle Screening System Block Diagram
Figure 57 Future Fused-Technologies Container Explosives Screening System
Figure 58 Future Port of Entry Staggered Multi layer Checkpoints
Figure 59 Conventional Visible Nuclear/Radiological Portals
Figure 60 Checkpoint Incorporating an Array of Concealed Nuclear/Radiological Portals
Figure 61 Container Screening Market Competitiveness Analysis
Figure 62 Global Container Screening Market [$M] – 2008-2014
Figure 63 Global Container Screening Market [$M] – 2008-2014
Figure 64 Maritime Perimeter Security: Market, Drivers & Barriers and Government Influence
Figure 65 Multi-Tiered Port Perimeter Security
Figure 66 Secured Containers Market Competitiveness Analysis
Figure 67 Global Port Perimeter Security Market [$M] – 2008-2014
Figure 68 Port Worker Biometric I.D. Cards
Figure 69 Maritime Security People-Screening – Technologies
Figure 70 Global Biometric Market Share [%] by Technology – 2008
Figure 71 Secured Containers Market Competitiveness Analysis
Figure 72 Global Seaport People-Screening Market [$M] – 2008-2014
Figure 73 Ship Tracking Market Competitiveness Analysis
Figure 74 Global Ship Automatic Identification System Market [$M] – 2008-2014
Figure 75 Other Global Maritime Security Markets [$M] – 2008-2014
Figure 76 Global Maritime Security Market Forecast [$Billion] – 2008-2014
Figure 77 Global Maritime Security Market as [%] of the Global HLS-HLD Market – 2008-2014
Figure 78 Global Maritime Security Market Forecast by Geographical Regions [$Million] – 2008 & 2014
Figure 79 Maritime Security Regional Markets as [%] of Global Maritime Security Market – 2008 & 2014
Figure 80 USA & Canada Maritime Security Market Forecast [$M – 2008-2014
Figure 81 USA & Canada Maritime Security Market as [%] of the Global Maritime Security Market – 2008-2014
Figure 82 South American Maritime Security Market Forecast [$M] – 2008-2014
Figure 83 South American Maritime Security Market as [%] of the Global Maritime Security Market – 2008-2014
Figure 84 European Maritime Security Market Forecast [$M] – 2008-2014
Figure 85 European Maritime Security Market as [%] of the Global Maritime Security Market – 2008-2014
Figure 86 Middle East Maritime Security Market Forecast [$M] – 2008-2014
Figure 87 Middle East Maritime Security Market as [%] of the Global Maritime Security Market – 2008-2014
Figure 88 China, India, S. Korea, Taiwan and Japan Maritime Security Market Forecast [$M] – 2008-2014
Figure 89 China, India, S. Korea, Taiwan and Japan Maritime Security Market as [%] of the Global Maritime Security Market – 2008-2014
Figure 90 Pacific Region Maritime Security Market Forecast [$M] – 2008-2014
Figure 91 Pacific Region Maritime Security Market as [%] of the Global Maritime Security Market – 2008-2014
Figure 92 ROW Maritime Security Market Forecast [$M] – 2008-2014
Figure 93  ROW Maritime Security Market as [%] of the Global Maritime Security Market – 2008-2014

Questions about this report?

Contact Sales: 1-571-527-1010 or Analysts: 1-202-455-0966

  • Have a question about Global Maritime Security Technologies & Markets - 2010-2014
    Please fill out all fields in the form below and click "Submit" to send your question.
    Our representative will review your question and contact you with an answer as soon as possible.
  • 2+2=
  • This field is for validation purposes and should be left unchanged.
1
Interested in this report? Need more information?
X
Powered By