Top
HSRCPeople Screening Technologies & Global Markets – 2012-2016
Placeholder

People Screening Technologies & Global Markets - 2012-2016

Security Screening Market – 12% CAGR, 136 Submarkets

  • Q4 2011
  • 354
  • 314
    • 2450 $
    • 3450 $
    • 5950 $
    • 6000 $

    Small Businesses, Startups & Academia - Up to 50% Off

Quantity
IBM
Amazon
Sandia National Lab
HITACHI
Thales
Smiths Detection
Nuctech
Korea Internet & Security Agency
L3Harris
Huawei
Leidos
NEC
Toshiba
Deloitte
MAG

Want to customize this report?

If you purchase this report, you are entitled to a 30% discount towards customizing it, to better fit your market research and strategic needs. Our Custom Research and Industry Insights Department will work with you to better understand your information gaps and strategic needs and will provide you with a tailor-made market research report within a short period of time.

Why Choose Us?

30+ Years of Experience
We are a multidisciplinary team of Transformational Technologies industry experts with over 30 years of experience.
Gold Standard
With over 950 private sector clients (73% repeat customers), including major defense and security vendors, and Forbes Global 2000 companies, HSRC earned the reputation as the industry’s Gold Standard for Transformational Technologies Market Reports.
Tailored Research Services
Provide you with clear, actionable recommendations designed to empower decision making and to help you exploit emerging opportunities in the Transformational Technologies industries.
Information Security
Your personal information is safe and secure.

From: $2,450

SKU: 3974 Category:

Description

See also the latest version of this report

Non-Lethal Weapons: Technologies & Global Market - 2012-2020

The growing internal security and terror challenges facing India, China, Brazil and the Middle East oil exporting countries on one hand, and the prospects of the U.S. and EU economies on the other hand will redraw the global People Screening industry landscape.In the new People Screening Technologies & Global Markets – 2012-2016 report HSRC analysts forecast that the global market (including systems sales, service, upgrade and refurbishment revenues) will grow at a CAGR of 11.6%. While the U.S. systems sales are forecast to decline at a CAGR of -1%, the markets in China, India, Brazil and the Middle East are forecast to grow at a solid CAGR of over 17%.

The report, segmented into 136 sub-markets, offers for each sub-market 2011 data and 2012-2016 forecasts and analysis.
In 354 pages, 111 tables and 203 figures, the report analyses and projects the 2012-2016 market and technologies from several perspectives, including:

  • Market forecast by customer sector (e.g., transportation, secured facilities)
  • Market segmented by Systems sales vs. Service, upgrades & refurbishing market
  • 5 regional markets and 8 key national markets (e.g., USA, UK, Germany, India, China, Brazil)
  • Over 30 key equipment vendors
  • Market analysis (e.g., market drivers & inhibitors, SWOT analysis)
  • Business environment (e.g., competitive analysis)
  • Current and pipeline technologies
  • Business opportunities and challenges

Table of Contents

Download TOC as PDF
1 Executive Summary
1.1 Major Findings
1.2 Major Conclusions
1.3 People Screening Market – 2012 2016
1.3.1 Systems Sales 2012-2016
1.3.2 Maintenance, Upgrade & Refurbishment Market 2012 2016
1.3.3 Systems Sales vs. Maintenance, Upgrade & Refurbishment Market 2012 2016
1.3.4 Consolidated People Screening Market – 2012 2016
1.3.5 People Screening Market by End User – 2012-1016
1.4 People Screening Technologies
2 Introduction
2.1 Scope
2.2 Methodology
3 Market Drivers
4 Market Inhibitors
5 SWOT Analysis
6 Competitive Analysis
7 Business Challenges & Opportunities
8 Present People Screening Technologies & Products
8.1 Explosives Trace Detectors (ETD)
8.1.1 ETD Principles of Operation
8.1.2 ETD Core Technologies
8.1.3 Ion Mobility Spectroscopy (IMS)
8.1.4 ChemiLuminescence (CL)
8.1.5 Electron Capture Detectors (ECD)
8.1.6 Surface Acoustic Wave (SAW)
8.1.7 ETD People Screening Portals
8.1.8 Hand-Held & Desktop ETD Devices
8.2 Whole Body Scanners (AIT)
8.2.1 X-ray Backscatter Portals
8.2.2 Active MMWave Whole Body Scanners
8.2.3 Passive MMWave Whole Body Scanners
8.2.4 Terahertz Whole Body Scanners
8.2.5 Comparison of MMWave/Terahertz vs. Backscatter X-ray Portals
8.2.6 Vendors and Products
8.3 Metal Detection Portals & Devices
8.3.1 Hand-Held Metal Detectors
8.3.2 Walk Through Metal Detection Portals
8.4 Shoe Scanners
8.4.1 Threats and Government Policy
8.4.2 Shoe Scanners: Vendors, Products & Prices
8.5 Bottled Liquids Scanners (BLS)
8.5.1 Liquid Explosives Threats
8.5.2 Liquid Explosives Screening
8.5.3 DHS’s SENSIT Program
8.5.4 Liquid Detection: Techno-Tactical Considerations
8.5.5 Liquid Explosives Scanners Vendors, Products and Prices
8.5.6 Liquid Explosives Scanners – Sample System
8.6 Body Cavities Screening Systems
8.7 Computer Aided Detection (CAD) Software
8.8 Biometric People Screening
8.8.1 Biometric Identification, Drivers & Inhibitors and Government Influence
8.8.2 Biometric Market Drivers & Inhibitors
8.8.3 Biometric Portals
8.8.4 Fused Biometric, Document Authentication and Interrogation Portals
8.9 Multi-Modal & Multi-Threat Portals
8.9.1 Overview
8.9.2 Technology Status
8.9.3 Core Technologies
8.9.4 Example: Detection Systems Fusion Protocol (DSFP)
8.1 Pat-down Body Search
8.11 Hand-Held Weapons and CBRNE Detectors
8.12 Cast and Artificial Limbs Screening Technologies
8.12.1 Evolving Hand-Held MMWave Wand Sample
9 People Screening Technologies Outlook – 2012-2016
9.1 ETD Technology Outlook – 2012 2016
9.1.1 Techno-Tactical Needs
9.1.2 ETD of the Future: Techno-Tactical Drivers
9.1.3 ETD of the Future: Performance & Operational Goals
9.1.4 Advanced Sample Collection
9.1.5 Dual Technology ETD
9.1.6 Pipeline ETD Technologies
9.1.7 Next Generation ETD Technologies
9.1.8 Integrated Explosives, Chemical Warfare and Narcotics Trace Detectors
9.2 Multi-Modal & Multi-Threat Portals
9.2.1 Market Needs
9.2.2 Proposed High Throughput Multi-Threat People Screening Portal
9.2.3 Future People Screening Portals – Technology Essentials
9.2.4 Future Multi-Threat Detection
9.2.5 Molecularly Imprinted Polymer (MIP) Sensors
9.2.6 MOS-Based Electro-Chemical Sensor Networks
9.2.7 Future Shoe Scanners
10 IATA & ICAO “Checkpoint of the Future”
10.1 IATA Checkpoint of the future: main concepts
10.2 Main features of IATA Checkpoint of the future
10.3 IATA Checkpoint of the Future Outlook
12 People Screening Markets -2012-2016
12.1 Overview
12.1.1 Systems Sales 2012-2016
12.1.2 Maintenance, Upgrade & Refurbishment Market 2012 2016
12.1.3 Systems Sales vs. Maintenance, Upgrade & Refurbishment Market 2012 2016
12.1.4 Consolidated People Screening Market – 2012 2016
12.2 ETD Portals & Devices Market 2012 2016
12.2.1 Global Market by Customer Sector – 2012 2016
12.2.2 Systems Sales by Region & Sector – 2012 2016
12.2.3 Market by Region – 2012 2016
12.2.4 Eight Key National Markets – 2012 2016
12.3 Whole Body (AIT) Scanners Market 2012 2016
12.3.1 Global Market by Customer Sector – 2012 2016
12.3.2 Systems Sales by Region & Sector – 2012 2016
12.3.3 Market by Region – 2012 2016
12.3.4 Eight Key National Markets – 2012 2016
12.4 Metal Detection Portals & Devices Market 2012 2016
12.4.1 Global Market by Customer Sector – 2012 2016
12.4.2 Systems Sales by Regions & Sectors – 2012 2016
12.4.3 Market by Region – 2012 2016
12.4.4 Eight Key National Markets – 2012 2016
12.5 Shoe Scanners Market 2012 2016
12.5.1 Global Market by Segment – 2012 2016
12.5.2 Market by Region – 2012 2016
12.5.3 Eight Key National Markets – 2012 2016
12.6 Liquid Explosives Scanners Market 2012 2016
12.6.1 Global Market by Segment – 2012 2016
12.6.2 Market by Region – 2012 2016
12.6.3 Eight Key National Markets – 2012 2016
12.7 Multi-Modal & Multi-Threat Portals Market 2012 2016
12.7.1 Global Market by Customer Sector – 2012 2016
12.7.2 Systems Sales by Region & Sector – 2012 2016
12.7.3 Market by Region – 2012 2016
12.7.4 Eight Key National Markets – 2012 2016
13 People Screening Market by End User – 2012-1016
13.1 Overview
13.2 Aviation Passengers Screening Market
13.2.1 Background
13.2.2 Airport Passengers Screening Market – 2012-2016
13.3 Land/Sea Transportation Passengers Screening Market
13.3.1 Background
13.3.2 Land/Sea Transportation Passengers Screening Market – 2012-2016
13.4 Land Border People Screening Market
13.4.1 Background
13.4.2 Land Border People Screening Market – 2012-2016
13.5 School Security People Screening Market
13.6 Embassies and Consulates Visitors and Employees Screening Market
13.6.1 Background
13.6.2 Embassies and Consulates People Screening Market – 2012-2016
13.7 Prisons People Screening Market
13.7.1 Background
13.7.2 Prison Screening Market – 2012-2016
13.8 Government Secured Facilities People Screening Markets
13.8.1 Background
13.8.2 Government Secured Facilities Market – 2012-2016
13.9 Public Gathering Events People Screening Markets
13.1 Private Sector People Screening Market
13.10.1 Background
13.10.2 Private Sector People Screening Market – 2012-2016
13.11 Other Users People Screening Market
14 US Market 2012 2016
14.1 US homeland security: background
14.2 The US HLS Organizational Structure
14.3 The US Airport Security
14.4 The Transportation Security Administration
14.5 US People-Screening Market Background
14.6 People Screening Market – 2012 2016
15 UK Market 2012 2016
15.1 Homeland Security in the UK
15.2 The UK HLS Organizational Structure
15.3 Land Transportation Security Screening: Market Background
15.4 Maritime Security Screening: Market Background
15.5 The UK Aviation Passengers and employees screening: Market Background
15.6 UK Airport Security Screening vs. EU legislation
15.7 People Screening in Other Sectors
15.8 People Screening Market – 2012 2016
16 German Market 2012 2016
16.1 Homeland Security in Germany
16.2 HLS Organizational Structure
16.3 Aviation Security Screening: Market Background
16.4 Other People Screening: Market Background
16.5 People Screening Portals Market – 2012 2016
17 Spanish Market 2012 2016
17.1 Homeland Security in Spain
17.2 HLS Organizational Structure
17.3 Maritime Screening: Market Background
17.4 Aviation Screening: Market Background
17.5 People Screening Market – 2012 2016
18 Indian Market 2012 2016
18.1 India, Economy and HLS Facts
18.2 HLS Organizational Structure
18.3 Airport Authority of India
18.4 People Screening Market Background
18.4.1 Public Transportation System
18.4.2 Other People Screening Markets
18.5 India Local Security Industry
18.6 India People Screening Market – 2012 2016
19 Chinese Market 2012 2016
19.1 Economy and HLS Facts
19.2 HLS Organizational Structure
19.3 Aviation Security
19.4 People Screening Market Background
19.5 China People Screening Market – 2012 2016
20 Japanese Market 2012 2016
20.1 Japan HLS Organizational Structure
20.2 Aviation Security
20.3 People Screening Market Background
20.3.1 Japan Public Transportation System
20.3.2 Japan Border People Screening
20.4 Japan People Screening Market – 2012 2016
21 Brazilian Market 2012 2016
21.1 Economy and HLS Facts
21.2 Brazil Security Organizational Structure
21.3 Brazil Aviation Security
21.4 Brazil People Screening Market Background
21.5 Brazil People Screening Market – 2012 2016
22 People Screening Equipment Vendors
22.1 Vendors and Product Lines
22.2 MilliVision
22.3 L-3 Communications Security & Detection Systems
22.4 Rapiscan Security Products, Inc.
22.5 Smiths Detection
22.6 QinetiQ Ltd
22.7 Westminster International Ltd.
22.8 American Science & Engineering, Inc
22.9 ADANI
22.1 General Electric Co.
22.11 Red X Defense
22.12 Syagen Technology
22.13 Thermo Electron Corporation
22.14 Biosensor Applications
22.15 Hitachi
22.16 Scent Detection Technologies
22.17 Ketech Defence
22.18 Mistral Security Inc
22.19 Appealing Products, Inc. (API) / ChemSee
22.2 DetectaChem LLC
22.21 Scintrex Trace
22.22 ICx-Nomadics
22.23 Ion Applications Inc
22.24 BAHIA Corp (Sibel Ltd)
22.25 CEIA
22.26 Garrett Electronics Inc.
22.27 Astrophysics Inc
22.28 AutoClear
22.29 Fisher Labs
22.3 Brijot Imaging Systems
22.31 TeraView
22.32 ThruVision Systems
23 Appendix A: Covert Walk-by People Screening
23.1 Walk-by Active Electromagnetic Weapons Detection Corridors
23.2 Passive Electro Magnetic Signature Corridor
23.3 Walk-by Passive MMWave Doorways
23.4 Focal Plane Array Passive MMWave
23.5 Walk-By Passive MMWave Imaging System
23.6 Walk-by Fourier Transform Infrared (FTIR) Spectroscopy Systems
23.7 Covert Walk-by Biometric Identification Corridors
23.8 Fused Standoff Video Surveillance and Biometrics
23.8.1 Example: IOM PassPort™
24 Appendix B: People Profiling and Behavior Tracking
24.1 Scope
24.2 Profiling Types
24.2.1 Demographic Profiling
24.2.2 Ethnic Profiling
24.2.3 Behavioral Profiling
24.2.4 Positive Profiling
24.3 The Purpose of Profiling and Behavior Tracking
24.3.1 How It Is Done
24.3.2 Behavior Profiling Drivers
24.3.3 Behavior Profiling Inhibitors
24.3.4 The Cost of Profiling
25 Appendix C: CCTV Based People Screening
25.1 Video Monitoring and Biometrics
25.2 CCTV Biometric Face Recognition Identification vs. Verification
25.3 Performance of CCTV Based Biometric Recognition Technologies
25.4 Tag and Track Intelligent Video Surveillance
25.5 TSA Advanced Surveillance Program
26 Appendix D: Abbreviations

Tables

Table 1 Global People Screening Systems Sales [$Million] by Modality – 2011-2016
Table 2 Global People Screening Systems Sales [$Million] by Region – 2011-2016
Table 3 People Screening Systems Sales [$Million] by Key Countries – 2011-2016
Table 4 Global People Screening Portals Maintenance, Upgrade & Refurbishment Market [$Million] by Modality – 2011-2016
Table 5 Global People Screening Portals: Systems Sales vs. Maintenance, Upgrade & Refurbishment Market [$Million] – 2012 2016
Table 6 Global People Screening Portals: Systems Sales market share vs. Maintenance, Upgrade & Refurbishment Market share [%] – 2012 2016
Table 7 Global People Screening Market (Systems Sales, Maintenance, Upgrade & Refurbishment) [$Million] by Modality – 2011-2016
Table 8 Global People Screening Market (Systems Sales, Maintenance, Upgrade & Refurbishment) by End User [$Million] – 2012-2016
Table 9 Trace vs. Bulk Explosives Detection Technologies
Table 10 Trace Explosive Detection Technologies
Table 11 ETD Portals Sensor Technology Comparison
Table 12 Explosives Trace Detection Portals – Technology Comparison
Table 13 Comparison of Backscatter Body Scanner vs. ETD Portal Technologies
Table 14 Trace Explosive Detection Portals Vendors/Products/Prices
Table 15 Trace Detection Pros and Cons
Table 16 Hand-Held Trace Explosives Detectors – Cost Performance Analysis (24/7)
Table 17 DHS Approved Tabletop ETD Systems Performance
Table 18 Desktop ETD Systems: Vendors, Products, Technology and Prices
Table 19 Portable – Swab ETD: Vendors, Products, Technology and Prices
Table 20 Hand-Held ETD Systems: Vendors, Products, Technology and Prices
Table 21 Trace Detection Document Scanners
Table 22 Backscatter People Screening Portals Advantages & Disadvantages
Table 23 Reflectivity of Basic Explosives and Human Flesh
Table 24 Examples of Object Emissivity
Table 25 Active MMWave Screening Systems Advantages & Disadvantages
Table 26 Whole Body Scanners: Products, Vendors and Technology
Table 27 Magnetism and Detection Capabilities
Table 28 Conductivity and Detection Capabilities
Table 29 Metal Detection Portals: Products, Vendors, and Prices
Table 30 Shoe Scanners Vendors, Products & Prices,
Table 31 Liquid Explosives Scanners Vendors/Products/Prices
Table 32 Global Biometric Technology Share – by Technology – 2008
Table 33 Global People Screening Systems Sales [$Million] by Modality – 2011-2016
Table 34 Global People Screening Systems Sales [$Million] by Region – 2011-2016
Table 35 People Screening Systems Sales [$Million] by Key Countries – 2011-2016
Table 36 Global People Screening Portals Maintenance, Upgrade & Refurbishment Market [$Million] by Modality – 2011-2016
Table 37 Global People Screening Portals: Systems Sales vs. Maintenance, Upgrade & Refurbishment Market [$Million] – 2012 2016
Table 38 Global People Screening Portals: Systems Sales market share vs. Maintenance, Upgrade & Refurbishment Market share [%] – 2012 2016
Table 39 Global People Screening Market (Systems Sales, Maintenance, Upgrade & Refurbishment) [$Million] by Modality – 2011-2016
Table 40 Global ETD Portals & Devices Sales [$Million] by Sector – 2011-2016
Table 41 Global ETD Portals & Devices Maintenance, Upgrade & Refurbishment Market [$Million] by Sector – 2011-2016
Table 42 Global ETD Portals & Devices – Consolidated (Systems Sales, Maintenance, Upgrade & Refurbishment) Market [$Million] by Sector – 2011-2016
Table 43 US ETD Portals & Devices Market [$Million] by Sector – 2011-2016
Table 44 EU ETD Portals & Devices Market [$Million] by Sector – 2012 2016
Table 45 Middle East ETD Portals & Devices Market [$Million] by Sector – 2011-2016
Table 46 China, India, Japan ETD Portals & Devices Market [$Million] by Sector – 2011-2016
Table 47 ROW ETD Portals & Devices Market [$Million] by Sector – 2011-2016
Table 48 Global ETD Portals & Devices Sales [$Million] by Region – 2011-2016
Table 49 Global ETD Portals & Devices Maintenance, Upgrade & Refurbishment Market [$Million] by Region – 2011-2016
Table 50 Global ETD Portals & Devices – Consolidated (Systems Sales, Maintenance, Upgrade & Refurbishment) Market [$Million] by Region – 2011-2016
Table 51 ETD Portals & Devices Sales: Eight Key National Markets [$Million] – 2011-2016
Table 52 Global Whole Body (AIT) Scanning Systems Sales [$Million] by Sector – 2011-2016
Table 53 Global Whole Body Scanners Maintenance, Upgrade & Refurbishment Market [$Million] by Sector – 2011-2016
Table 54 Global Whole Body Scanners – Consolidated (Systems Sales, Maintenance, Upgrade & Refurbishment) Market [$Million] by Sector – 2011-2016
Table 55 US Whole Body (AIT) Scanning Systems Market [$Million] by Sector – 2011-2016
Table 56 EU Whole Body Scanners Systems Market [$Million] by Sector – 2011 2016
Table 57 Middle East Whole Body (AIT) Scanning Systems Market [$Million] by Sector – 2011-2016
Table 58 China, India, Japan Whole Body (AIT) Scanning Systems Market [$Million] by Sector – 2011-2016
Table 59 ROW Whole Body (AIT) Scanning Systems Market [$Million] by Sector – 2011-2016
Table 60 Global Whole Body (AIT) Scanning Systems Sales [$Million] by Region – 2011-2016
Table 61 Global Whole Body Scanners Maintenance, Upgrade & Refurbishment Market [$Million] by Region – 2011-2016
Table 62 Global Whole Body Scanners – Consolidated (Systems Sales, Maintenance, Upgrade & Refurbishment) Market [$Million] by Region – 2011-2016
Table 63 Whole Body Scanners Systems Sales: Eight Key National Markets [$Million] – 2011-2016
Table 64 Global Metal Detection Portals & Devices Sales [$Million] by Sector – 2011-2016
Table 65 Global Metal Detection Portals & Devices Maintenance, Upgrade & Refurbishment Market [$Million] by Sector – 2011-2016
Table 66 Global Metal Detection Portals & Devices – Consolidated (Systems Sales, Maintenance, Upgrade & Refurbishment) Market [$Million] by Sector – 2011-2016
Table 67 US Metal Detection Portals & Devices Systems Market [$Million] by Sector – 2011-2016
Table 68 Middle East Metal Detection Portals & Devices Systems Market [$Million] by Sector – 2011-2016
Table 69 China, India, Japan Metal Detection Portals & Devices Systems Market [$Million] by Sector – 2011-2016
Table 70 ROW Metal Detection Portals & Devices Systems Market [$Million] by Sector – 2011-2016
Table 71 Global Metal Detection Portals & Devices Systems Sales [$Million] by Region – 2011-2016
Table 72 Global Metal Detection Portals & Devices – Consolidated (Systems Sales, Maintenance, Upgrade & Refurbishment) Market [$Million] by Region – 2011-2016
Table 73 Metal Detection Systems Sales: Eight Key National Markets [$Million] – 2011-2016
Table 74 Global Shoe Scanning – Consolidated (Systems Sales, Maintenance, Upgrade & Refurbishment) Market [$Million] by Segment – 2011-2016
Table 75 Global Shoe Scanning Systems Sales [$Million] by Region – 2011-2016
Table 76 Global Shoe Scanning Maintenance, Upgrade & Refurbishment Market [$Million] by Region – 2011-2016
Table 77 Global Shoe Scanning – Consolidated (Systems Sales, Maintenance, Upgrade & Refurbishment) Market [$Million] by Region – 2011-2016
Table 78 Shoe Scanning Systems Sales: Eight Key National Markets [$Million] – 2011-2016
Table 79 Global Liquid Explosives Scanners – Consolidated (Systems Sales, Maintenance, Upgrade & Refurbishment) Market [$Million] by Sector – 2011-2016
Table 80 Global Liquid Explosives Scanners Sales [$Million] by Region – 2011-2016
Table 81 Global Liquid Explosives Scanners Maintenance, Upgrade & Refurbishment Market [$Million] by Region – 2011-2016
Table 82 Global Liquid Explosives Scanners – Consolidated (Systems Sales, Maintenance, Upgrade & Refurbishment) Market [$Million] by Region – 2011-2016
Table 83 Liquid Explosives Scanners Sales: Eight Key National Markets [$Million] – 2011-2016
Table 84 Global Multi-Modal & Multi-Threat Portals Sales [$Million] by Sector – 2011-2016
Table 85 Global Multi-Modal & Multi-Threat Portals Maintenance, Upgrade & Refurbishment Market [$Million] by Sector – 2011-2016
Table 86 Global Multi-Modal & Multi-Threat Portals – Consolidated (Systems Sales, Maintenance, Upgrade & Refurbishment) Market [$Million] by Sector – 2011-2016
Table 87 US Multi-Modal & Multi-Threat Portals – Systems Market [$Million] by Sector – 2011-2016
Table 88 EU Multi-Modal & Multi-Threat Portals – Systems Market [$Million] by Sector – 2012 2016
Table 89 Middle East Multi-Modal & Multi-Threat Portals – Systems Market [$Million] by Sector – 2011-2016
Table 90 China, India, Japan Multi-Modal & Multi-Threat Portals – Systems Market [$Million] by Sector – 2011-2016
Table 91 ROW Multi-Modal & Multi-Threat Portals – Systems Market [$Million] by Sector – 2011-2016
Table 92 Global Multi-Modal & Multi-Threat Portals Sales [$Million] by Region – 2011-2016
Table 93 Global Multi-Modal & Multi-Threat Portals Maintenance, Upgrade & Refurbishment Market [$Million] by Region – 2011-2016
Table 94 Global Multi-Modal & Multi-Threat Portals – Consolidated (Systems Sales, Maintenance, Upgrade & Refurbishment) Market [$Million] by Region – 2011-2016
Table 95 Multi-Modal & Multi-Threat Portals Sales: Eight Key National Markets [$Million] – 2011-2016
Table 96 Global People Screening Market (Systems Sales, Maintenance, Upgrade & Refurbishment) by End User [$Million] – 2012-2016
Table 97 Private Sector Security Segments
Table 98 TSA Budget and Its Aviation Security Component 2001-2011
Table 99 Inhibitors to Effective Deployment
Table 100 People Screening Systems Sales [$Million] by Modality – 2011-2016 – US
Table 101 Terminal Passengers [Million] forecast at UK Airports
Table 102 People Screening Systems Sales [$Million] by Modality – 2011-2016 – UK
Table 103 People Screening Systems Sales [$Million] by Modality – 2011-2016 – Germany
Table 104 People Screening Systems Sales [$Million] by Modality – 2011-2016 – Spain
Table 105 India People Screening Systems Sales [$Million] by Modality – 2011-2016
Table 106 China People Screening Systems Sales [$Million] by Modality – 2011-2016
Table 107 People Screening Systems Sales [$Million] by Modality – 2011-2016 – Japan
Table 108 People Screening Systems Sales [$Million] by Modality – 2011-2016 – Brazil
Table 109 People Screening Vendors and Product Lines
Table 110 Retica Standoff Biometric; System Performance
Table 111  Short Range Standoff Biometric Portal: IOM PassPort™ Performance

Figures

Figure 1 Global People Screening Market (Systems Sales, Maintenance, Upgrade & Refurbishment) [$Million] by Modality – 2011-2016
Figure 2 Global People Screening Market (Systems Sales, Maintenance, Upgrade & Refurbishment) [%] by Modality – 2011 & 2016
Figure 3 Global People Screening Market Share (Systems Sales, Maintenance, Upgrade & Refurbishment) by End User [%] 2012 & 2016
Figure 4 People Screening Technologies – Threats and Associated Detection Technologies
Figure 5 Airport People Screening Vectors
Figure 6 SWOT Analysis
Figure 7 People Screening Market Competitive Analysis
Figure 8 People Screening Technology & Products Performance Criteria
Figure 9 Trace Detection General Principle of Operation
Figure 10 Tabletop ETD: Operational Workflow
Figure 11 Explosives Trace Detection Technologies
Figure 12 The Airborne Concentration of Various Explosives
Figure 13 Typical Sensitivity of Various Explosive Trace Detection Technologies
Figure 14 Ion Mobility Spectroscopy (IMS)
Figure 15 Electron Capture Detectors (ECD)
Figure 16 Surface Acoustic Wave (SAW) Detectors
Figure 17 ETD People Screening Portals
Figure 18 ETD People Screening Portals – Principle of Operation
Figure 19 Trace Detection General Principle of Operation
Figure 20 Tabletop ETD Devices
Figure 21 Dose Comparison: Environmental Radiation vs. Backscatter Scan
Figure 22 Spectrum of MMWave Technologies
Figure 23 Active MMWave Imaging Technology Principles of Operation
Figure 24 A Passive MMWave Whole-Body Scanner Layout
Figure 25 Passive MMWave Scanner: Typical Threat Images
Figure 26 Electromagnetic Spectrum of the THz-Region.
Figure 27 Hand-Held Weapon Detector Proper Scanning Path
Figure 28 Single Zone Metal Detection Portal Technology
Figure 29 Walk-through metal-detection portals Technologies
Figure 30 Passive Magnetic Weapon-Detection Portal
Figure 31 Metal Detection Portals
Figure 32 Multiple-image Radiography (MIR) Technology
Figure 33 MIR Projection Images, vs. Conventional Radiography
Figure 34 a Conventional Radiograph vs. DEXI Technology
Figure 35 Biometric Identification, Drivers & Inhibitors and Government Influence
Figure 36 Global Biometric by Technology Share [%] 2009
Figure 37 Model of GE Checkpoint of the Future
Figure 38 Cast and artificial limbs screening system
Figure 39 A prosthetic limbs backscatter image showing a gun hidden underneath a cast
Figure 40 SNL – ETD MicroChemLab on a Chip.
Figure 41 Components of SNL MicroHound Trace Explosives Detection System
Figure 42 Ames ‘Conductive CNT Explosives Detector’
Figure 43 Future Screening Checkpoint (HSRC 2002 forecast)
Figure 44 Future Multi-Threat People Screening Checkpoint – (HSRC 2002 concept)
Figure 45 Airport Pre Screening Program Process
Figure 46 Airport CBP Pre-Screening Systems and Data Flow
Figure 47 IATA 2011 “Checkpoint of the Future” Concept
Figure 48 Fused Technologies- Concealed Weapons Detection
Figure 49 Molecular Imprinting Technique
Figure 50 The “checkpoint of the future” lanes
Figure 51 The “checkpoint of the future”
Figure 52 “checkpoint of the future” biometric card-passport reading station
Figure 53 “checkpoint of the future” Lane 1
Figure 54 “checkpoint of the future” Lane 2
Figure 55 “checkpoint of the future” Lane 3
Figure 56 Global People Screening Systems Sales [$Million] by Modality – 2011-2016
Figure 57 Global People Screening Systems Sales Market Share [%] by Modality – 2011 & 2016
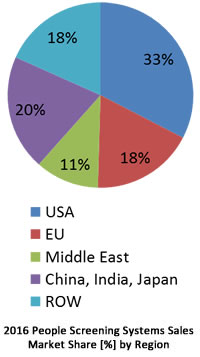
Figure 58 Global People Screening Systems Sales [%] by Region – 2011 & 2016
Figure 59 Global People Screening Portals Maintenance, Upgrade & Refurbishment Market [$Million] by Modality – 2011-2016
Figure 60 Global People Screening Portals Maintenance, Upgrade & Refurbishment Market [%] by Modality – 2011 & 2016
Figure 61 Global People Screening Portals Maintenance, Upgrade & Refurbishment Market vs. Systems Sales Market [$Million] – 2012 2016
Figure 62 Global People Screening Portals Maintenance, Upgrade & Refurbishment vs. Systems Sales Market Share [%] – 2012 2016
Figure 63 Global People Screening Market (Systems Sales, Maintenance, Upgrade & Refurbishment) [$Million] by Modality – 2011-2016
Figure 64 Global People Screening Market (Systems Sales, Maintenance, Upgrade & Refurbishment) [%] by Modality – 2011 & 2016
Figure 65 Global ETD Portals & Devices Sales [$Million] by Sector – 2011-2016
Figure 66 Global ETD Portals & Devices Sales [%] by Sector – 2011 & 2016
Figure 67 Global ETD Portals & Devices Maintenance, Upgrade & Refurbishment Market [$Million] by Sector – 2011-2016
Figure 68 Global ETD Portals & Devices – Consolidated (Systems Sales, Maintenance, Upgrade & Refurbishment) Market [$Million] by Sector – 2011-2016
Figure 69 Global ETD Portals & Devices – Consolidated (Systems Sales, Maintenance, Upgrade & Refurbishment) Market [%] by Sector – 2011 & 2016
Figure 70 US ETD Portals & Devices Market [$Million] by Sector – 2011-2016
Figure 71 EU ETD Portals & Devices Market [$Million] by Sector – 2012 2016
Figure 72 Middle East ETD Portals & Devices Market [$Million] by Sector – 2011-2016
Figure 73 China, India, Japan ETD Portals & Devices Market [$Million] by Sector – 2011-2016
Figure 74 ROW ETD Portals & Devices Market [$Million] by Sector – 2011-2016
Figure 75 Global ETD Portals & Devices Sales [$Million] by Region – 2011-2016
Figure 76 Global ETD Portals & Devices Sales [$Million] by Region – 2011 & 2016
Figure 77 Global ETD Portals & Devices Maintenance, Upgrade & Refurbishment Market [$Million] by Region – 2011-2016
Figure 78 Global ETD Portals & Devices Maintenance, Upgrade & Refurbishment Market [$Million] by Region – 2011 & 2016
Figure 79 Global ETD Portals & Devices – Systems and Maintenance, Upgrade & Refurbishment Market [$Million] by Region – 2011-2016
Figure 80 Global ETD Portals & Devices – Systems and Maintenance, Upgrade & Refurbishment Market [%] by Region – 2011 & 2016
Figure 81 ETD Portals & Devices Sales: Eight Key National Markets [$Million] – 2011-2016
Figure 82 Global Whole Body Scanners Sales [$Million] by Sector – 2011-2016
Figure 83 Global Whole Body Scanners Sales [%] by Sector – 2011 & 2016
Figure 84 Global Whole Body Scanners Maintenance, Upgrade & Refurbishment Market [$Million] by Sector – 2011-2016
Figure 85 Global Whole Body Scanners – Consolidated (Systems Sales, Maintenance, Upgrade & Refurbishment) Market [$Million] by Sector – 2011-2016
Figure 86 Global Whole Body Scanners – Consolidated (Systems Sales, Maintenance, Upgrade & Refurbishment) Market [%] by Sector – 2011 & 2016
Figure 87 US Whole Body (AIT) Scanning Systems Market [$Million] by Sector – 2011-2016
Figure 88 EU Whole Body (AIT) Scanning Systems Market [$Million] by Sector – 2009 2016
Figure 89 Middle East Whole Body (AIT) Scanning Systems Market [$Million] by Sector – 2011-2016
Figure 90 China, India, Japan Whole Body (AIT) Scanning Systems Market [$Million] by Sector – 2011-2016
Figure 91 ROW Whole Body (AIT) Scanning Systems Market [$Million] by Sector – 2011-2016
Figure 92 Global Whole Body Scanners Systems Sales [$Million] by Region – 2011-2016
Figure 93 Global Whole Body Scanners Systems Sales [$Million] by Region – 2011 & 2016
Figure 94 Global Whole Body Scanners Maintenance, Upgrade & Refurbishment Market [$Million] by Region – 2011-2016
Figure 95 Global Whole Body Scanners Maintenance, Upgrade & Refurbishment Market [$Million] by Region – 2011 & 2016Total Market by Region – 2012 2016
Figure 96 Global Whole Body Scanners – Systems and Maintenance, Upgrade & Refurbishment Market [$Million] by Region – 2011-2016
Figure 97 Global Whole Body Scanners – Systems and Maintenance, Upgrade & Refurbishment Market [%] by Region – 2011 & 2016
Figure 98 Whole Body Scanners Systems Sales: Eight Key National Markets [$Million] – 2011-2016
Figure 99 Global Metal Detection Portals & Devices Sales [$Million] by Sector – 2011-2016
Figure 100 Global Metal Detection Portals & Devices Sales [%] by Sector – 2011 & 2016
Figure 101 Global Metal Detection Portals & Devices Maintenance, Upgrade & Refurbishment Market [$Million] by Sector – 2011-2016
Figure 102 Global Metal Detection Portals & Devices – Consolidated (Systems Sales, Maintenance, Upgrade & Refurbishment) Market [$Million] by Sector – 2011-2016
Figure 103 Global Metal Detection Portals & Devices – Consolidated (Systems Sales, Maintenance, Upgrade & Refurbishment) Market [%] by Sector – 2011 & 2016
Figure 104 US Metal Detection Portals & Devices Systems Market [$Million] by Sector – 2011-2016
Figure 105 EU Metal Detection Portals & Devices Systems Market [$Million] by Sector – 2012 2016
Figure 106 EU Metal Detection Portals & Devices Systems Market [$Million] by Sector – 2012 2016
Figure 107 Middle East Metal Detection Portals & Devices Systems Market [$Million] by Sector – 2011-2016
Figure 108 China, India, Japan Metal Detection Portals & Devices Systems Market [$Million] by Sector – 2011-2016
Figure 109 ROW Metal Detection Portals & Devices Systems Market [$Million] by Sector – 2011-2016
Figure 110 Global Metal Detection Portals & Devices Systems Sales [$Million] by Region – 2011-2016
Figure 111 Global Metal Detection Portals & Devices Systems Sales [$Million] by Region – 2011 & 2016
Figure 112 Global Metal Detection Portals & Devices Maintenance, Upgrade & Refurbishment Market [$Million] by Region – 2011-2016
Figure 113 Global Metal Detection Portals & Devices Maintenance, Upgrade & Refurbishment Market [$Million] by Region – 2011-2016
Figure 114 Global Metal Detection Portals & Devices Maintenance, Upgrade & Refurbishment Market [$Million] by Region – 2011 & 2016
Figure 115 Global Metal Detection Portals & Devices – Systems and Maintenance, Upgrade & Refurbishment Market [$Million] by Region – 2011-2016
Figure 116 Global Metal Detection Portals & Devices – Systems and Maintenance, Upgrade & Refurbishment Market [%] by Region – 2011 & 2016
Figure 117 Metal Detection Systems Sales: Eight Key National Markets [$Million] – 2011-2016
Figure 118 Global Shoe Scanning – Consolidated (Systems Sales, Maintenance, Upgrade & Refurbishment) Market [$Million] by Sector – 2011-2016
Figure 119 Global Shoe Scanning – Consolidated (Systems Sales, Maintenance, Upgrade & Refurbishment) Market [%] by Sector – 2011 & 2016
Figure 120 Global Shoe Scanning Systems Sales [$Million] by Region – 2011-2016
Figure 121 Global Shoe Scanning Systems Sales [$Million] by Region – 2011 & 2016
Figure 122 Global Shoe Scanning Maintenance, Upgrade & Refurbishment Market [$Million] by Region – 2011-2016
Figure 123 Global Shoe Scanning Maintenance, Upgrade & Refurbishment Market [$Million] by Region – 2010 & 2014
Figure 124 Global Shoe Scanning – Systems and Maintenance, Upgrade & Refurbishment Market [$Million] by Region – 2011-2016
Figure 125 Global Shoe Scanning – Systems and Maintenance, Upgrade & Refurbishment Market [%] by Region – 2011 & 2016
Figure 126 Shoe Scanning Systems Sales: Eight Key National Markets [$Million] – 2011-2016
Figure 127 Global Liquid Explosives Scanners – Consolidated (Systems Sales, Maintenance, Upgrade & Refurbishment) Market [$Million] by Sector – 2011-2016
Figure 128 Global Liquid Explosives Scanners – Consolidated (Systems Sales, Maintenance, Upgrade & Refurbishment) Market [%] by Sector – 2011 & 2016
Figure 129 Global Liquid Explosives Scanners Sales [$Million] by Region – 2011-2016
Figure 130 Global Liquid Explosives Scanners Sales [$Million] by Region – 2011 & 2016
Figure 131 Global Liquid Explosives Scanners Maintenance, Upgrade & Refurbishment Market [$Million] by Region – 2011-2016
Figure 132 Global Liquid Explosives Scanners Maintenance, Upgrade & Refurbishment Market [$Million] by Region – 2011 & 2016
Figure 133 Global Liquid Explosives Scanners – Systems and Maintenance, Upgrade & Refurbishment Market [$Million] by Region – 2011-2016
Figure 134 Global Liquid Explosives Scanners – Systems and Maintenance, Upgrade & Refurbishment Market [%] by Region – 2011 & 2016
Figure 135 Liquid Explosives Scanners Sales: Eight Key National Markets [$Million] – 2011-2016
Figure 136 Global Multi-Modal & Multi-Threat Portals Sales [$Million] by Sector – 2011-2016
Figure 137 Global Multi-Modal & Multi-Threat Portals Sales [%] by Sector – 2011 & 2016
Figure 138 Global Multi-Modal & Multi-Threat Portals Maintenance, Upgrade & Refurbishment Market [$Million] by Sector – 2011-2016
Figure 139 Global Multi-Modal & Multi-Threat Portals – Consolidated (Systems Sales, Maintenance, Upgrade & Refurbishment) Market [$Million] by Sector – 2011-2016
Figure 140 Global Multi-Modal & Multi-Threat Portals – Consolidated (Systems Sales, Maintenance, Upgrade & Refurbishment) Market [%] by Sector – 2011 & 2016
Figure 141 US Multi-Modal & Multi-Threat Portals – Systems Market [$Million] by Sector – 2011-2016
Figure 142 EU Multi-Modal & Multi-Threat Portals – Systems Market [$Million] by Sector – 2012 2016
Figure 143 Middle East Multi-Modal & Multi-Threat Portals – Systems Market [$Million] by Sector – 2011-2016
Figure 144 China, India, Japan Multi-Modal & Multi-Threat Portals – Systems Market [$Million] by Sector – 2011-2016
Figure 145 ROW Multi-Modal & Multi-Threat Portals – Systems Market [$Million] by Sector – 2011-2016
Figure 146 Global Multi-Modal & Multi-Threat Portals Sales [$Million] by Region – 2011-2016
Figure 147 Global Multi-Modal & Multi-Threat Portals Sales [$Million] by Region – 2011 & 2016
Figure 148 Global Multi-Modal & Multi-Threat Portals Maintenance, Upgrade & Refurbishment Market [$Million] by Region – 2011-2016
Figure 149 Global Multi-Modal & Multi-Threat Portals Maintenance, Upgrade & Refurbishment Market [$Million] by Region – 2011 & 2016
Figure 150 Global Multi-Modal & Multi-Threat Portals – Systems and Maintenance, Upgrade & Refurbishment Market [$Million] by Region – 2011-2016
Figure 151 Global Multi-Modal & Multi-Threat Portals – Systems and Maintenance, Upgrade & Refurbishment Market [%] by Region – 2011 & 2016
Figure 152 Multi-Modal & Multi-Threat Portals Systems Sales: Eight Key National Markets [$Million] – 2011-2016
Figure 153 Global People Screening Market (Systems Sales, Maintenance, Upgrade & Refurbishment) by End User [$Million] – 2012-2016
Figure 154 Global People Screening Market Share (Systems Sales, Maintenance, Upgrade & Refurbishment) by End User [%] 2012 & 2016
Figure 155 Airport Passengers Screening Market (Systems Sales, Maintenance, Upgrade & Refurbishment) by End User [$Million] – 2012-2016
Figure 156 Land/Sea Transportation Passengers Screening Market (Systems Sales, Maintenance, Upgrade & Refurbishment) by End User [$Million] – 2012-2016
Figure 157 Land Border Screening Market (Systems Sales, Maintenance, Upgrade & Refurbishment) by End User [$Million] – 2012-2016
Figure 158 Land Border Screening Market (Systems Sales, Maintenance, Upgrade & Refurbishment) by End User [$Million] – 2012-2016
Figure 159 Embassies and Consulates Screening Market (Systems Sales, Maintenance, Upgrade & Refurbishment) by End User [$Million] – 2012-2016
Figure 160 Prison Screening Market (Systems Sales, Maintenance, Upgrade & Refurbishment) by End User [$Million] – 2012-2016
Figure 161 Government Secured Facilities Screening Market (Systems Sales, Maintenance, Upgrade & Refurbishment) by End User [$Million] – 2012-2016
Figure 162 Public Gathering Events People Screening Market (Systems Sales, Maintenance, Upgrade & Refurbishment) by End User [$Million] – 2012-2016
Figure 163 Private Sector People Screening Market (Systems Sales, Maintenance, Upgrade & Refurbishment) by End User [$Million] – 2012-2016
Figure 164 Airport Passengers Screening Market (Systems Sales, Maintenance, Upgrade & Refurbishment) by End User [$Million] – 2012-2016
Figure 165 TSA Organizational Chart
Figure 166 TSA Budget Structure [%]
Figure 167 People Screening Systems Sales [$Million] by Modality – 2011-2016 – US
Figure 168 People Screening Systems Sales [%] by Modality 2011 & 2016 US
Figure 169 UK Homeland Security, Homeland Defense and Counter Terror Intelligence Organizational Chart
Figure 170 People Screening Systems Sales [$Million] by Modality – 2011-2016 – UK
Figure 171 People Screening Systems Sales [%] by Modality 2011 & 2016 – UK
Figure 172 The German Homeland Security, Homeland Defence and Counter Terror Intelligence Organization Chart
Figure 173 People Screening Systems Sales [$Million] by Modality – 2011-2016 Germany
Figure 174 People Screening Systems Sales [%] by Modality – 2011 & 2016 Germany
Figure 175 Spanish Homeland Security, Homeland Defense and Counter Terror Intelligence Organizational Chart
Figure 176 People Screening Systems Sales [$Million] by Modality – 2011-2016 – Spain
Figure 177 People Screening Systems Sales [%] by Modality – 2011 & 2016 – Spain
Figure 178 Indian Homeland Security, Homeland Defense and Counter Terror Intelligence Organizational Chart
Figure 179 Bureau of Civil Aviation Security Organizational Chart
Figure 180 People Screening Systems Sales [$Million] by Modality – 2011-2016 – India
Figure 181 People Screening Systems Sales [%] by Modality – 2011 & 2016 – India
Figure 182 China Internal Security and Intelligence community Organizational Chart
Figure 183 People Screening Systems Sales [$Million] by Modality – 2011-2016 – China
Figure 184 People Screening Systems Sales [%] by Modality – 2011 & 2016 – China
Figure 185 Japanese Homeland Security, Homeland Defense and Counter Terror Intelligence Organizational Chart
Figure 186 People Screening Systems Sales [$Million] by Modality – 2011-2016 – Japan
Figure 187 People Screening Systems Sales [%] by Modality – 2011 & 2016 – Japan
Figure 188 Brazilian Security organization
Figure 189 People Screening Systems Sales [$Million] by Modality – 2011-2016 – Brazil
Figure 190 People Screening Systems Sales [%] by Modality – 2011 & 2016 – Brazil
Figure 191 Standoff Electromagnetic Concealed Weapons Detection
Figure 192 Magnetic Signature Analysis System: Functional Block Diagram
Figure 193 Covert MMWave Sensor at a Door
Figure 194 Screening of Hand-held Baggage
Figure 195 Focal Plane Array Passive Standoff MMWave System
Figure 196 A Walk-By Passive MMWave Imaging System
Figure 197 Covert Walk-By Passive MMWave Images
Figure 198 Example of FTIR Application at Border Checkpoint Facilities
Figure 199 Biometric People Screening Corridor
Figure 200 Field of View of a Fused Video Surveillance and Biometrics
Figure 201 A Corridor CCTV & Biometric Portal Layout
Figure 202 Future People/Baggage Screening Turnstiles (Artist Rendition)
Figure 203  Profiling and Behavior Tracking Principles of Operation

Questions about this report?

Contact Sales: 1-571-527-1010 or Analysts: 1-202-455-0966

  • Have a question about People Screening Technologies & Global Markets - 2012-2016
    Please fill out all fields in the form below and click "Submit" to send your question.
    Our representative will review your question and contact you with an answer as soon as possible.
  • 2+2=
  • This field is for validation purposes and should be left unchanged.
1
Interested in this report? Need more information?
X
Powered By